| Param | Original file | Final file |
|---|---|---|
| Filename | modeM0/AS1A12_044T04_9000005464_39303cztM0_level2.fits | modeM0/AS1A12_044T04_9000005464_39303cztM0_level2_quad_clean.evt |
| Size (bytes) | 535,046,400 | 77,457,600 |
| Size | 510.3 MB | 73.9 MB |
| Events in quadrant A | 2,853,491 | 622,131 |
| Events in quadrant B | 3,209,625 | 614,334 |
| Events in quadrant C | 2,998,460 | 611,132 |
| Events in quadrant D | 10,362,872 | 154,429 |
| Mode M0 | |||
|---|---|---|---|
| Quadrant | BADHDUFLAG | Total packets | Discarded packets |
| A | 0 | 11331 | 3 |
| B | 0 | 12488 | 2 |
| C | 0 | 11738 | 2 |
| D | 0 | 34128 | 2 |
| Mode SS | |||
|---|---|---|---|
| Quadrant | BADHDUFLAG | Total packets | Discarded packets |
| A | 0 | 100 | 0 |
| B | 0 | 100 | 0 |
| C | 0 | 100 | 0 |
| D | 0 | 100 | 0 |
| Mode M9 | |||
|---|---|---|---|
| Quadrant | BADHDUFLAG | Total packets | Discarded packets |
| A | 0 | 35 | 0 |
| B | 0 | 35 | 0 |
| C | 0 | 35 | 0 |
| D | 0 | 36 | 0 |
| Quadrant | Total seconds | Saturated seconds | Saturation percentage |
|---|---|---|---|
| A | 4897 | 40 | 0.816827% |
| B | 4897 | 287 | 5.860731% |
| C | 4897 | 58 | 1.184399% |
| D | 4897 | 3694 | 75.433939% |
Noise dominated data is calculated using 1-second bins in cleaned event files. If a bin has >2000 counts, and if more than 50% of those come from <1% of pixels, then it is considered to be noise-dominated and hence unusable.
| Quadrant | # 1 sec bins | Bins with >0 counts | Bins with >2000 counts | High rate bins dominated by noise | Noise dominated (total time) | Noise dominated (detector-on time) | Marked lightcurve |
|---|---|---|---|---|---|---|---|
| A | 7049 | 4898 | 22 | 22 | 0.31% | 0.45% | 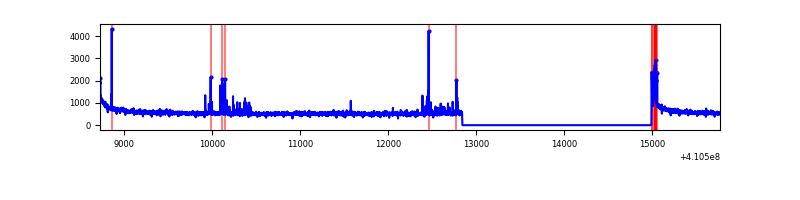 |
| B | 7049 | 4898 | 210 | 210 | 2.98% | 4.29% | 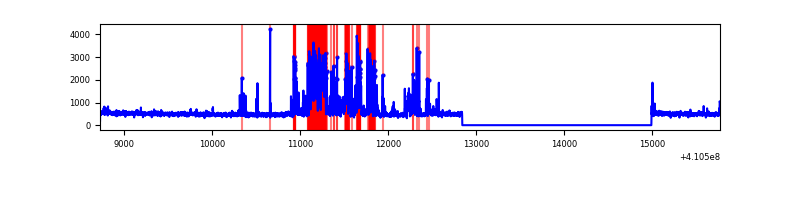 |
| C | 7049 | 4898 | 54 | 54 | 0.77% | 1.10% | 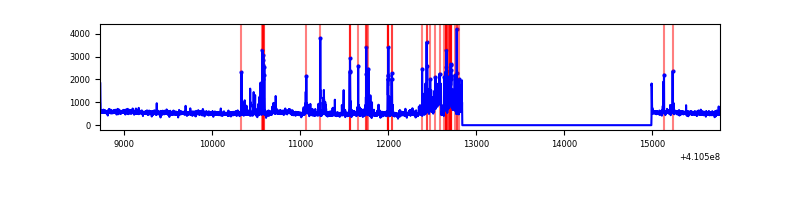 |
| D | 7049 | 4898 | 3099 | 3099 | 43.96% | 63.27% | 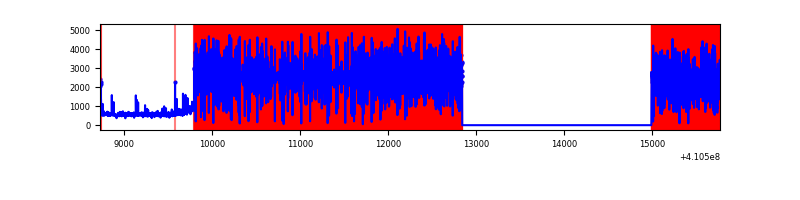 |
Top three noisy pixels from each quadrant. If the there are fewer than three noisy pixels in the level2.evt file, extra rows are filled as -1
| Pixel properties | Quadrant properties | ||||||
|---|---|---|---|---|---|---|---|
| Quadrant | DetID | PixID | Counts | Sigma | Mean | Median | Sigma |
| A | 10 | 83 | 433402 | 3637.9 | 589 | 577 | 119.0 |
| A | 13 | 248 | 122980 | 1028.8 | 589 | 577 | 119.0 |
| A | 10 | 255 | 8994 | 70.74 | 589 | 577 | 119.0 |
| B | 5 | 172 | 787654 | 7259.78 | 572 | 557 | 108.4 |
| B | 0 | 229 | 108540 | 995.98 | 572 | 557 | 108.4 |
| B | 5 | 255 | 18205 | 162.78 | 572 | 557 | 108.4 |
| C | 14 | 254 | 504001 | 3815.39 | 570 | 574 | 131.9 |
| C | 15 | 214 | 212069 | 1602.88 | 570 | 574 | 131.9 |
| C | 6 | 255 | 24949 | 184.73 | 570 | 574 | 131.9 |
| D | 12 | 235 | 8749948 | 116330.46 | 308 | 300 | 75.2 |
| D | 12 | 233 | 152305 | 2020.97 | 308 | 300 | 75.2 |
| D | 5 | 222 | 59895 | 792.34 | 308 | 300 | 75.2 |
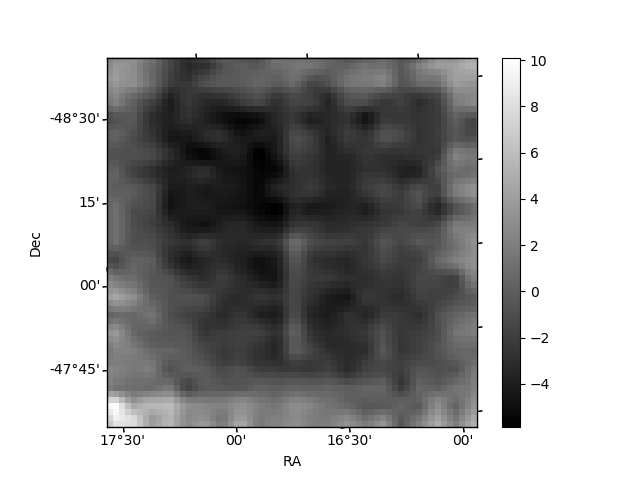
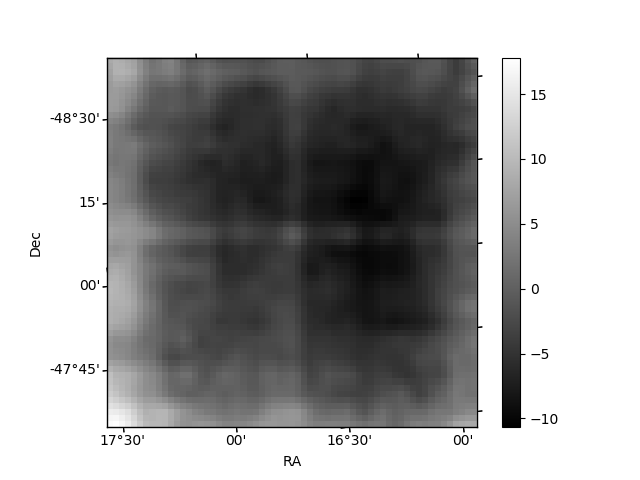
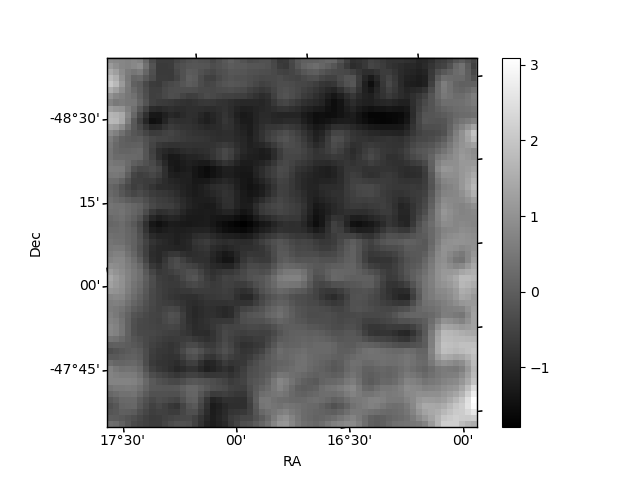
Histogram calculated using DETX and DETY for each event in the final _common_clean file
| Quadrant A | 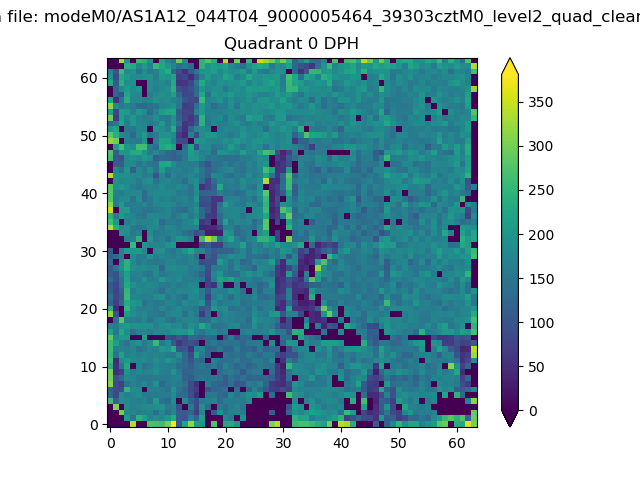 |
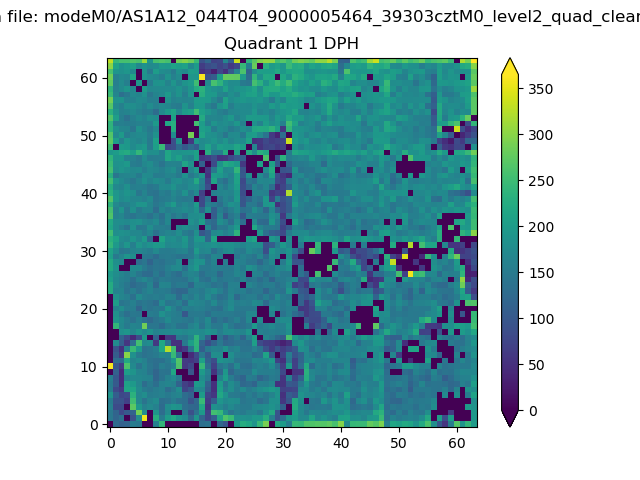 |
Quadrant B |
|---|---|---|---|
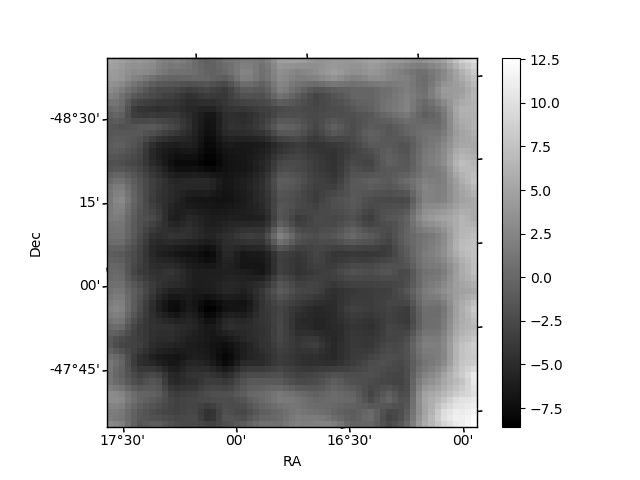
| Quadrant D |  |
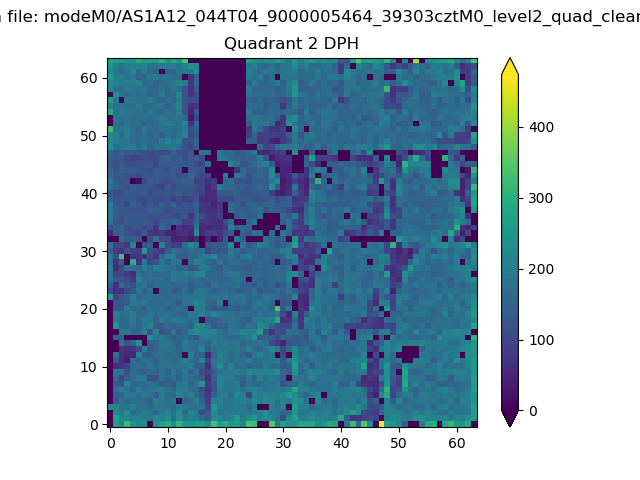 |
Quadrant C |
| Plot type | Count rate plots | Images |
|---|---|---|
| Comparison with Poisson distribution Blue bars denote a histogram of data divided into 1 sec bins. Red curve is a Poisson curve with rate = median count rate of data. |
 |
 |
| Quadrant-wise count rates Data is divided into 100 sec bins |
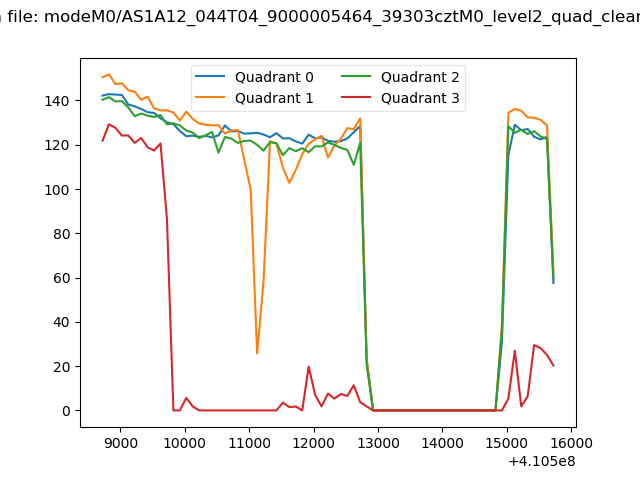 |
|
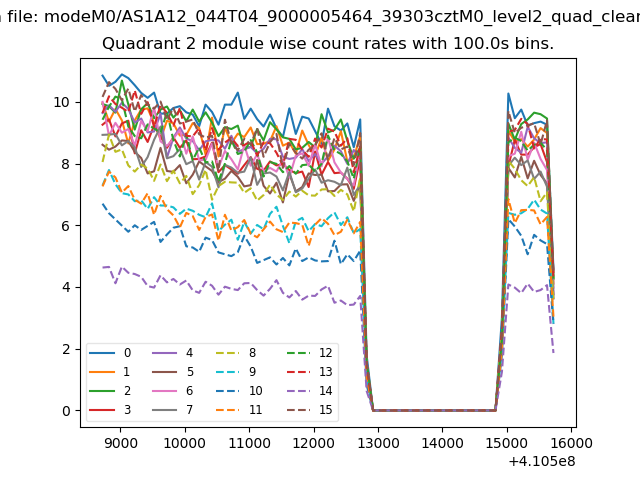
| Module-wise count rates for Quadrant A Data is divided into 100 sec bins |
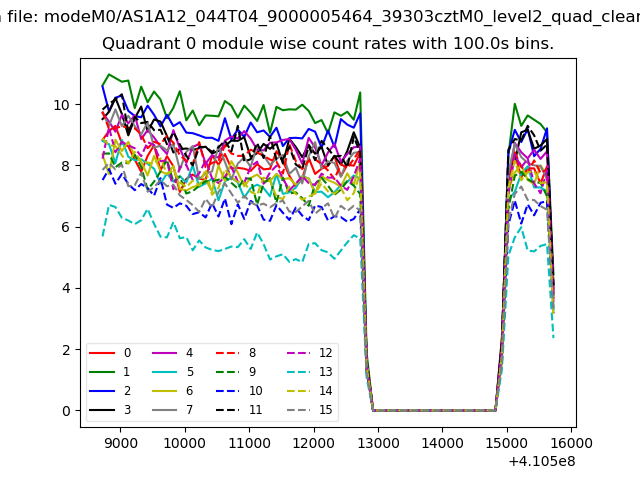 |
 |
| Module-wise count rates for Quadrant B Data is divided into 100 sec bins |
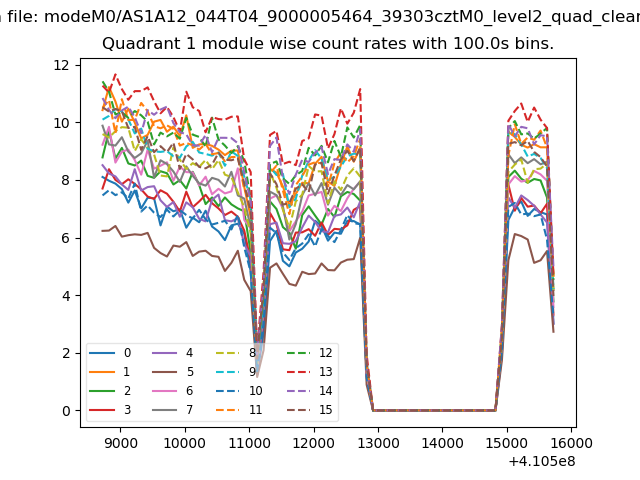 |
 |
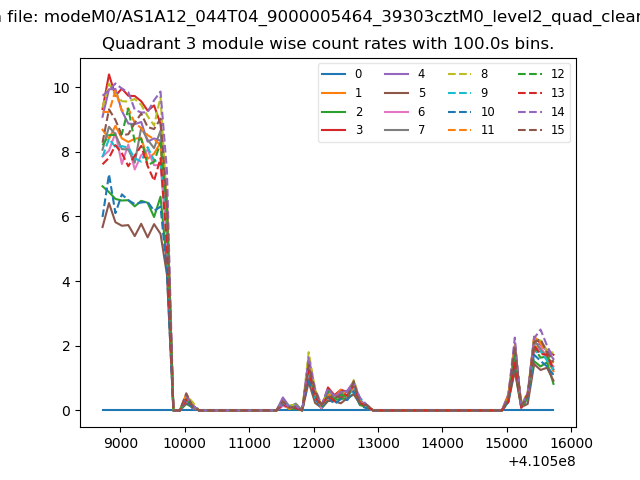
| Module-wise count rates for Quadrant C Data is divided into 100 sec bins |
 |
 |
| Module-wise count rates for Quadrant D Data is divided into 100 sec bins |
 |
 |
| Parameter | Plot |
|---|---|
| CZT HV Monitor | 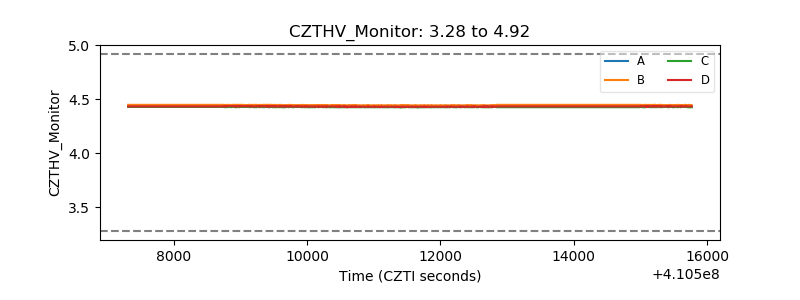 |
| D_VDD | 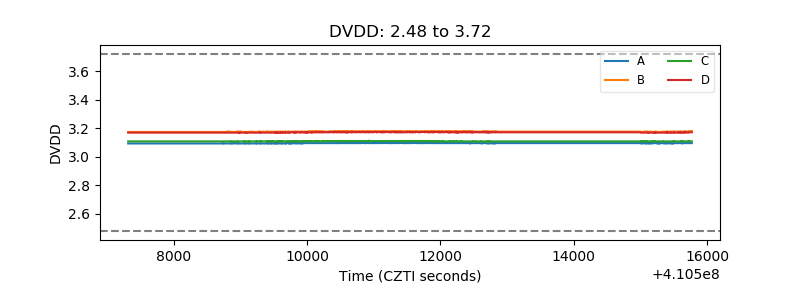 |
| Temperature 1 | 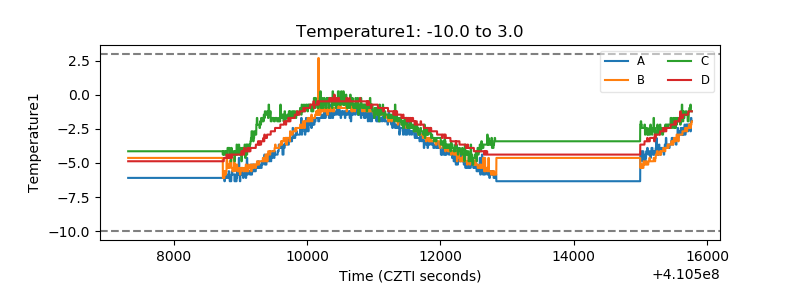 |
| Veto HV Monitor | 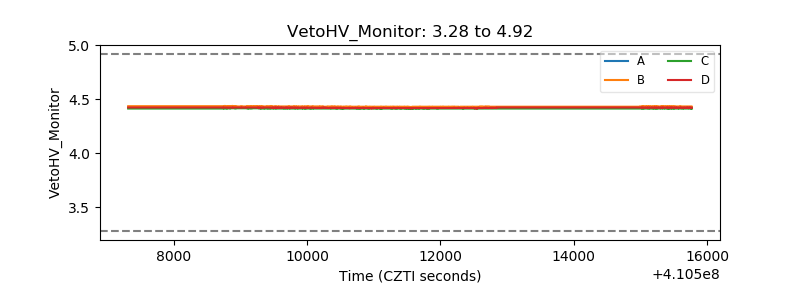 |
| Veto LLD | 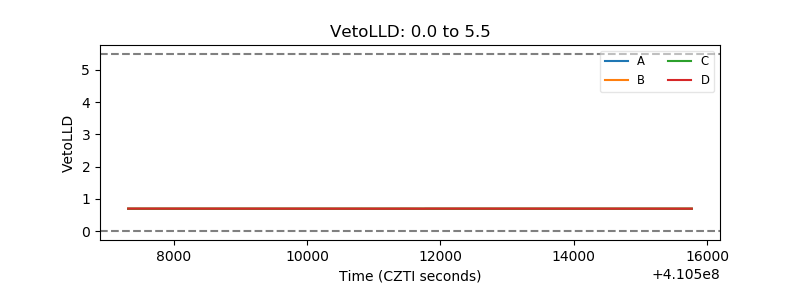 |
| Alpha Counter | 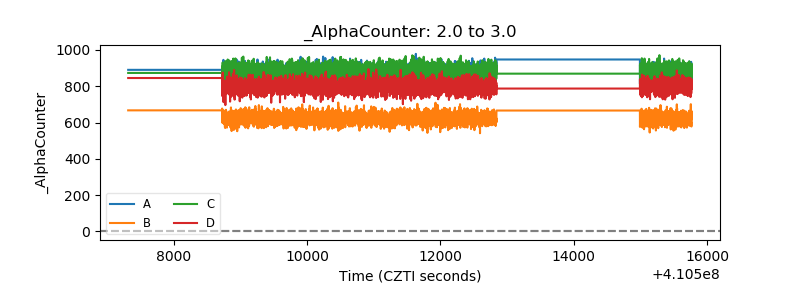 |
| _CPM_Rate | 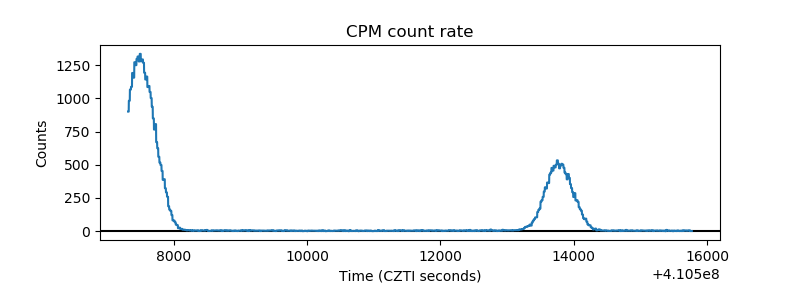 |
| CZT Counter | 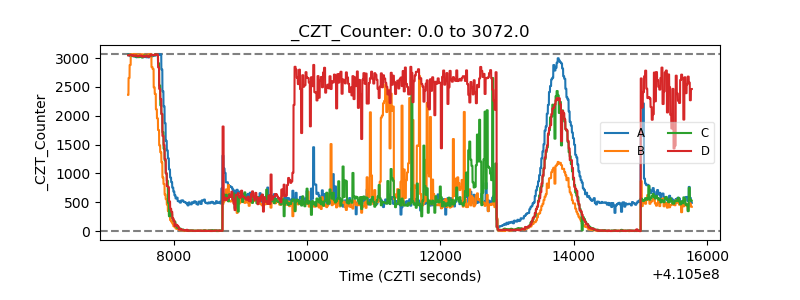 |
| +2.5 Volts monitor | 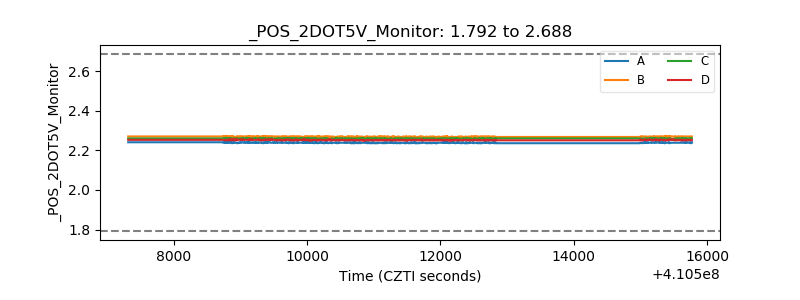 |
| +5 Volts monitor | 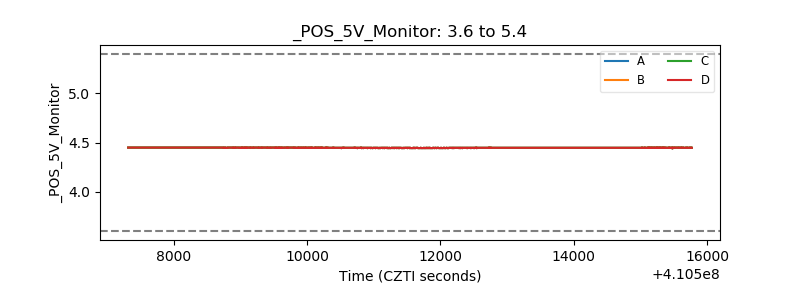 |
| _ROLL_ROT | 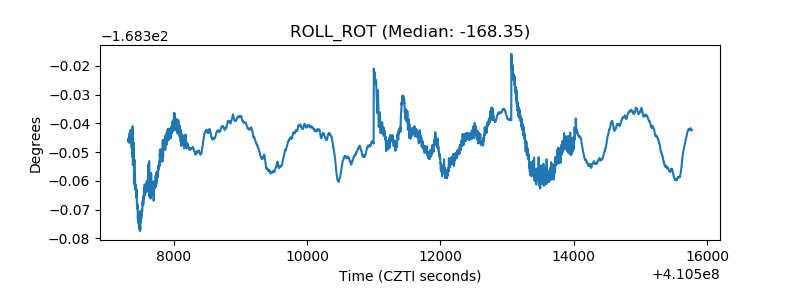 |
| _Roll_DEC | 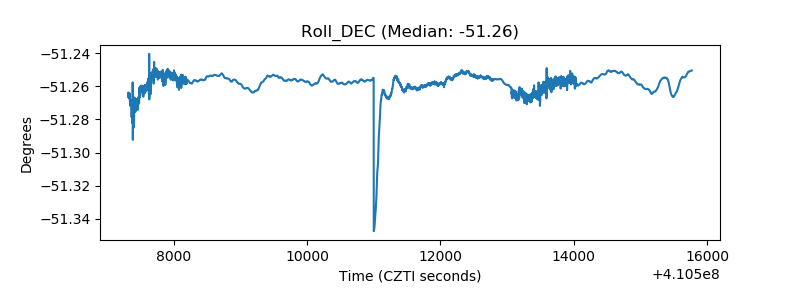 |
| _Roll_RA | 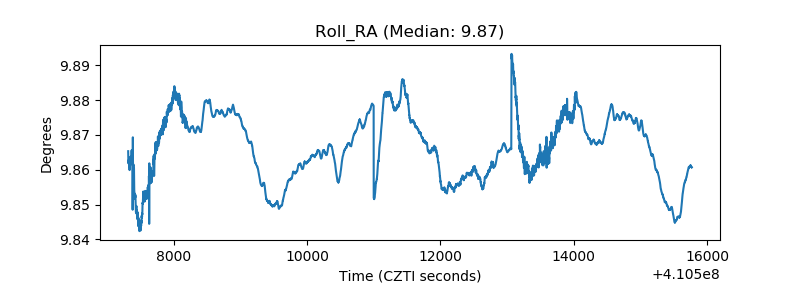 |
| Veto Counter | 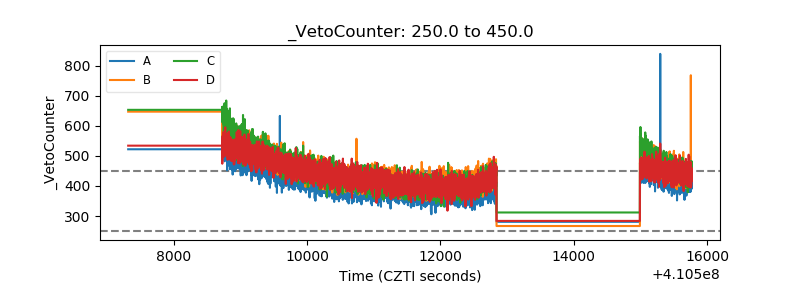 |