| Param | Original file | Final file |
|---|---|---|
| Filename | modeM0/AS1A12_044T04_9000005464_39304cztM0_level2.fits | modeM0/AS1A12_044T04_9000005464_39304cztM0_level2_quad_clean.evt |
| Size (bytes) | 530,735,040 | 75,778,560 |
| Size | 506.1 MB | 72.3 MB |
| Events in quadrant A | 3,067,055 | 592,583 |
| Events in quadrant B | 2,962,436 | 602,525 |
| Events in quadrant C | 2,714,974 | 584,383 |
| Events in quadrant D | 10,512,366 | 164,482 |
| Mode M0 | |||
|---|---|---|---|
| Quadrant | BADHDUFLAG | Total packets | Discarded packets |
| A | 0 | 12099 | 3 |
| B | 0 | 11993 | 2 |
| C | 0 | 11124 | 2 |
| D | 0 | 34655 | 2 |
| Mode SS | |||
|---|---|---|---|
| Quadrant | BADHDUFLAG | Total packets | Discarded packets |
| A | 0 | 102 | 0 |
| B | 0 | 102 | 0 |
| C | 0 | 102 | 0 |
| D | 0 | 102 | 0 |
| Mode M9 | |||
|---|---|---|---|
| Quadrant | BADHDUFLAG | Total packets | Discarded packets |
| A | 0 | 27 | 0 |
| B | 0 | 27 | 0 |
| C | 0 | 27 | 0 |
| D | 0 | 28 | 0 |
| Quadrant | Total seconds | Saturated seconds | Saturation percentage |
|---|---|---|---|
| A | 4998 | 84 | 1.680672% |
| B | 4998 | 131 | 2.621048% |
| C | 4998 | 42 | 0.840336% |
| D | 4998 | 3639 | 72.809124% |
Noise dominated data is calculated using 1-second bins in cleaned event files. If a bin has >2000 counts, and if more than 50% of those come from <1% of pixels, then it is considered to be noise-dominated and hence unusable.
| Quadrant | # 1 sec bins | Bins with >0 counts | Bins with >2000 counts | High rate bins dominated by noise | Noise dominated (total time) | Noise dominated (detector-on time) | Marked lightcurve |
|---|---|---|---|---|---|---|---|
| A | 7060 | 4999 | 64 | 64 | 0.91% | 1.28% | 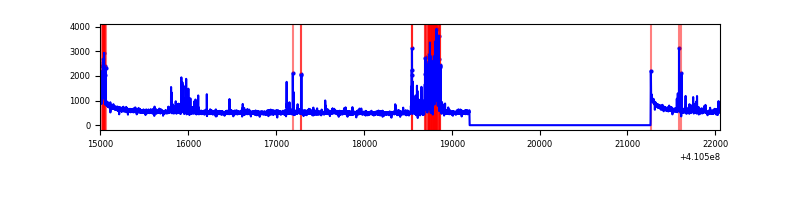 |
| B | 7060 | 4999 | 111 | 111 | 1.57% | 2.22% | 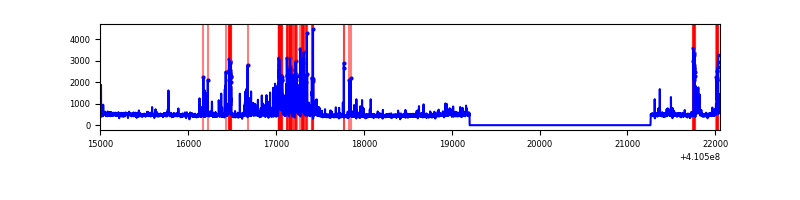 |
| C | 7060 | 4999 | 34 | 34 | 0.48% | 0.68% | 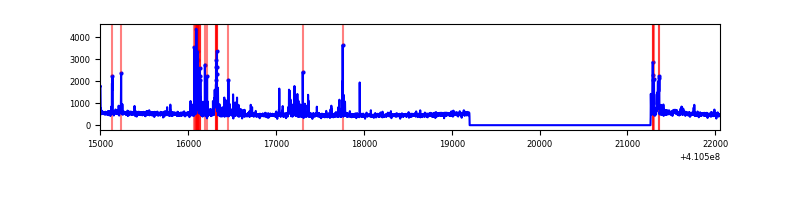 |
| D | 7060 | 4999 | 2835 | 2835 | 40.16% | 56.71% | 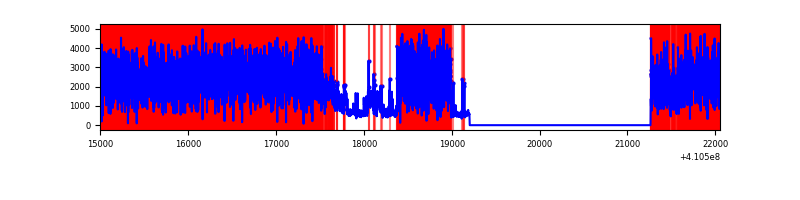 |
Top three noisy pixels from each quadrant. If the there are fewer than three noisy pixels in the level2.evt file, extra rows are filled as -1
| Pixel properties | Quadrant properties | ||||||
|---|---|---|---|---|---|---|---|
| Quadrant | DetID | PixID | Counts | Sigma | Mean | Median | Sigma |
| A | 10 | 83 | 462039 | 3964.12 | 573 | 561 | 116.4 |
| A | 13 | 248 | 339165 | 2908.63 | 573 | 561 | 116.4 |
| A | 2 | 79 | 18311 | 152.47 | 573 | 561 | 116.4 |
| B | 0 | 186 | 341311 | 3162.28 | 565 | 552 | 107.8 |
| B | 0 | 229 | 227221 | 2103.51 | 565 | 552 | 107.8 |
| B | 5 | 184 | 57037 | 524.19 | 565 | 552 | 107.8 |
| C | 14 | 254 | 250187 | 1975.58 | 552 | 555 | 126.4 |
| C | 15 | 214 | 218011 | 1720.94 | 552 | 555 | 126.4 |
| C | 9 | 187 | 67020 | 526.0 | 552 | 555 | 126.4 |
| D | 12 | 235 | 8022258 | 92920.69 | 346 | 335 | 86.3 |
| D | 5 | 222 | 847139 | 9808.82 | 346 | 335 | 86.3 |
| D | 13 | 249 | 54665 | 629.32 | 346 | 335 | 86.3 |
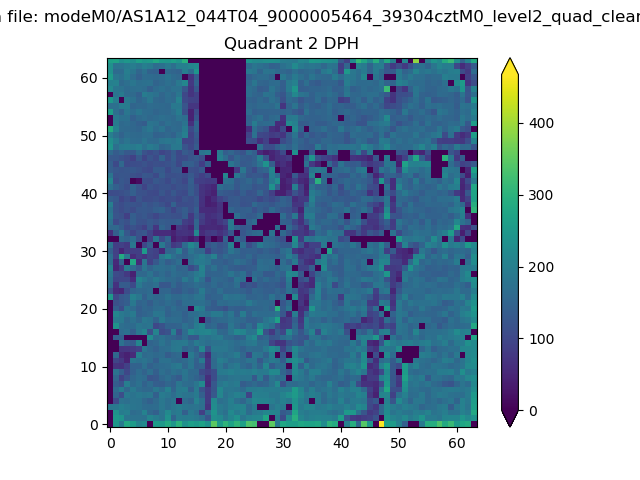
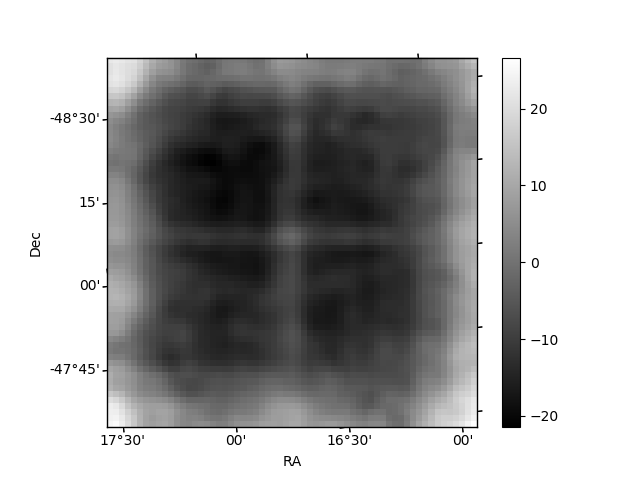
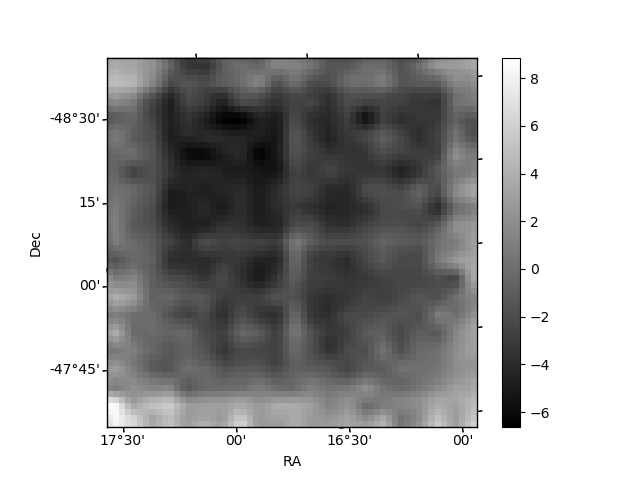
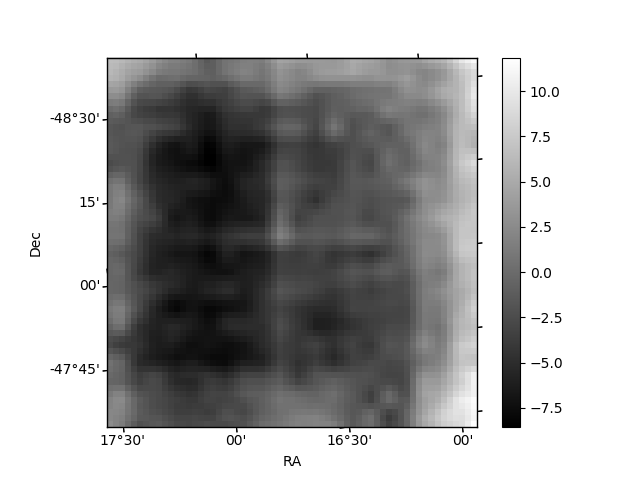
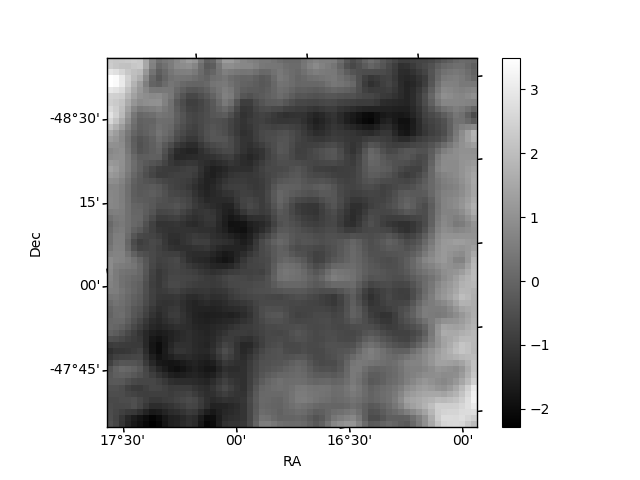
Histogram calculated using DETX and DETY for each event in the final _common_clean file
| Quadrant A | 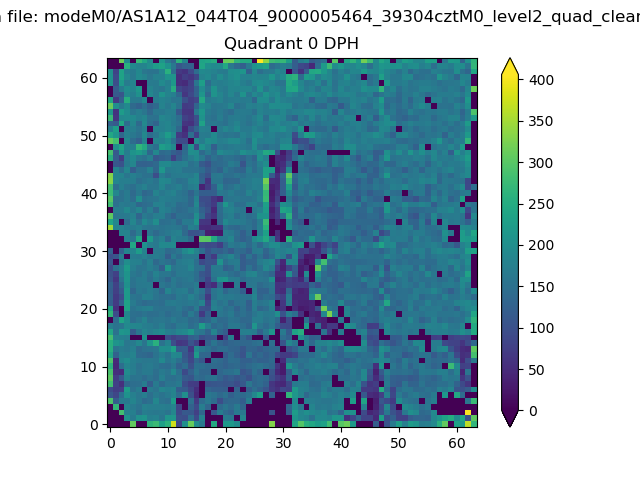 |
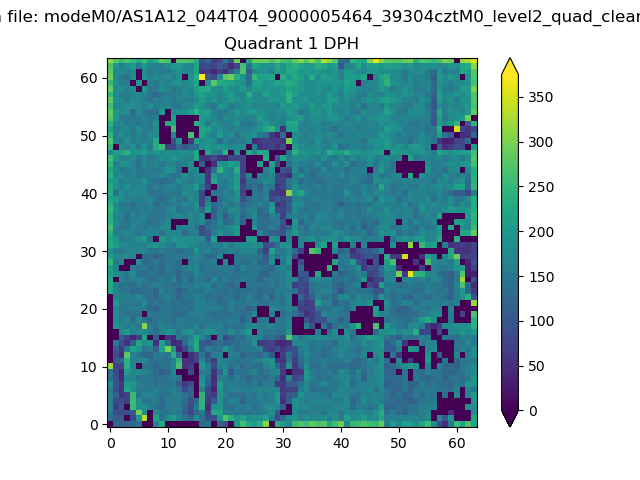 |
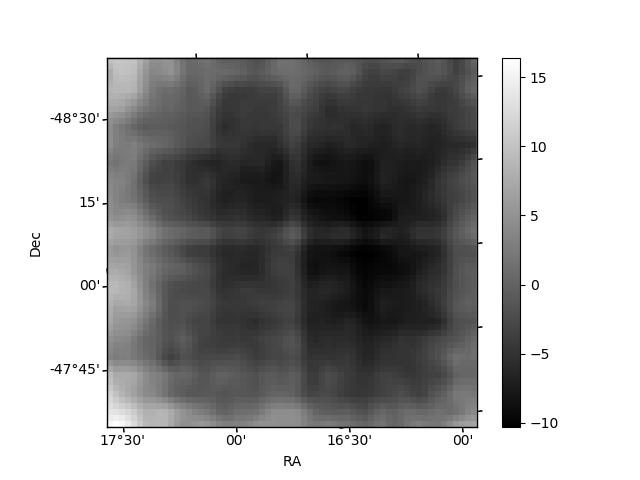
Quadrant B |
|---|---|---|---|
| Quadrant D | 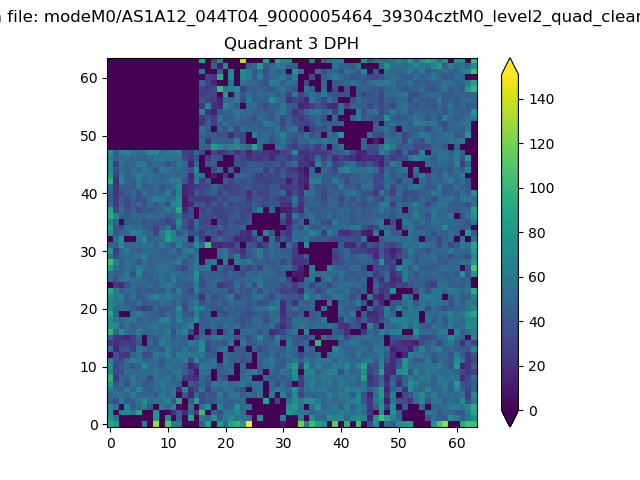 |
 |
Quadrant C |
| Plot type | Count rate plots | Images |
|---|---|---|
| Comparison with Poisson distribution Blue bars denote a histogram of data divided into 1 sec bins. Red curve is a Poisson curve with rate = median count rate of data. |
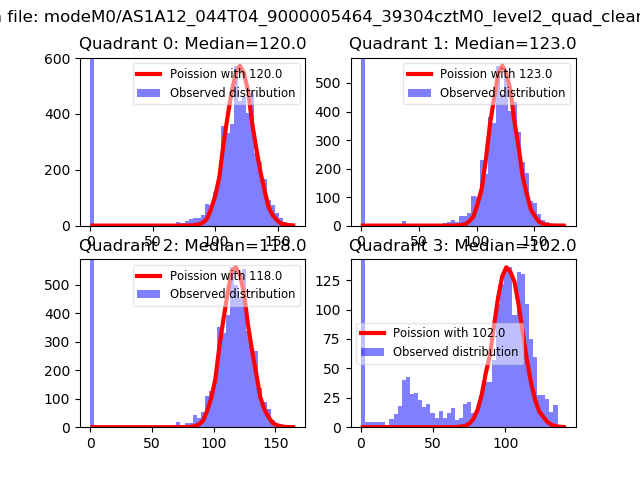 |
 |
| Quadrant-wise count rates Data is divided into 100 sec bins |
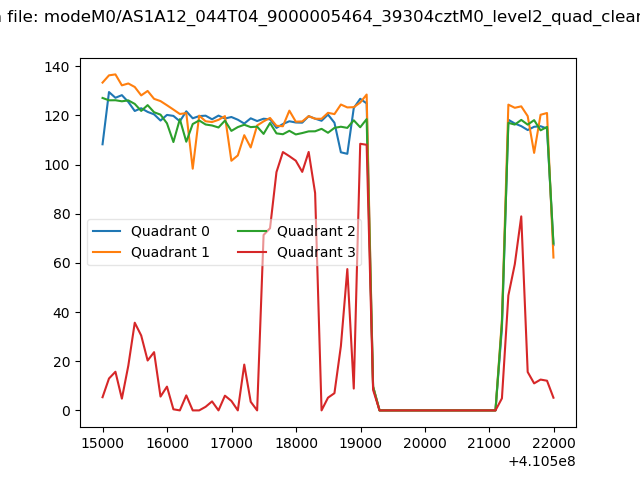 |
|
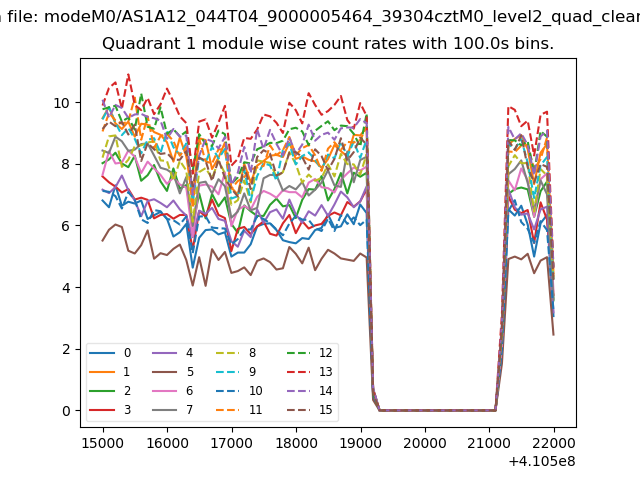
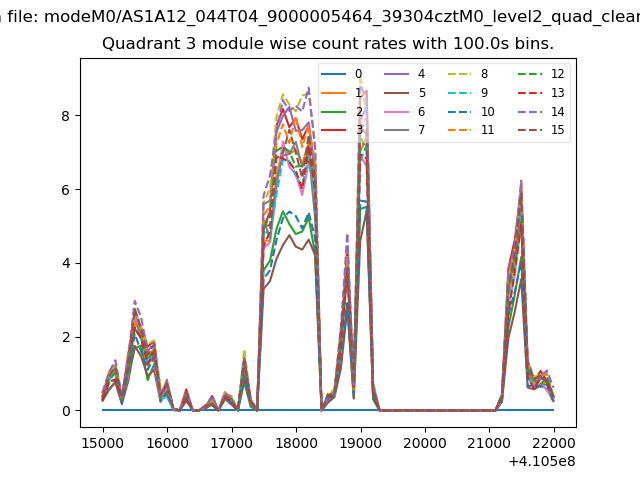
| Module-wise count rates for Quadrant A Data is divided into 100 sec bins |
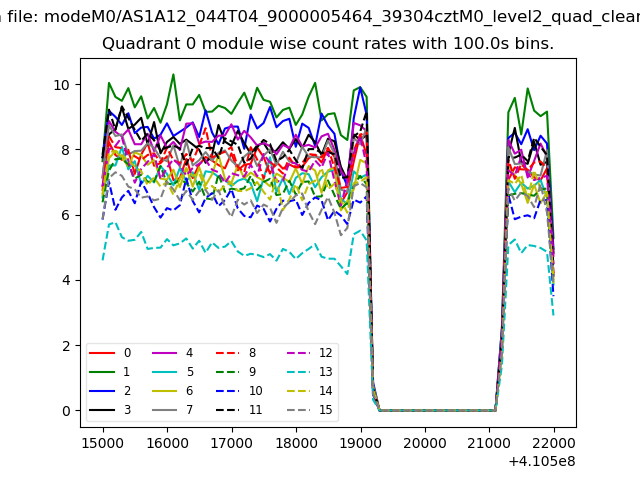 |
 |
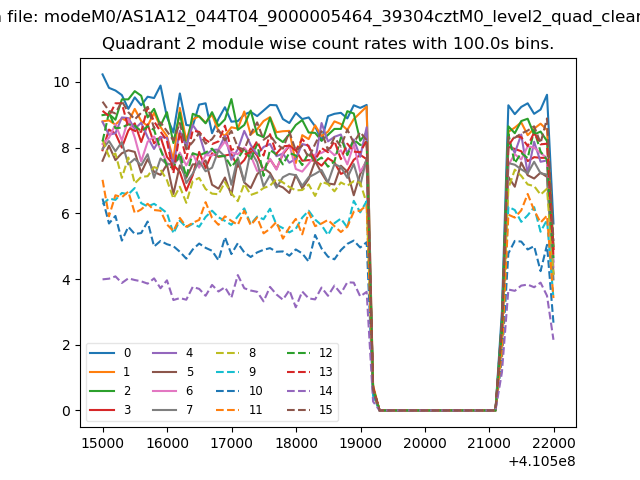
| Module-wise count rates for Quadrant B Data is divided into 100 sec bins |
 |
 |
| Module-wise count rates for Quadrant C Data is divided into 100 sec bins |
 |
 |
| Module-wise count rates for Quadrant D Data is divided into 100 sec bins |
 |
 |
| Parameter | Plot |
|---|---|
| CZT HV Monitor | 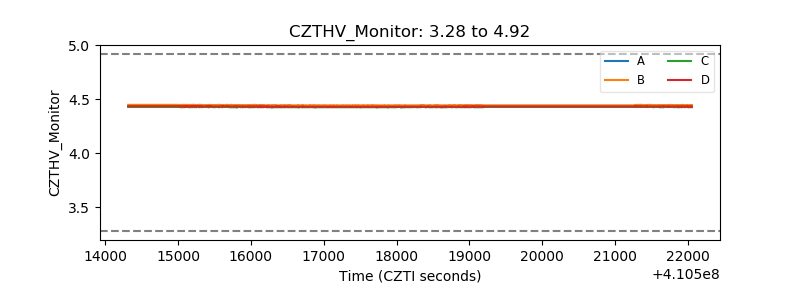 |
| D_VDD | 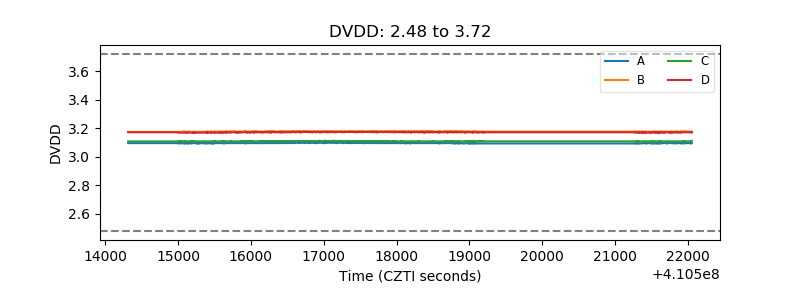 |
| Temperature 1 | 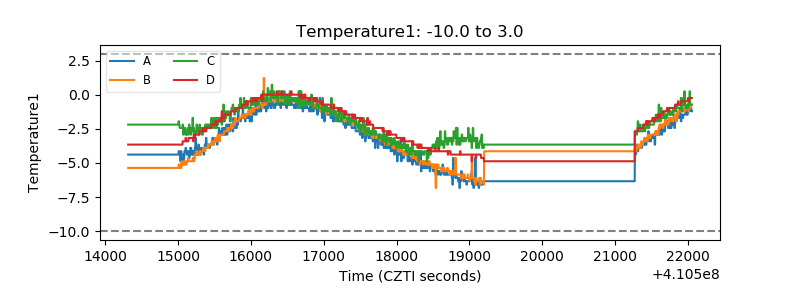 |
| Veto HV Monitor | 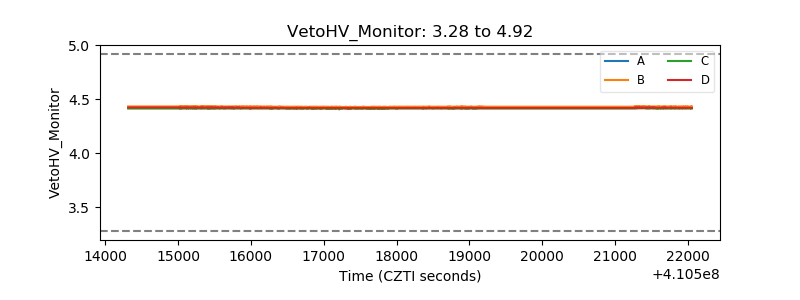 |
| Veto LLD | 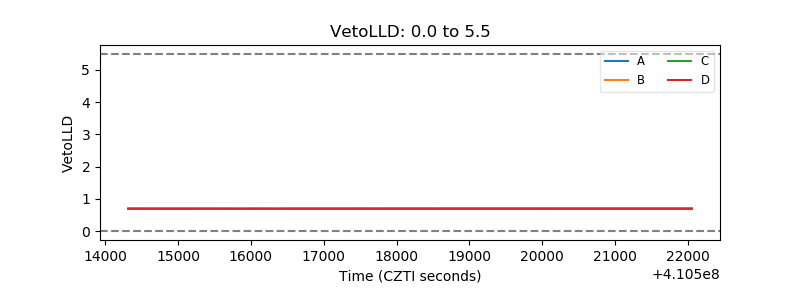 |
| Alpha Counter | 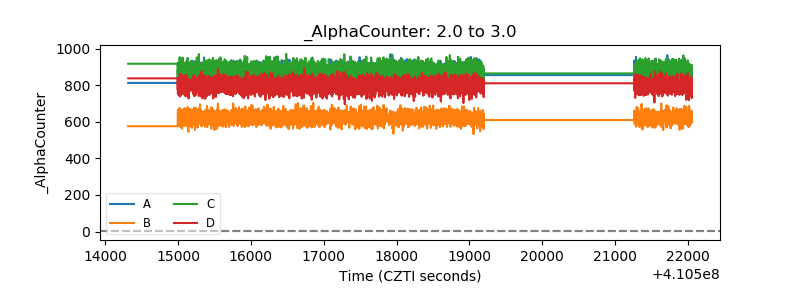 |
| _CPM_Rate |  |
| CZT Counter | 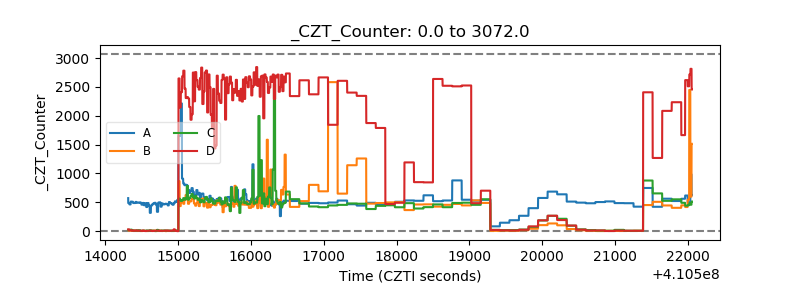 |
| +2.5 Volts monitor | 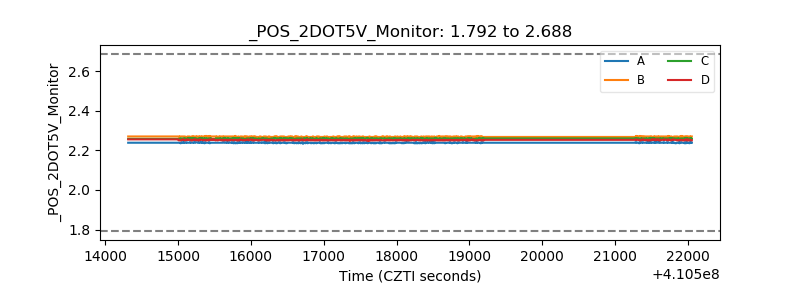 |
| +5 Volts monitor | 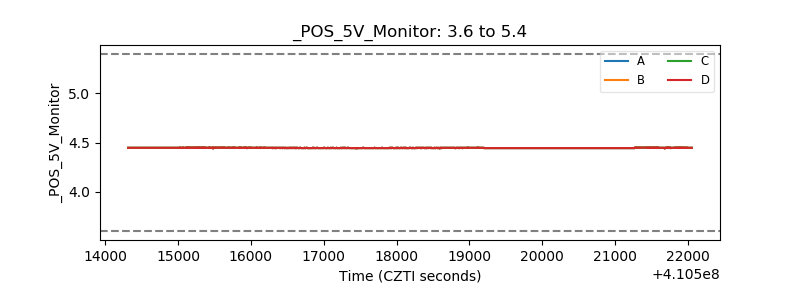 |
| _ROLL_ROT | 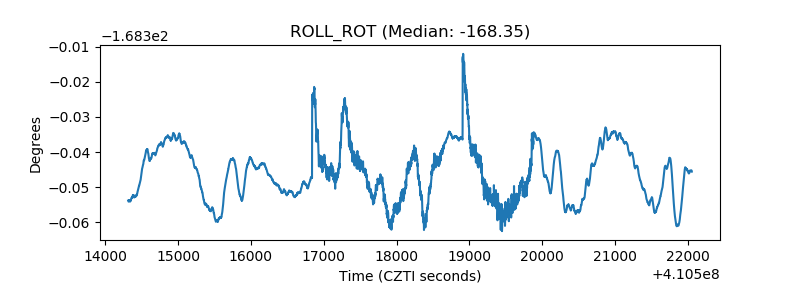 |
| _Roll_DEC | 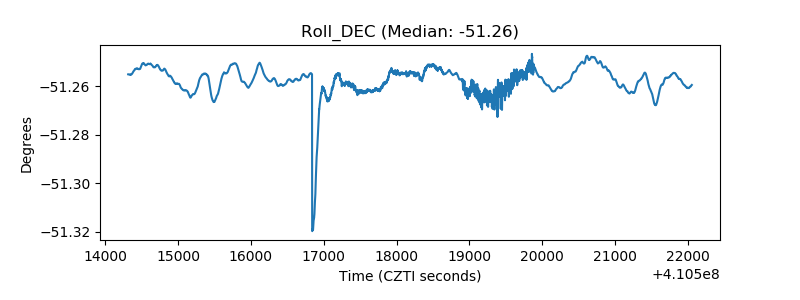 |
| _Roll_RA | 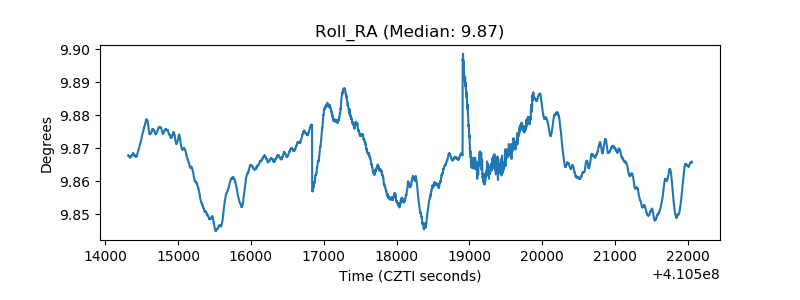 |
| Veto Counter | 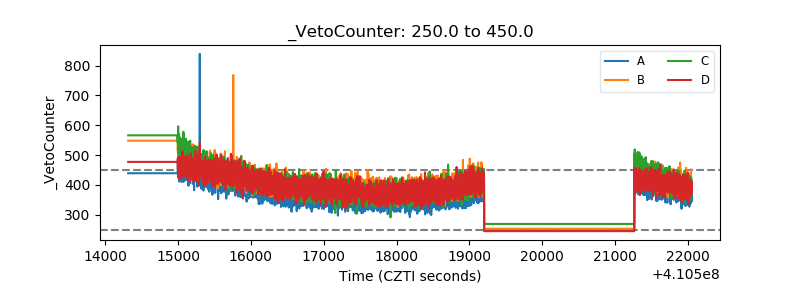 |