| Param | Original file | Final file |
|---|---|---|
| Filename | modeM0/AS1A12_044T04_9000005464_39305cztM0_level2.fits | modeM0/AS1A12_044T04_9000005464_39305cztM0_level2_quad_clean.evt |
| Size (bytes) | 588,539,520 | 75,522,240 |
| Size | 561.3 MB | 72.0 MB |
| Events in quadrant A | 2,981,035 | 605,594 |
| Events in quadrant B | 3,003,479 | 611,363 |
| Events in quadrant C | 2,641,369 | 590,637 |
| Events in quadrant D | 12,747,403 | 107,294 |
| Mode M0 | |||
|---|---|---|---|
| Quadrant | BADHDUFLAG | Total packets | Discarded packets |
| A | 0 | 12046 | 3 |
| B | 0 | 12402 | 2 |
| C | 0 | 11221 | 2 |
| D | 0 | 41544 | 2 |
| Mode SS | |||
|---|---|---|---|
| Quadrant | BADHDUFLAG | Total packets | Discarded packets |
| A | 0 | 110 | 0 |
| B | 0 | 110 | 0 |
| C | 0 | 110 | 0 |
| D | 0 | 110 | 0 |
| Mode M9 | |||
|---|---|---|---|
| Quadrant | BADHDUFLAG | Total packets | Discarded packets |
| A | 0 | 24 | 0 |
| B | 0 | 24 | 0 |
| C | 0 | 24 | 0 |
| D | 0 | 25 | 0 |
| Quadrant | Total seconds | Saturated seconds | Saturation percentage |
|---|---|---|---|
| A | 5299 | 25 | 0.471787% |
| B | 5299 | 97 | 1.830534% |
| C | 5299 | 20 | 0.377430% |
| D | 5299 | 4501 | 84.940555% |
Noise dominated data is calculated using 1-second bins in cleaned event files. If a bin has >2000 counts, and if more than 50% of those come from <1% of pixels, then it is considered to be noise-dominated and hence unusable.
| Quadrant | # 1 sec bins | Bins with >0 counts | Bins with >2000 counts | High rate bins dominated by noise | Noise dominated (total time) | Noise dominated (detector-on time) | Marked lightcurve |
|---|---|---|---|---|---|---|---|
| A | 7061 | 5300 | 16 | 16 | 0.23% | 0.30% | 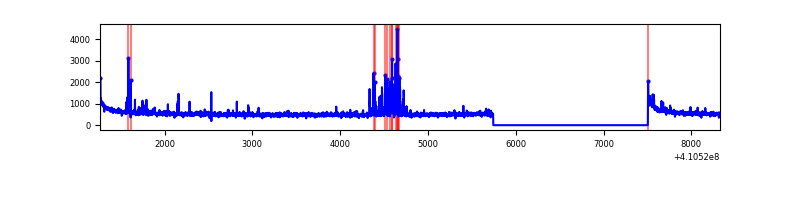 |
| B | 7061 | 5300 | 77 | 77 | 1.09% | 1.45% | 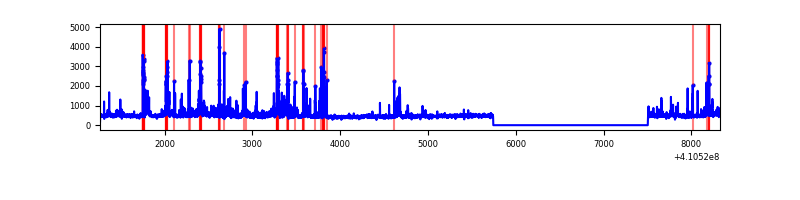 |
| C | 7061 | 5300 | 13 | 13 | 0.18% | 0.25% | 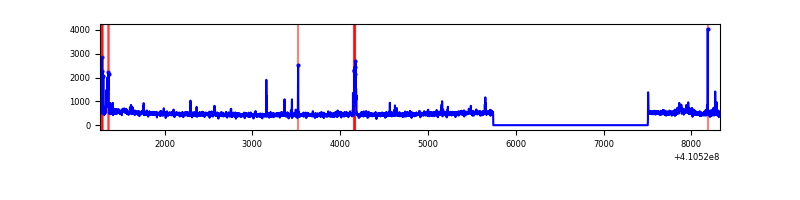 |
| D | 7061 | 5300 | 3757 | 3757 | 53.21% | 70.89% | 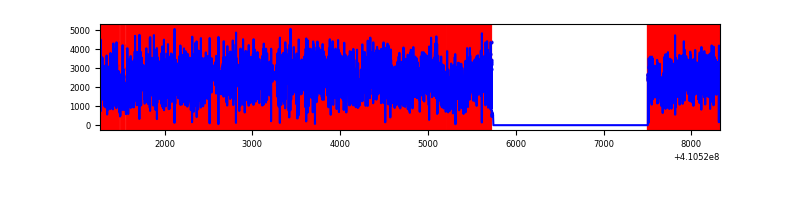 |
Top three noisy pixels from each quadrant. If the there are fewer than three noisy pixels in the level2.evt file, extra rows are filled as -1
| Pixel properties | Quadrant properties | ||||||
|---|---|---|---|---|---|---|---|
| Quadrant | DetID | PixID | Counts | Sigma | Mean | Median | Sigma |
| A | 10 | 83 | 474886 | 3970.8 | 589 | 578 | 119.4 |
| A | 13 | 248 | 175634 | 1465.53 | 589 | 578 | 119.4 |
| A | 12 | 189 | 29322 | 240.64 | 589 | 578 | 119.4 |
| B | 0 | 229 | 204000 | 1821.33 | 581 | 568 | 111.7 |
| B | 5 | 255 | 196382 | 1753.12 | 581 | 568 | 111.7 |
| B | 0 | 186 | 105312 | 937.77 | 581 | 568 | 111.7 |
| C | 15 | 214 | 241270 | 1827.73 | 566 | 571 | 131.7 |
| C | 9 | 187 | 102658 | 775.19 | 566 | 571 | 131.7 |
| C | 14 | 254 | 44223 | 331.47 | 566 | 571 | 131.7 |
| D | 12 | 235 | 11086318 | 141763.41 | 315 | 305 | 78.2 |
| D | 13 | 249 | 121146 | 1545.27 | 315 | 305 | 78.2 |
| D | 5 | 222 | 85788 | 1093.12 | 315 | 305 | 78.2 |
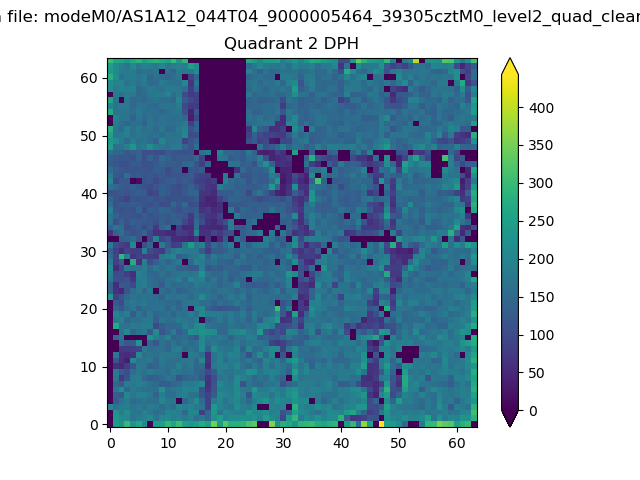
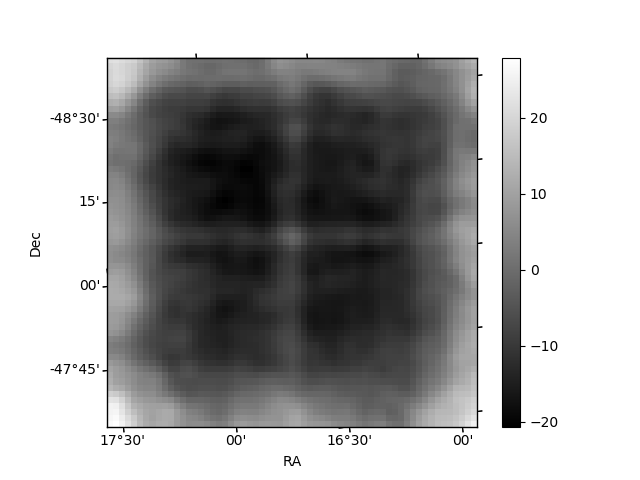
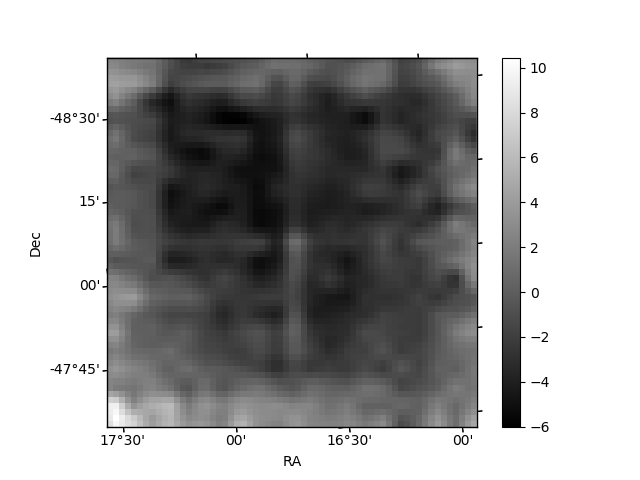
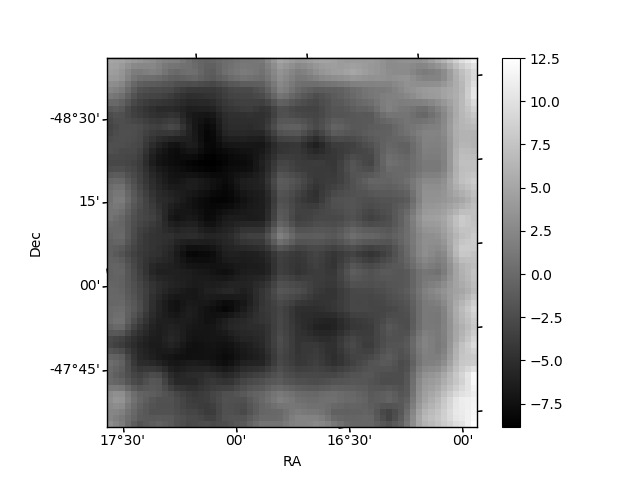
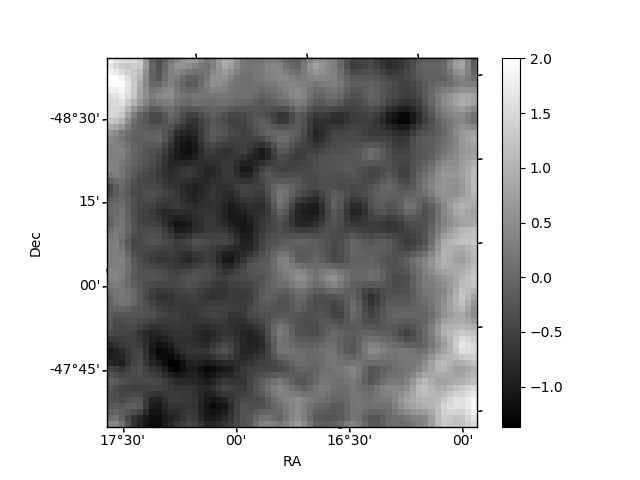
Histogram calculated using DETX and DETY for each event in the final _common_clean file
| Quadrant A | 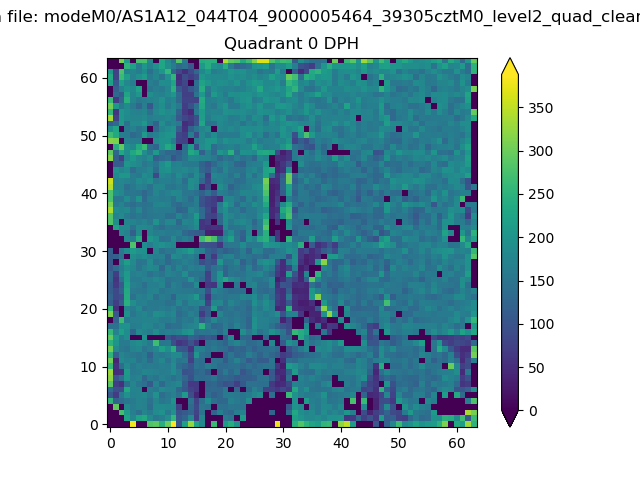 |
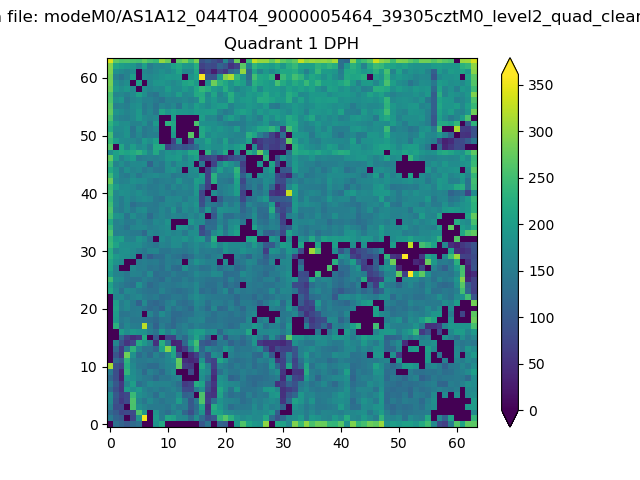 |
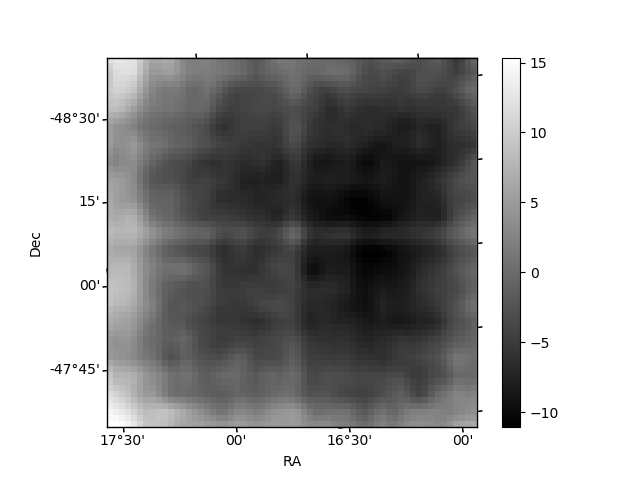
Quadrant B |
|---|---|---|---|
| Quadrant D | 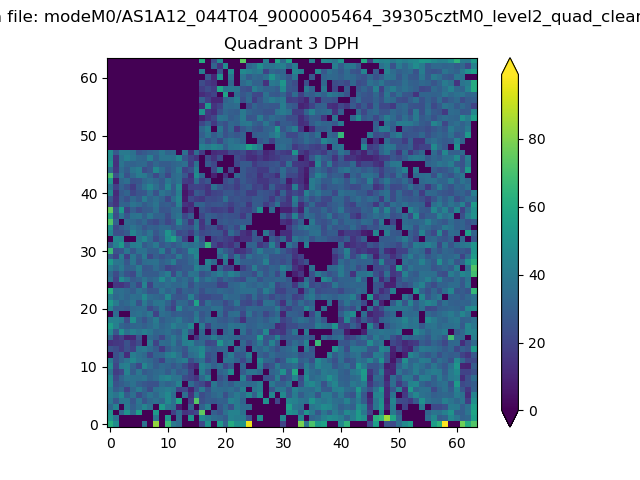 |
 |
Quadrant C |
| Plot type | Count rate plots | Images |
|---|---|---|
| Comparison with Poisson distribution Blue bars denote a histogram of data divided into 1 sec bins. Red curve is a Poisson curve with rate = median count rate of data. |
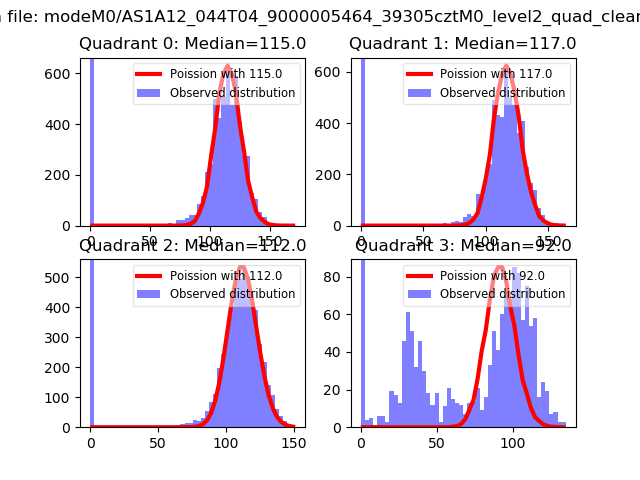 |
 |
| Quadrant-wise count rates Data is divided into 100 sec bins |
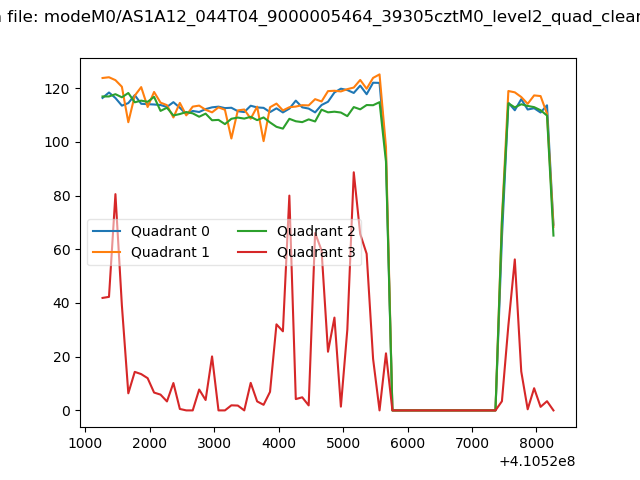 |
|
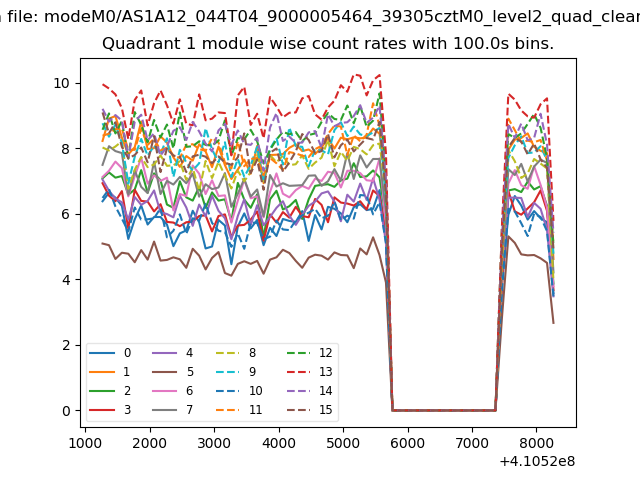
| Module-wise count rates for Quadrant A Data is divided into 100 sec bins |
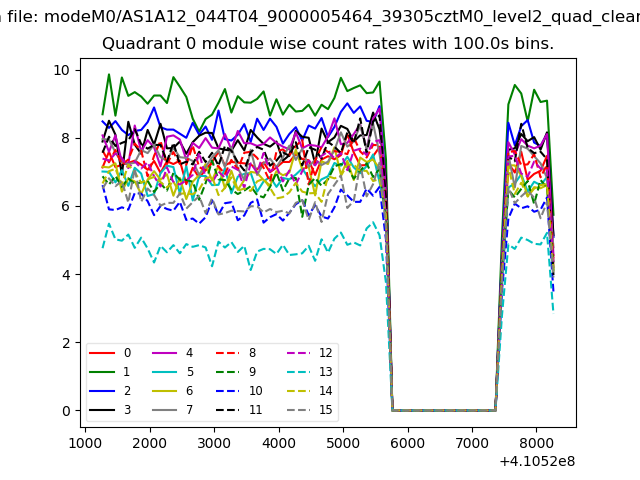 |
 |
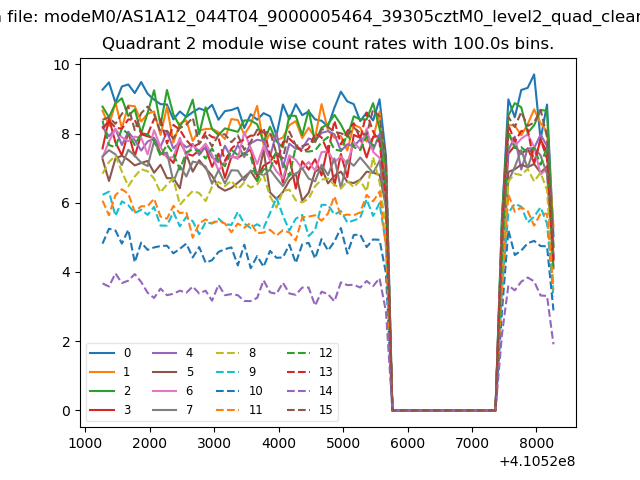
| Module-wise count rates for Quadrant B Data is divided into 100 sec bins |
 |
 |
| Module-wise count rates for Quadrant C Data is divided into 100 sec bins |
 |
 |
| Module-wise count rates for Quadrant D Data is divided into 100 sec bins |
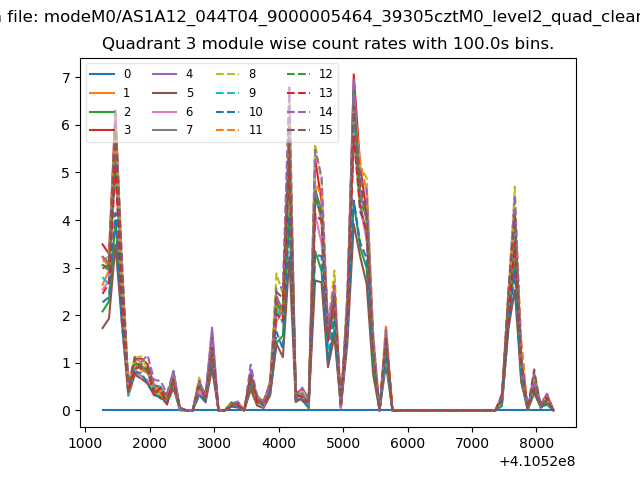 |
 |
| Parameter | Plot |
|---|---|
| CZT HV Monitor | 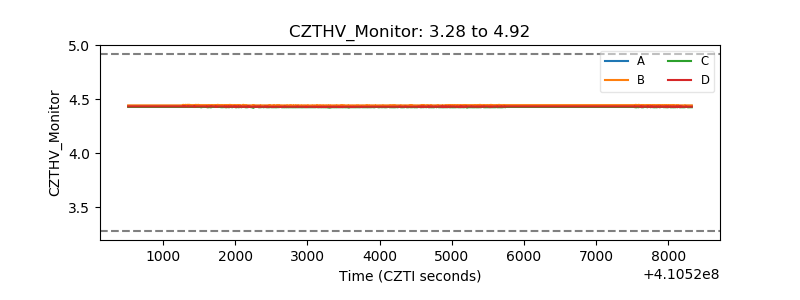 |
| D_VDD | 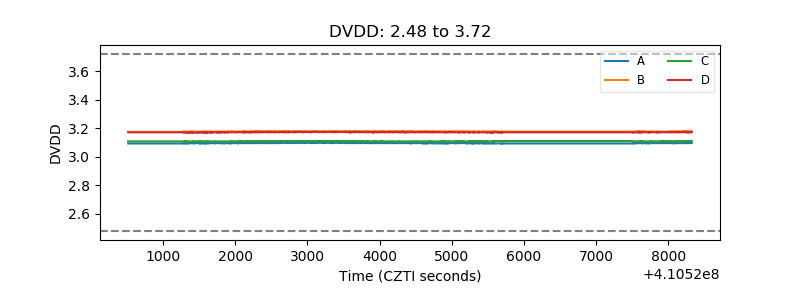 |
| Temperature 1 | 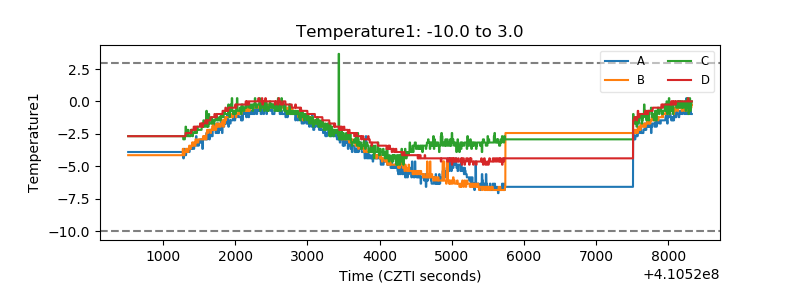 |
| Veto HV Monitor |  |
| Veto LLD | 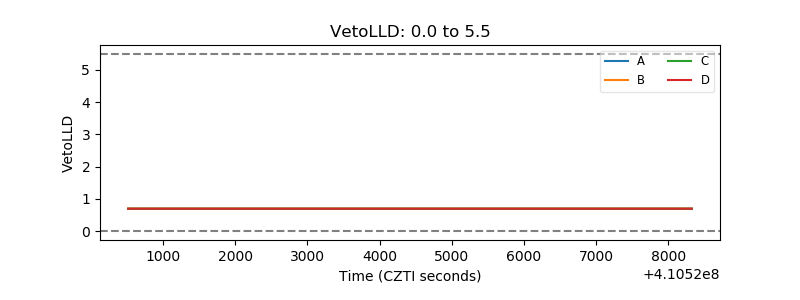 |
| Alpha Counter | 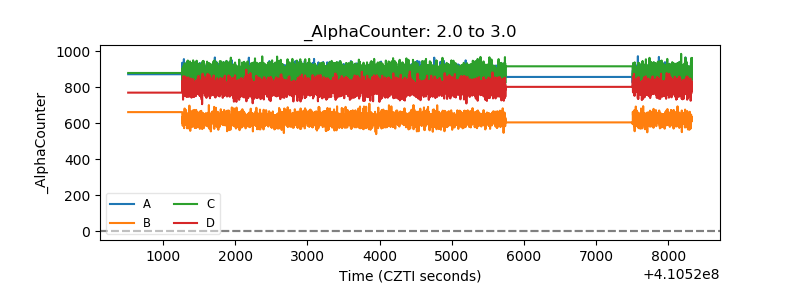 |
| _CPM_Rate | 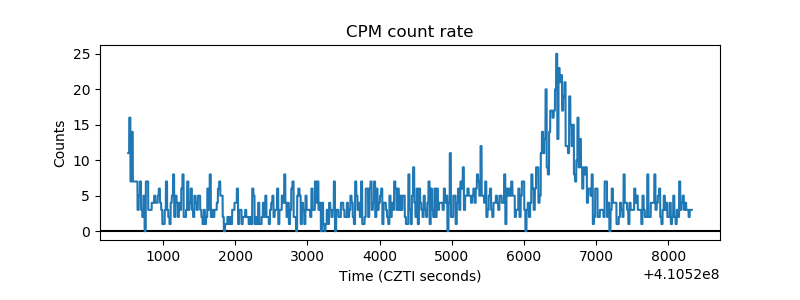 |
| CZT Counter | 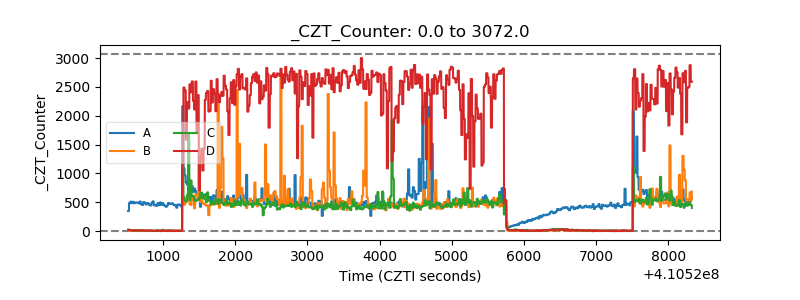 |
| +2.5 Volts monitor | 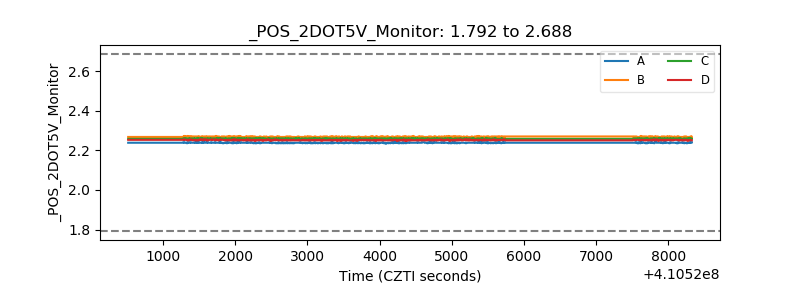 |
| +5 Volts monitor | 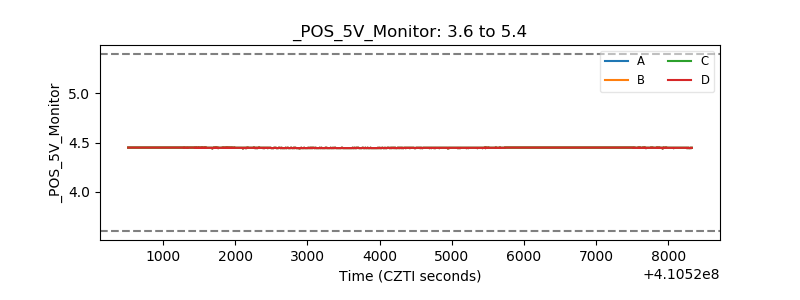 |
| _ROLL_ROT | 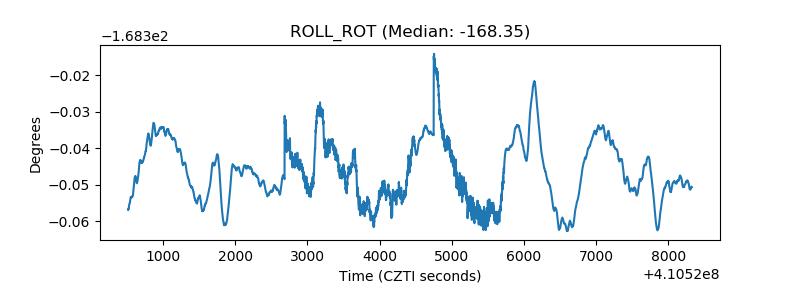 |
| _Roll_DEC | 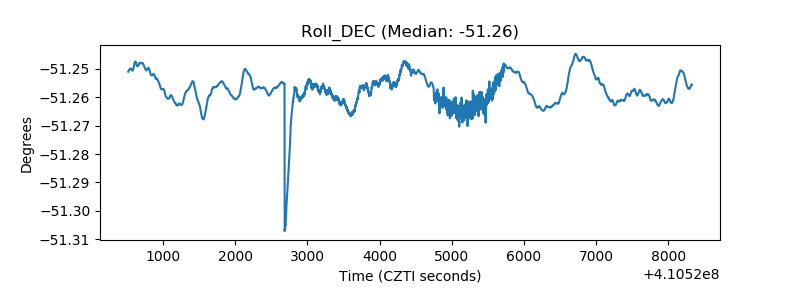 |
| _Roll_RA | 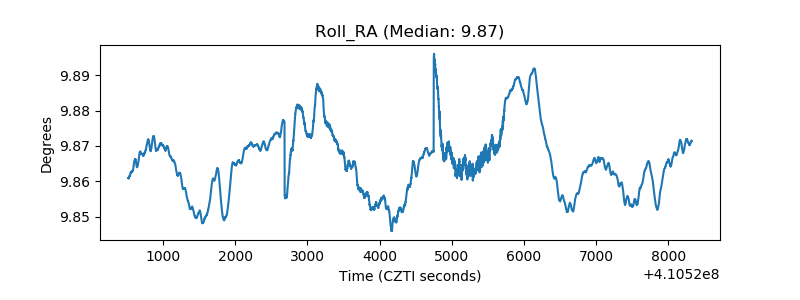 |
| Veto Counter | 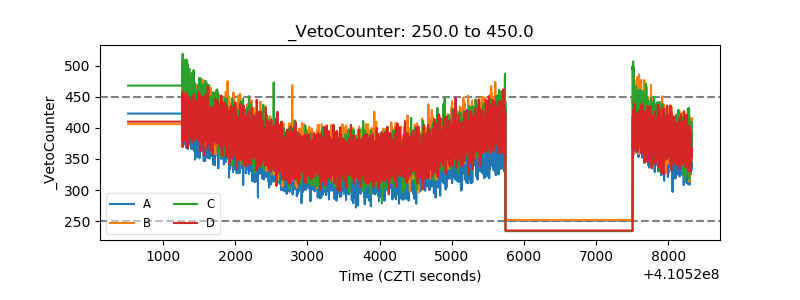 |