| Param | Original file | Final file |
|---|---|---|
| Filename | modeM0/AS1A12_044T04_9000005464_39306cztM0_level2.fits | modeM0/AS1A12_044T04_9000005464_39306cztM0_level2_quad_clean.evt |
| Size (bytes) | 315,858,240 | 39,994,560 |
| Size | 301.2 MB | 38.1 MB |
| Events in quadrant A | 1,530,000 | 322,677 |
| Events in quadrant B | 1,463,171 | 325,724 |
| Events in quadrant C | 1,331,782 | 313,431 |
| Events in quadrant D | 7,137,377 | 40,642 |
| Mode M0 | |||
|---|---|---|---|
| Quadrant | BADHDUFLAG | Total packets | Discarded packets |
| A | 0 | 6340 | 0 |
| B | 0 | 6453 | 0 |
| C | 0 | 6020 | 0 |
| D | 0 | 23261 | 0 |
| Mode SS | |||
|---|---|---|---|
| Quadrant | BADHDUFLAG | Total packets | Discarded packets |
| A | 0 | 58 | 0 |
| B | 0 | 58 | 0 |
| C | 0 | 58 | 0 |
| D | 0 | 58 | 0 |
| Quadrant | Total seconds | Saturated seconds | Saturation percentage |
|---|---|---|---|
| A | 2924 | 8 | 0.273598% |
| B | 2924 | 21 | 0.718194% |
| C | 2924 | 2 | 0.068399% |
| D | 2924 | 2548 | 87.140903% |
Noise dominated data is calculated using 1-second bins in cleaned event files. If a bin has >2000 counts, and if more than 50% of those come from <1% of pixels, then it is considered to be noise-dominated and hence unusable.
| Quadrant | # 1 sec bins | Bins with >0 counts | Bins with >2000 counts | High rate bins dominated by noise | Noise dominated (total time) | Noise dominated (detector-on time) | Marked lightcurve |
|---|---|---|---|---|---|---|---|
| A | 2924 | 2924 | 9 | 9 | 0.31% | 0.31% | 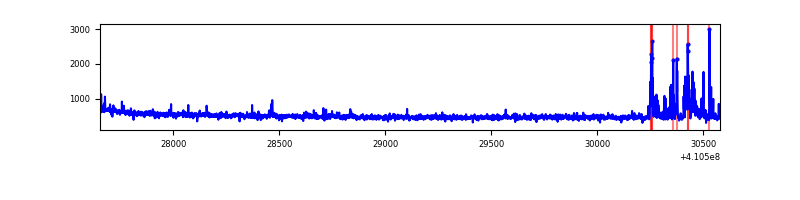 |
| B | 2924 | 2924 | 16 | 16 | 0.55% | 0.55% | 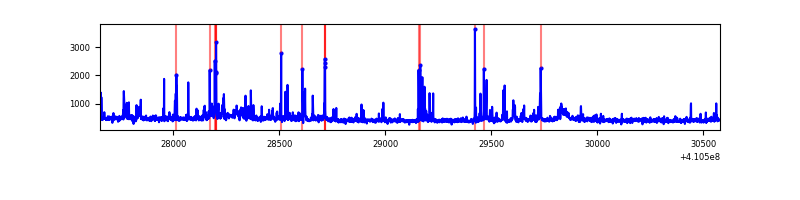 |
| C | 2924 | 2924 | 1 | 1 | 0.03% | 0.03% | 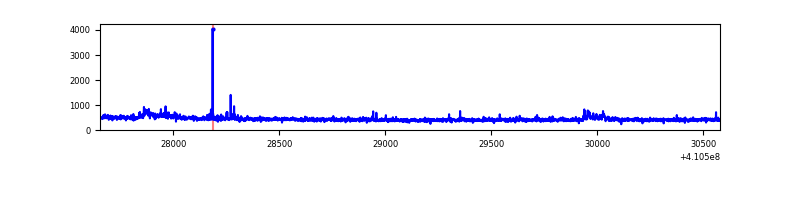 |
| D | 2924 | 2924 | 2148 | 2148 | 73.46% | 73.46% | 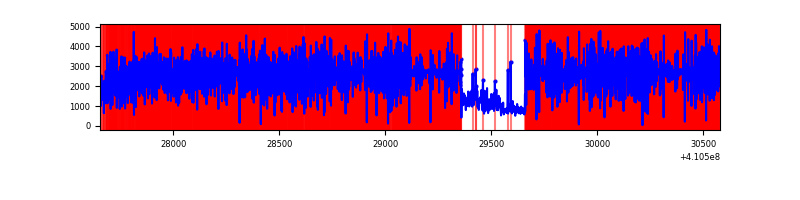 |
Top three noisy pixels from each quadrant. If the there are fewer than three noisy pixels in the level2.evt file, extra rows are filled as -1
| Pixel properties | Quadrant properties | ||||||
|---|---|---|---|---|---|---|---|
| Quadrant | DetID | PixID | Counts | Sigma | Mean | Median | Sigma |
| A | 10 | 83 | 218403 | 3385.43 | 309 | 303 | 64.4 |
| A | 13 | 248 | 108527 | 1679.89 | 309 | 303 | 64.4 |
| A | 2 | 79 | 7403 | 110.21 | 309 | 303 | 64.4 |
| B | 0 | 183 | 103328 | 1715.37 | 306 | 298 | 60.1 |
| B | 0 | 186 | 55495 | 918.99 | 306 | 298 | 60.1 |
| B | 5 | 255 | 44415 | 734.52 | 306 | 298 | 60.1 |
| C | 15 | 214 | 131463 | 1912.21 | 292 | 294 | 68.6 |
| C | 3 | 233 | 39391 | 569.96 | 292 | 294 | 68.6 |
| C | 14 | 254 | 18996 | 272.64 | 292 | 294 | 68.6 |
| D | 12 | 235 | 6414957 | 182130.25 | 136 | 132 | 35.2 |
| D | 12 | 218 | 48759 | 1380.62 | 136 | 132 | 35.2 |
| D | 2 | 249 | 44831 | 1269.1 | 136 | 132 | 35.2 |
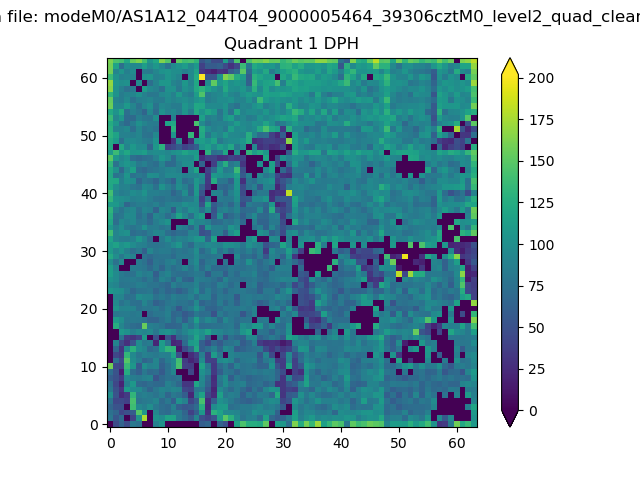
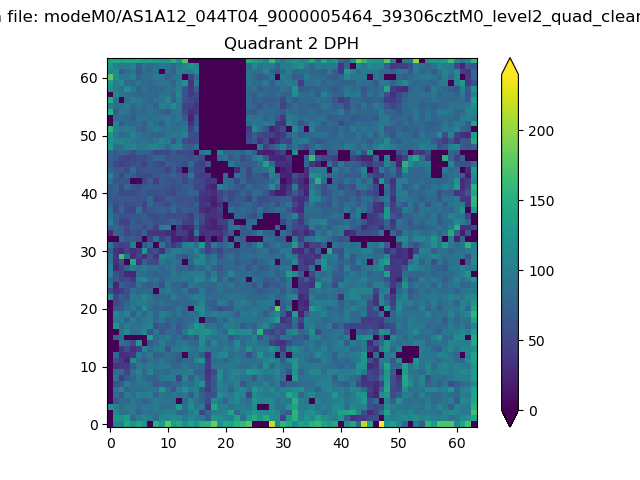
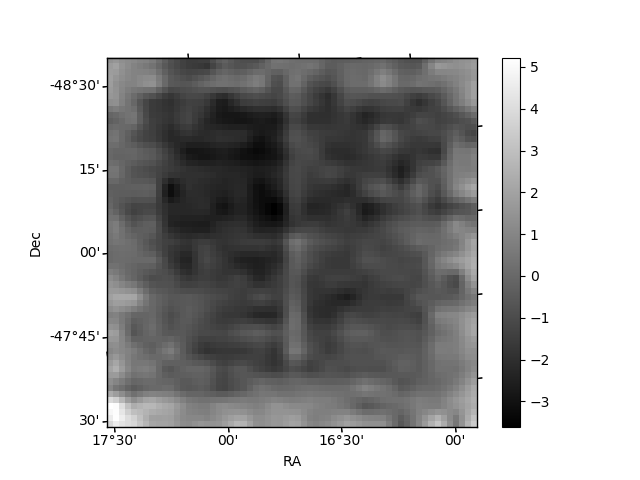
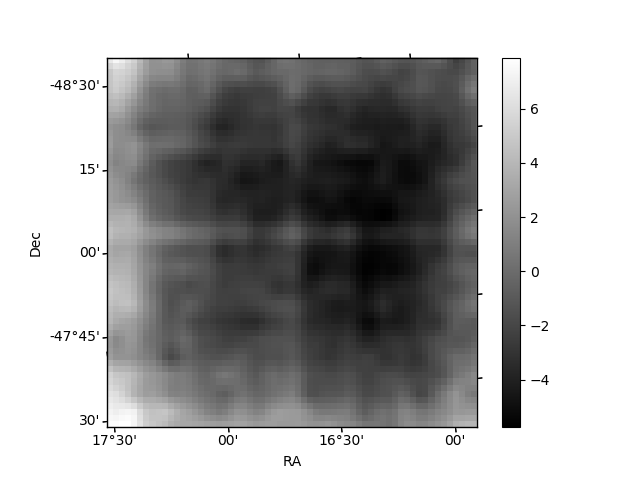
Histogram calculated using DETX and DETY for each event in the final _common_clean file
| Quadrant A |  |
 |
Quadrant B |
|---|---|---|---|
| Quadrant D |  |
 |
Quadrant C |
| Plot type | Count rate plots | Images |
|---|---|---|
| Comparison with Poisson distribution Blue bars denote a histogram of data divided into 1 sec bins. Red curve is a Poisson curve with rate = median count rate of data. |
 |
 |
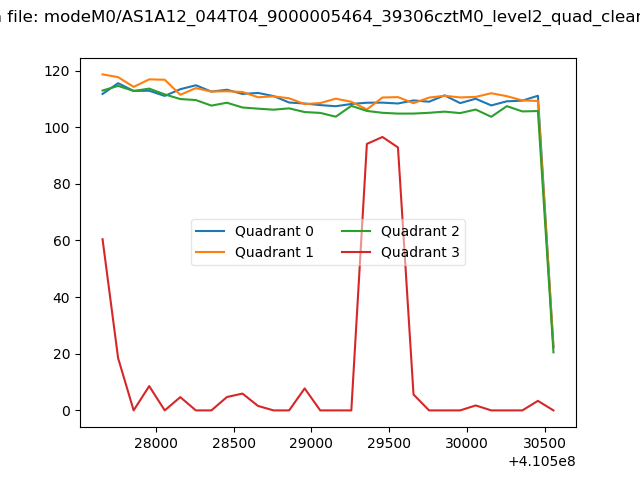
| Quadrant-wise count rates Data is divided into 100 sec bins |
 |
|
| Module-wise count rates for Quadrant A Data is divided into 100 sec bins |
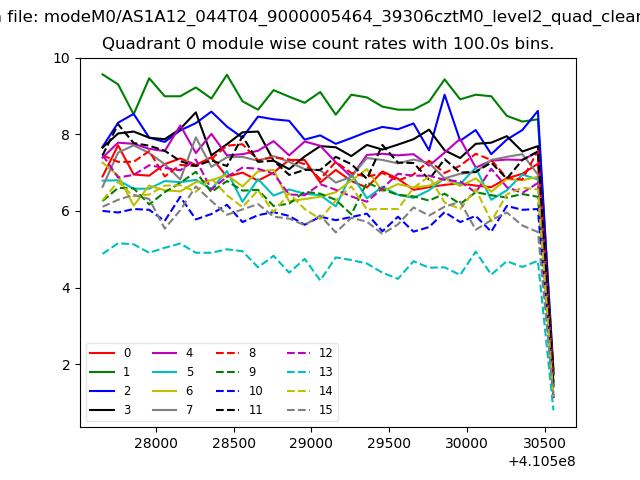 |
 |
| Module-wise count rates for Quadrant B Data is divided into 100 sec bins |
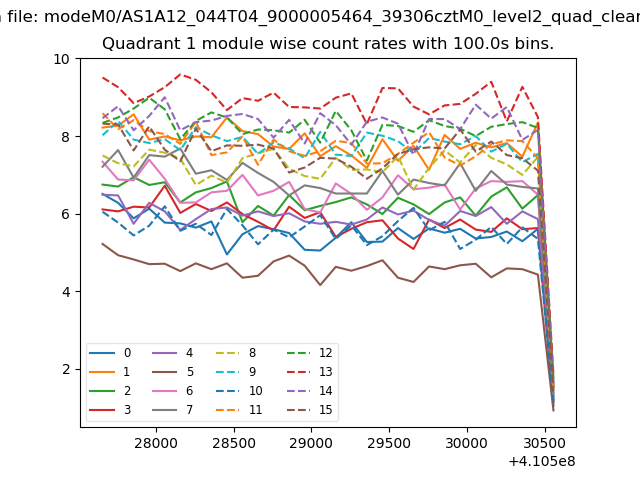 |
 |
| Module-wise count rates for Quadrant C Data is divided into 100 sec bins |
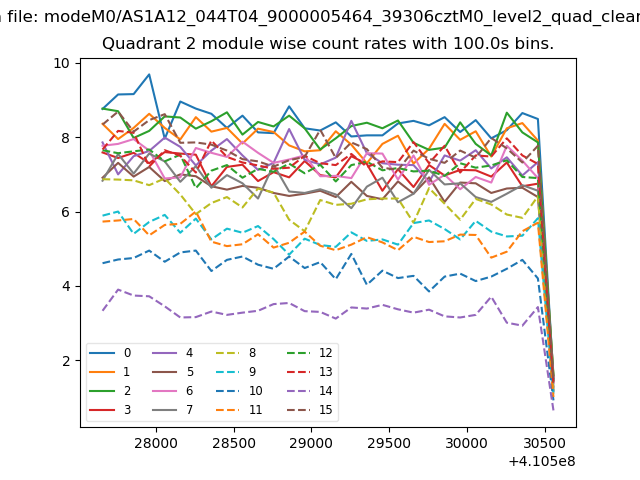 |
 |
| Module-wise count rates for Quadrant D Data is divided into 100 sec bins |
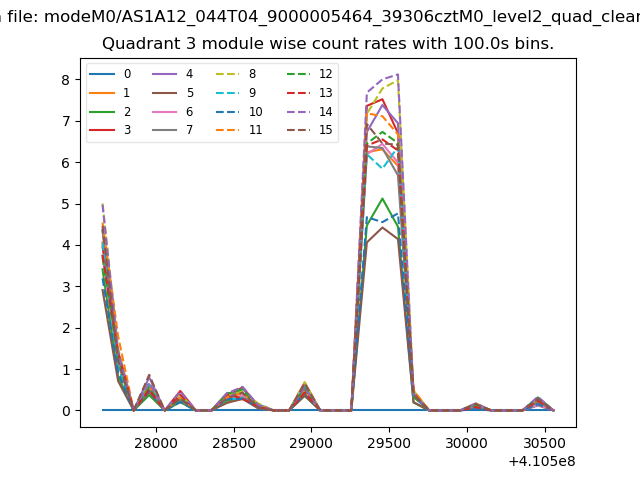 |
 |
| Parameter | Plot |
|---|---|
| CZT HV Monitor | 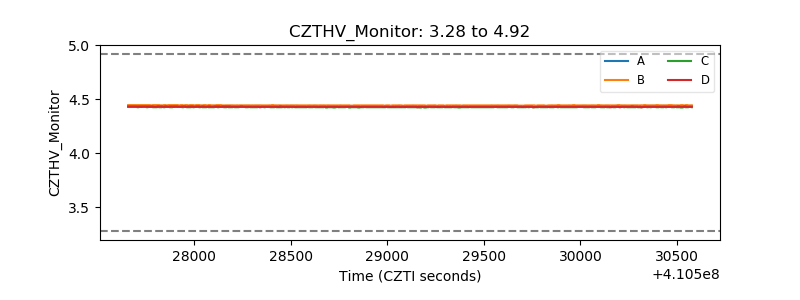 |
| D_VDD | 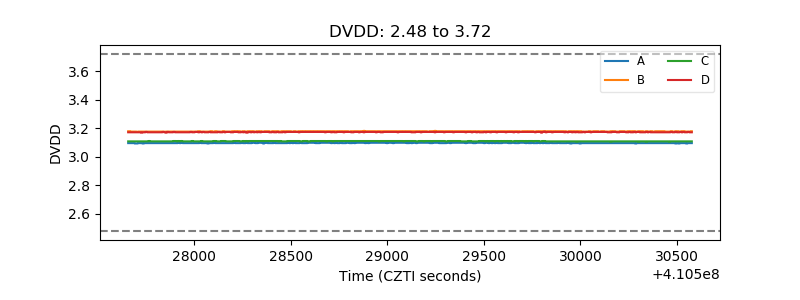 |
| Temperature 1 | 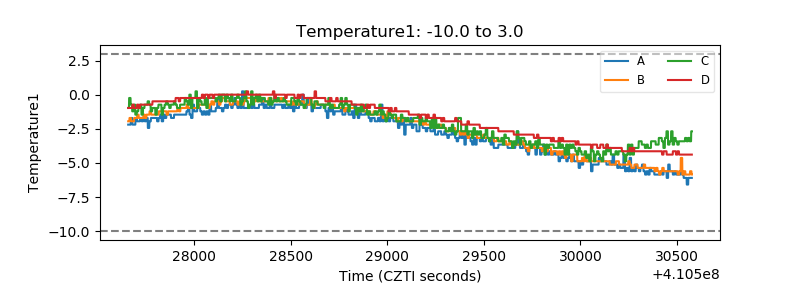 |
| Veto HV Monitor | 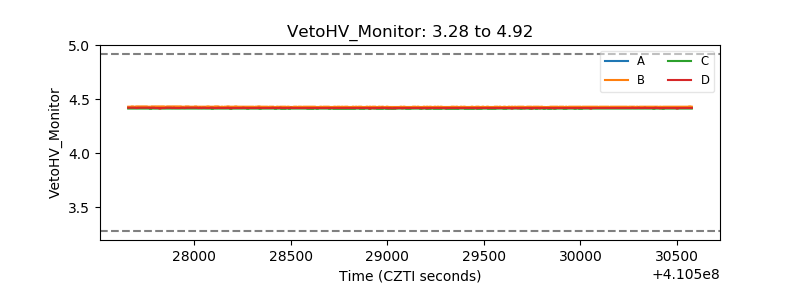 |
| Veto LLD | 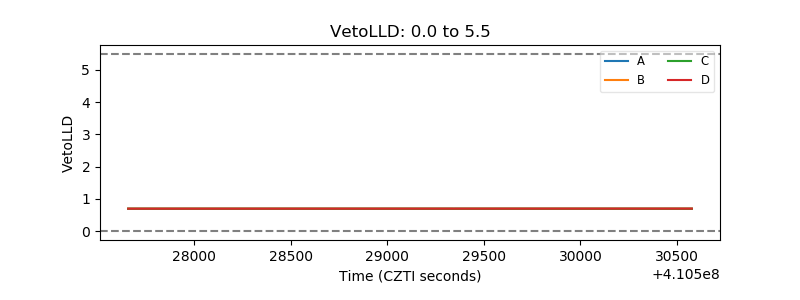 |
| Alpha Counter |  |
| _CPM_Rate |  |
| CZT Counter | 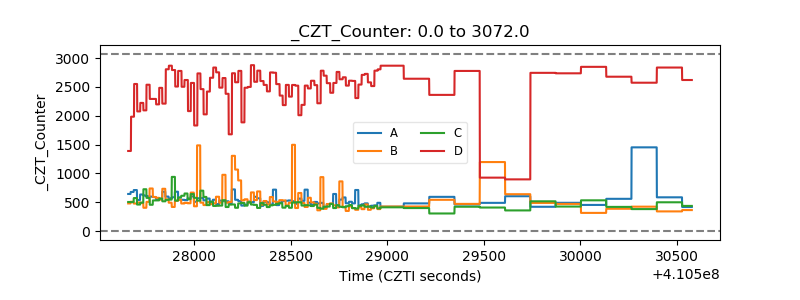 |
| +2.5 Volts monitor | 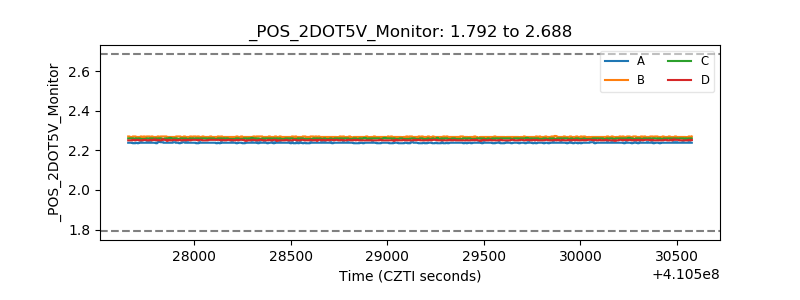 |
| +5 Volts monitor | 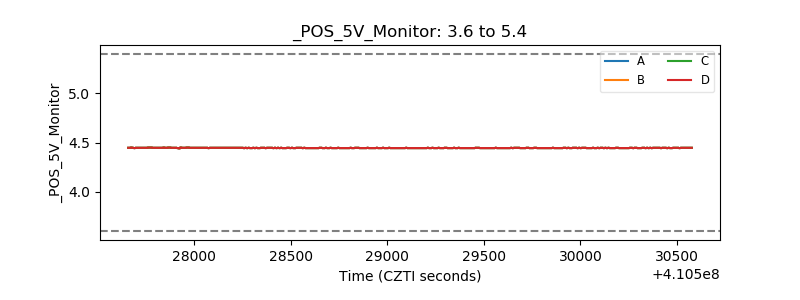 |
| _ROLL_ROT | 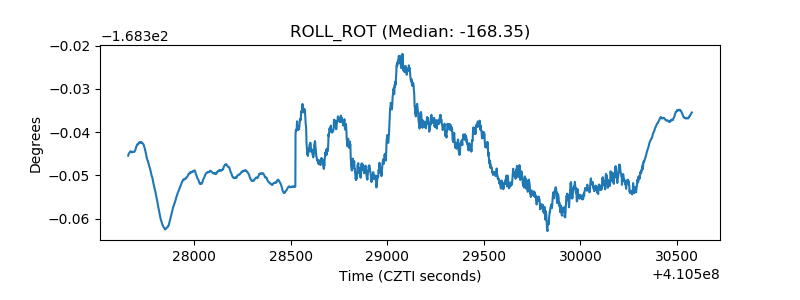 |
| _Roll_DEC | 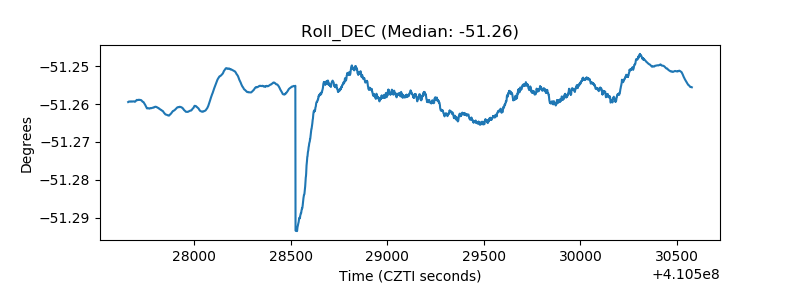 |
| _Roll_RA | 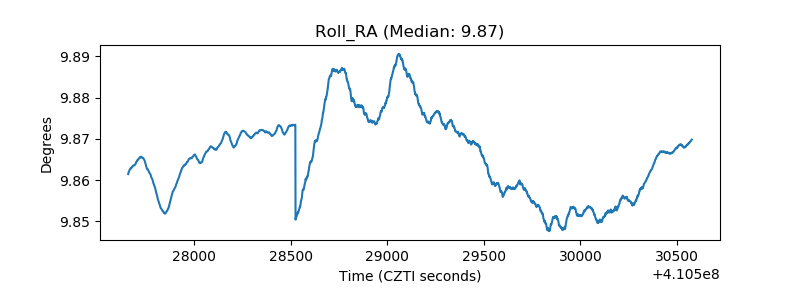 |
| Veto Counter | 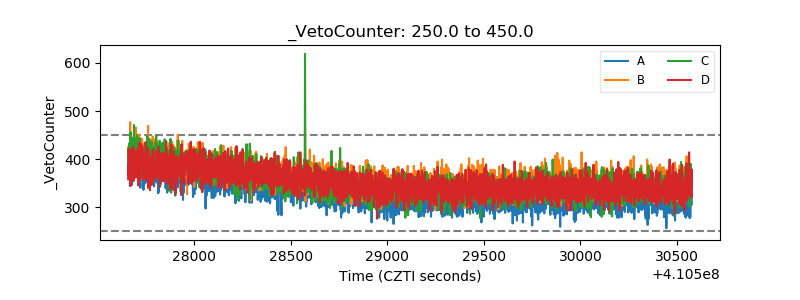 |