| Param | Original file | Final file |
|---|---|---|
| Filename | modeM0/AS1A12_102T01_9000005466_39306cztM0_level2.fits | modeM0/AS1A12_102T01_9000005466_39306cztM0_level2_quad_clean.evt |
| Size (bytes) | 146,188,800 | 18,576,000 |
| Size | 139.4 MB | 17.7 MB |
| Events in quadrant A | 771,076 | 150,353 |
| Events in quadrant B | 658,579 | 151,759 |
| Events in quadrant C | 625,965 | 144,539 |
| Events in quadrant D | 3,250,642 | 17,252 |
| Mode M9 | |||
|---|---|---|---|
| Quadrant | BADHDUFLAG | Total packets | Discarded packets |
| A | 0 | 14 | 0 |
| B | 0 | 14 | 0 |
| C | 0 | 14 | 0 |
| D | 0 | 14 | 0 |
| Mode M0 | |||
|---|---|---|---|
| Quadrant | BADHDUFLAG | Total packets | Discarded packets |
| A | 0 | 3046 | 2 |
| B | 0 | 2801 | 1 |
| C | 0 | 2647 | 1 |
| D | 0 | 10563 | 1 |
| Mode SS | |||
|---|---|---|---|
| Quadrant | BADHDUFLAG | Total packets | Discarded packets |
| A | 0 | 30 | 0 |
| B | 0 | 30 | 0 |
| C | 0 | 30 | 0 |
| D | 0 | 30 | 0 |
| Quadrant | Total seconds | Saturated seconds | Saturation percentage |
|---|---|---|---|
| A | 1313 | 8 | 0.609292% |
| B | 1313 | 10 | 0.761615% |
| C | 1313 | 1 | 0.076161% |
| D | 1313 | 1184 | 90.175171% |
Noise dominated data is calculated using 1-second bins in cleaned event files. If a bin has >2000 counts, and if more than 50% of those come from <1% of pixels, then it is considered to be noise-dominated and hence unusable.
| Quadrant | # 1 sec bins | Bins with >0 counts | Bins with >2000 counts | High rate bins dominated by noise | Noise dominated (total time) | Noise dominated (detector-on time) | Marked lightcurve |
|---|---|---|---|---|---|---|---|
| A | 2746 | 1314 | 3 | 3 | 0.11% | 0.23% | 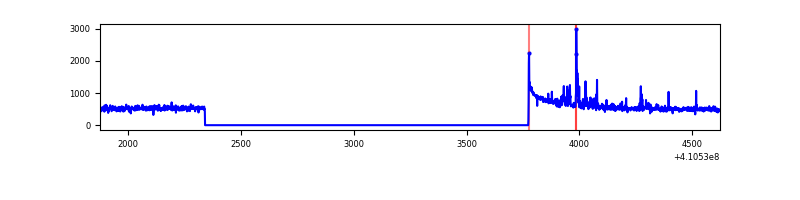 |
| B | 2746 | 1314 | 6 | 6 | 0.22% | 0.46% | 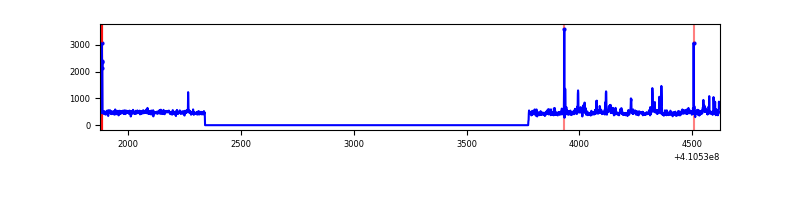 |
| C | 2746 | 1314 | 0 | 0 | 0.00% | 0.00% | 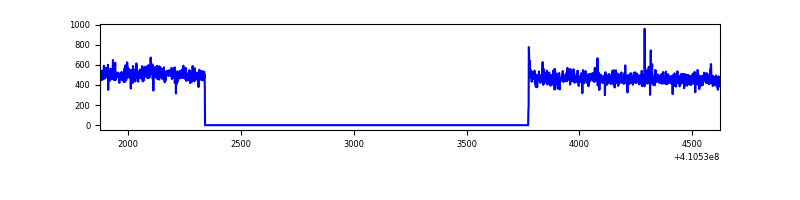 |
| D | 2745 | 1313 | 979 | 979 | 35.66% | 74.56% | 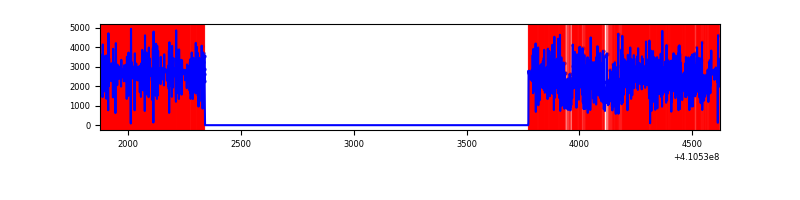 |
Top three noisy pixels from each quadrant. If the there are fewer than three noisy pixels in the level2.evt file, extra rows are filled as -1
| Pixel properties | Quadrant properties | ||||||
|---|---|---|---|---|---|---|---|
| Quadrant | DetID | PixID | Counts | Sigma | Mean | Median | Sigma |
| A | 10 | 83 | 148844 | 4577.64 | 150 | 147 | 32.5 |
| A | 13 | 248 | 39657 | 1216.32 | 150 | 147 | 32.5 |
| A | 10 | 67 | 1737 | 48.95 | 150 | 147 | 32.5 |
| B | 0 | 183 | 32860 | 1079.3 | 146 | 142 | 30.3 |
| B | 15 | 35 | 18152 | 594.11 | 146 | 142 | 30.3 |
| B | 5 | 184 | 11799 | 384.54 | 146 | 142 | 30.3 |
| C | 15 | 214 | 62279 | 1790.36 | 142 | 143 | 34.7 |
| C | 14 | 254 | 2949 | 80.85 | 142 | 143 | 34.7 |
| C | 4 | 0 | 1121 | 28.18 | 142 | 143 | 34.7 |
| D | 12 | 235 | 2971385 | 168214.92 | 65 | 63 | 17.7 |
| D | 5 | 222 | 12600 | 709.75 | 65 | 63 | 17.7 |
| D | 12 | 233 | 3499 | 194.52 | 65 | 63 | 17.7 |
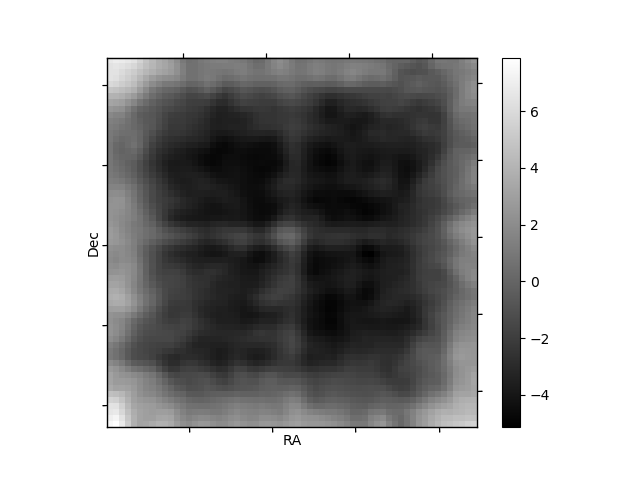
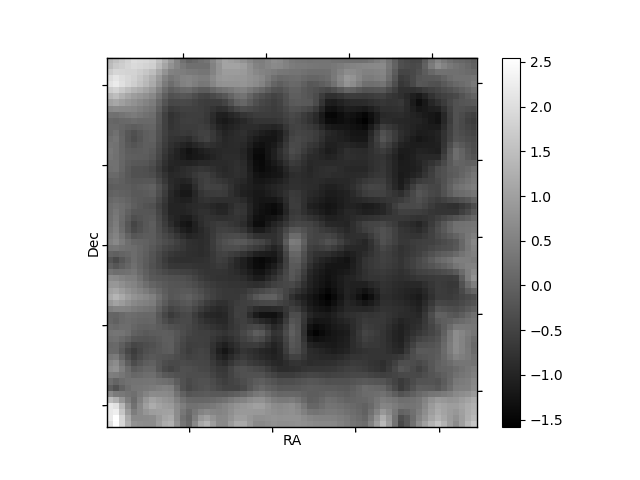
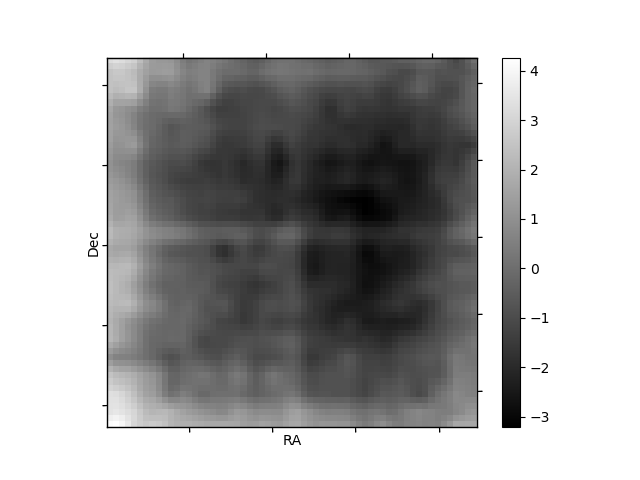
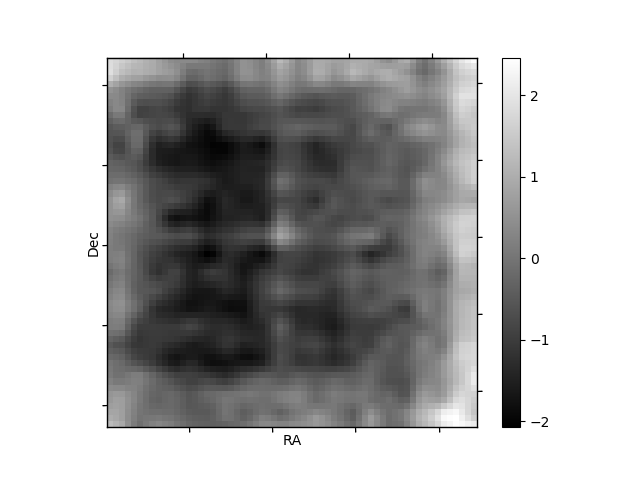
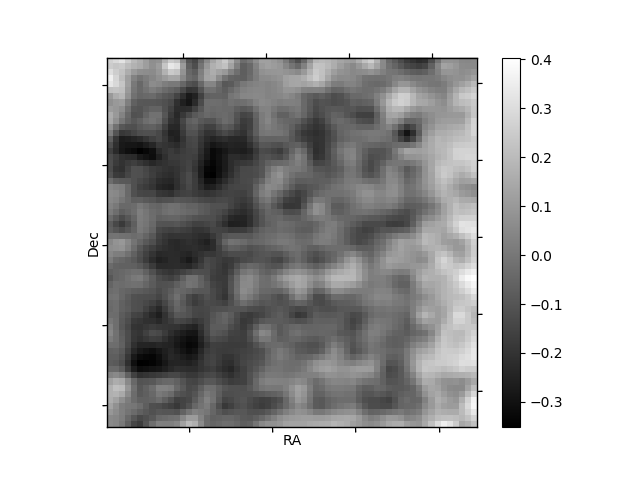
Histogram calculated using DETX and DETY for each event in the final _common_clean file
| Quadrant A | 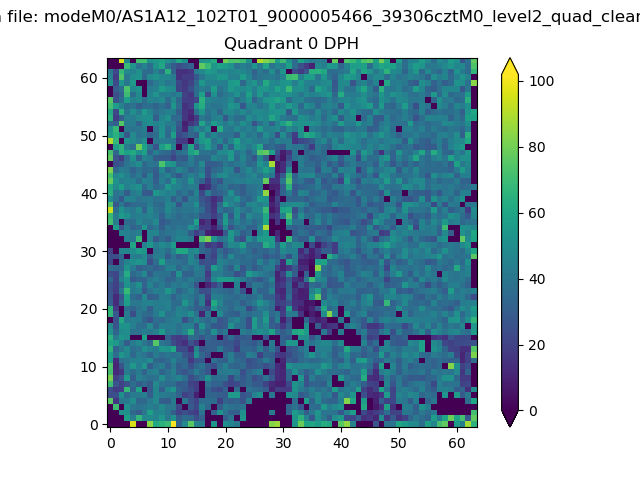 |
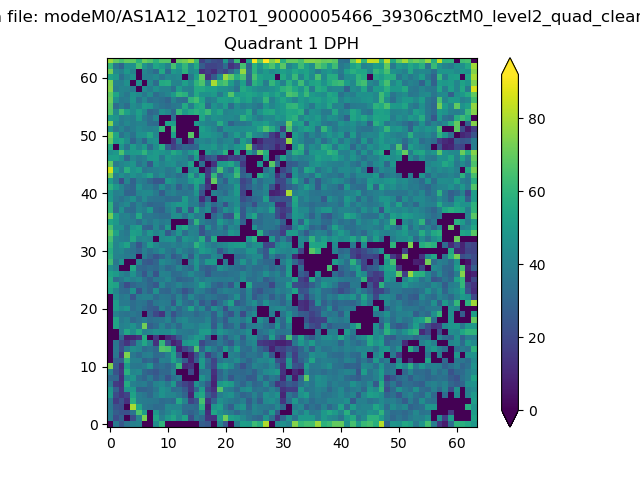 |
Quadrant B |
|---|---|---|---|
| Quadrant D | 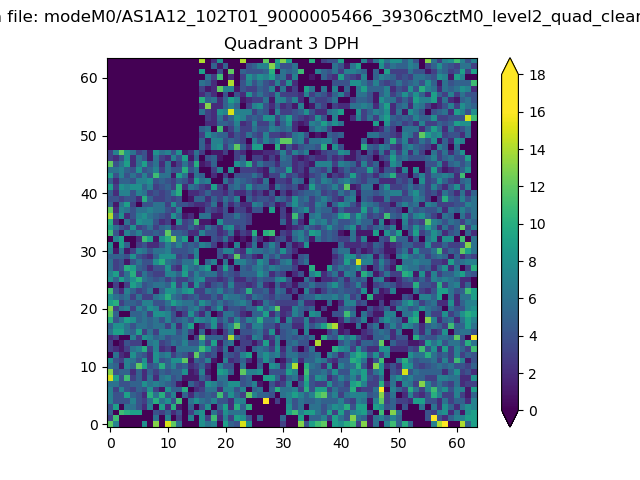 |
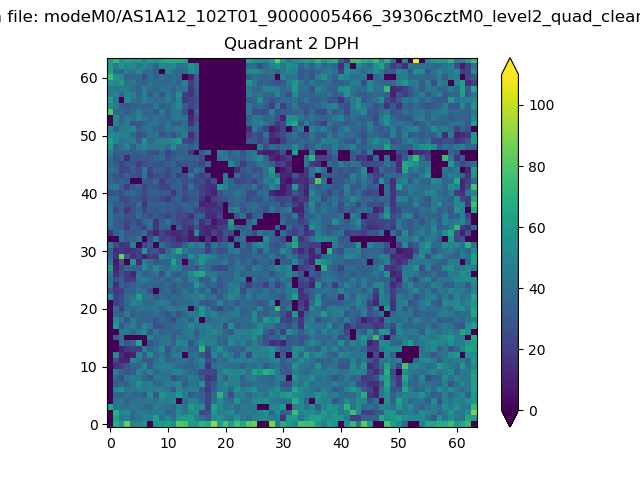 |
Quadrant C |
| Plot type | Count rate plots | Images |
|---|---|---|
| Comparison with Poisson distribution Blue bars denote a histogram of data divided into 1 sec bins. Red curve is a Poisson curve with rate = median count rate of data. |
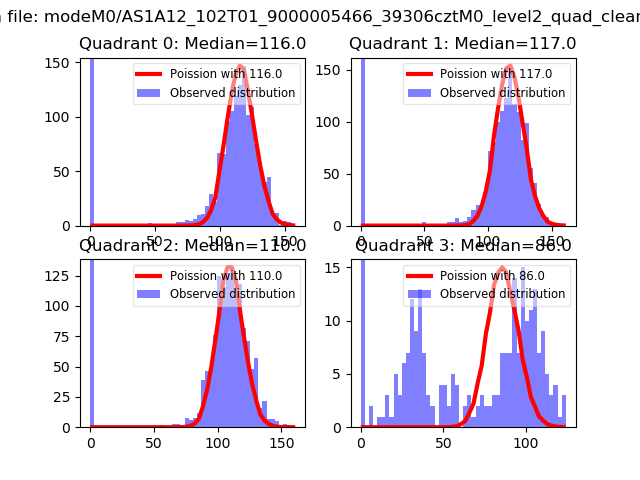 |
 |
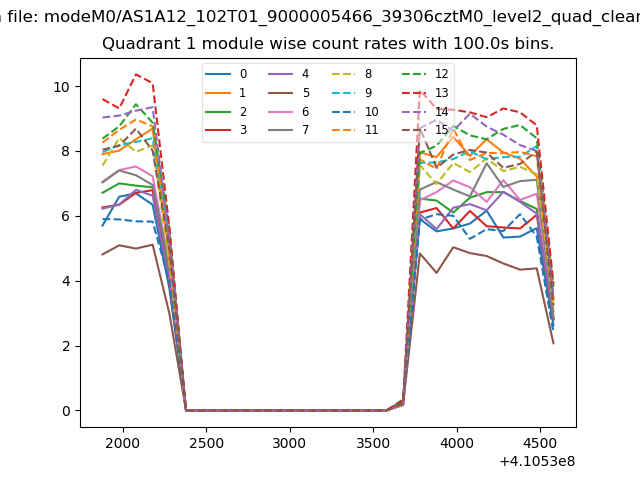
| Quadrant-wise count rates Data is divided into 100 sec bins |
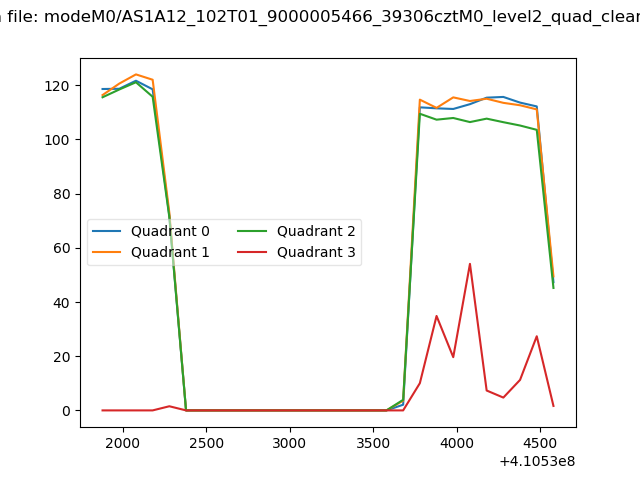 |
|
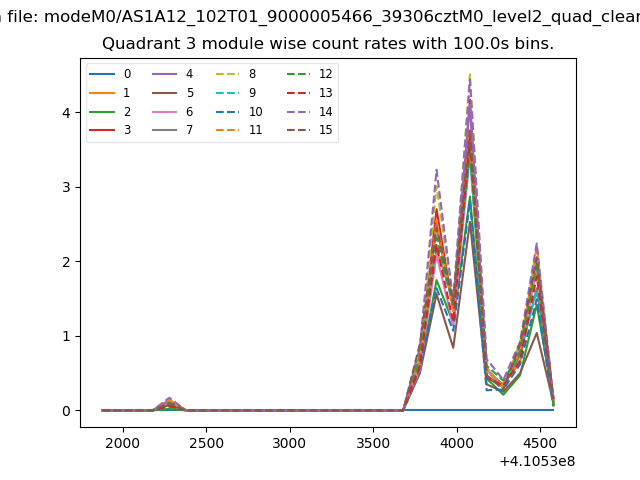
| Module-wise count rates for Quadrant A Data is divided into 100 sec bins |
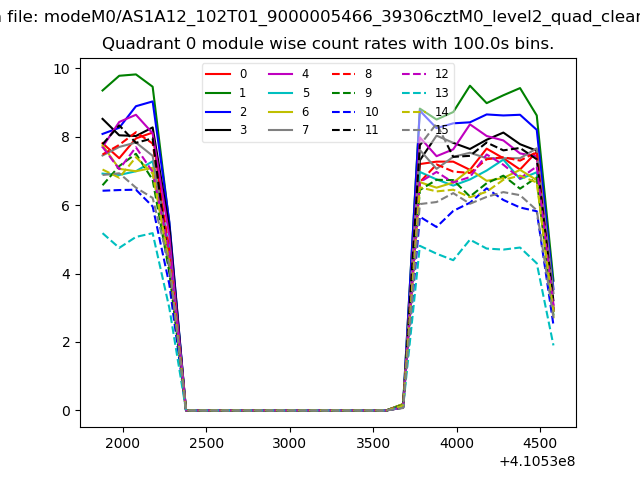 |
 |
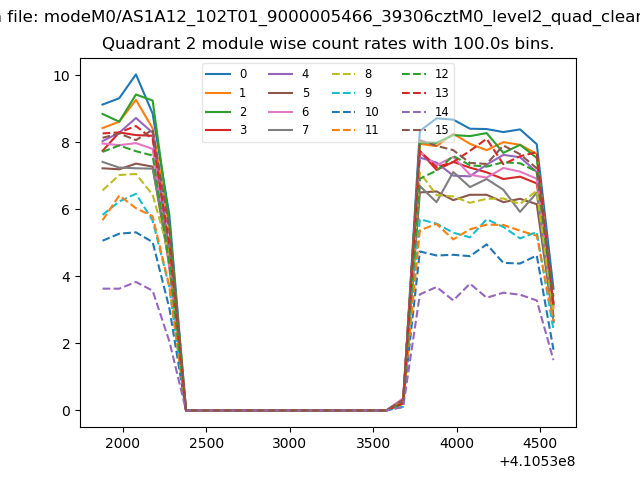
| Module-wise count rates for Quadrant B Data is divided into 100 sec bins |
 |
 |
| Module-wise count rates for Quadrant C Data is divided into 100 sec bins |
 |
 |
| Module-wise count rates for Quadrant D Data is divided into 100 sec bins |
 |
 |
| Parameter | Plot |
|---|---|
| CZT HV Monitor | 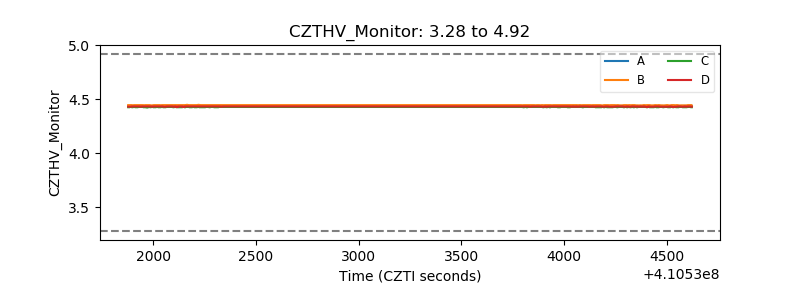 |
| D_VDD | 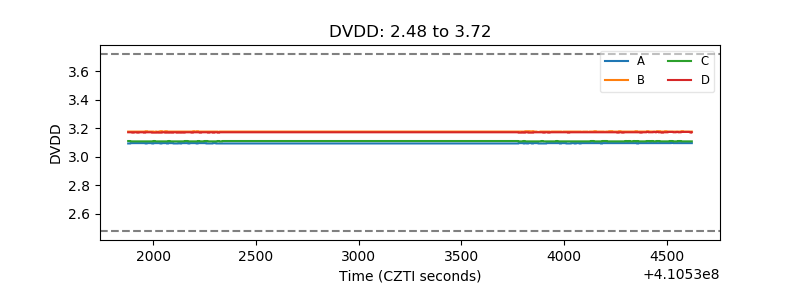 |
| Temperature 1 | 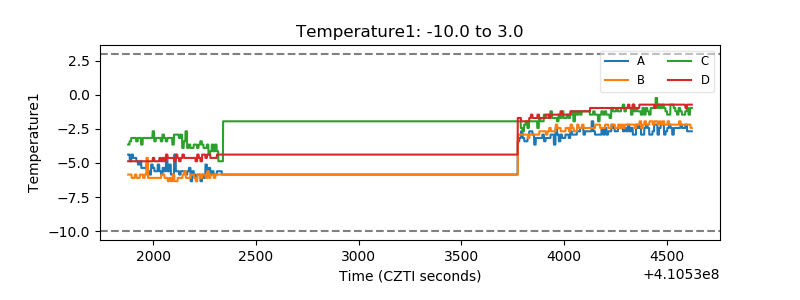 |
| Veto HV Monitor |  |
| Veto LLD | 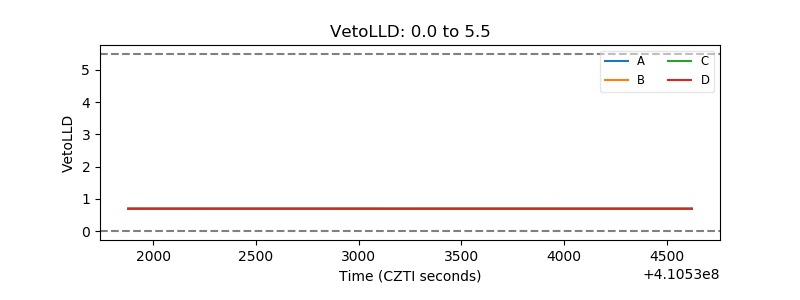 |
| Alpha Counter | 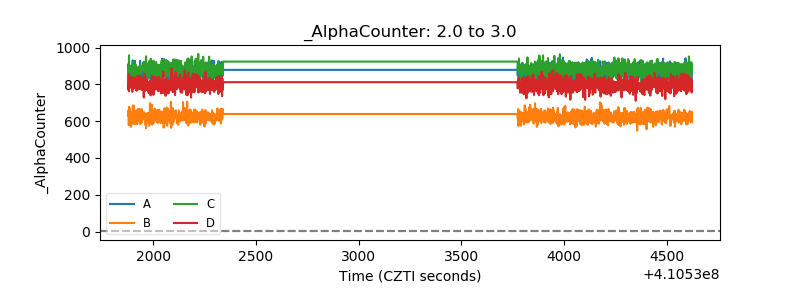 |
| _CPM_Rate | 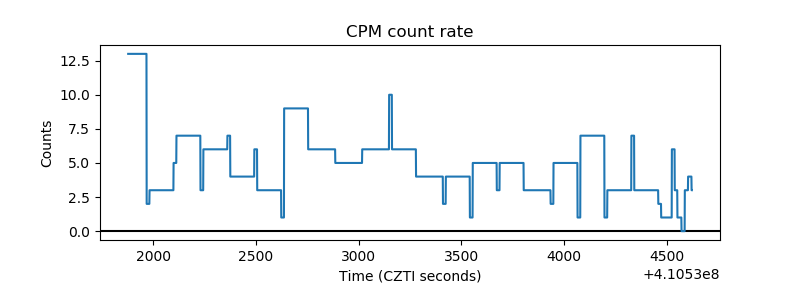 |
| CZT Counter | 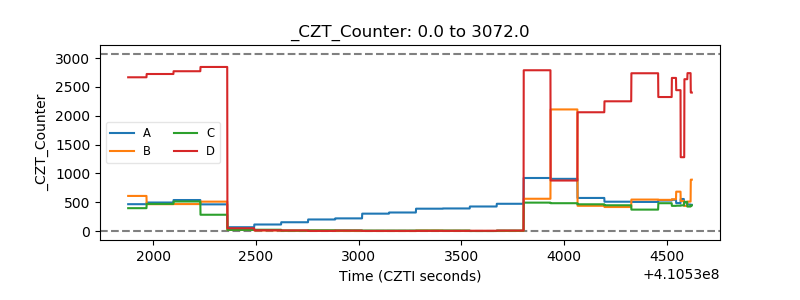 |
| +2.5 Volts monitor | 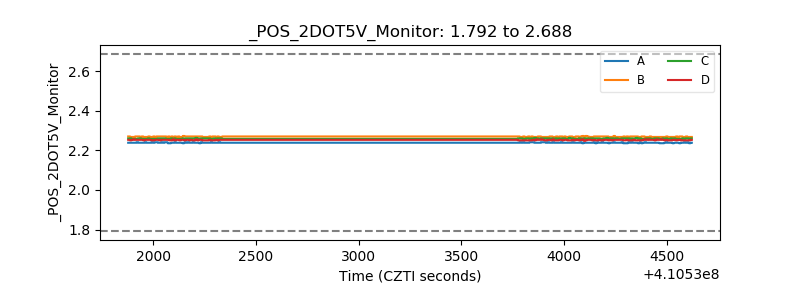 |
| +5 Volts monitor |  |
| _ROLL_ROT | 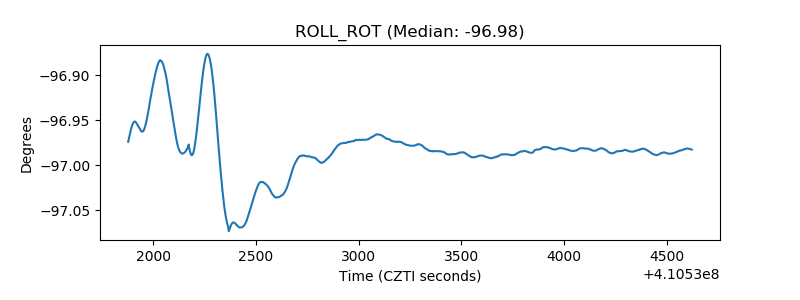 |
| _Roll_DEC | 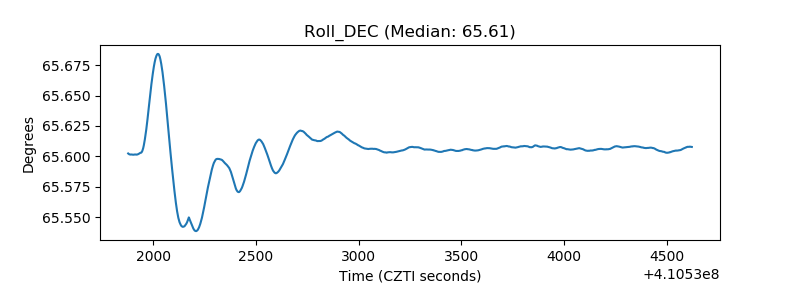 |
| _Roll_RA | 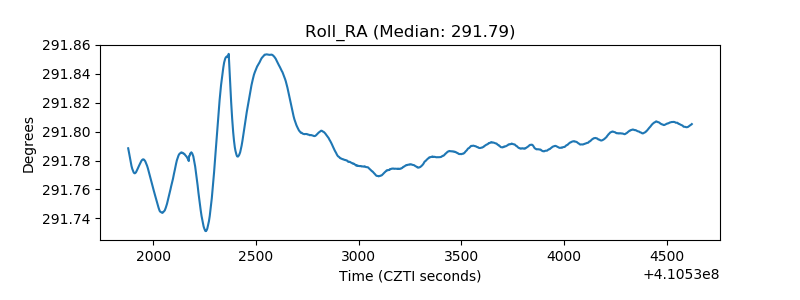 |
| Veto Counter | 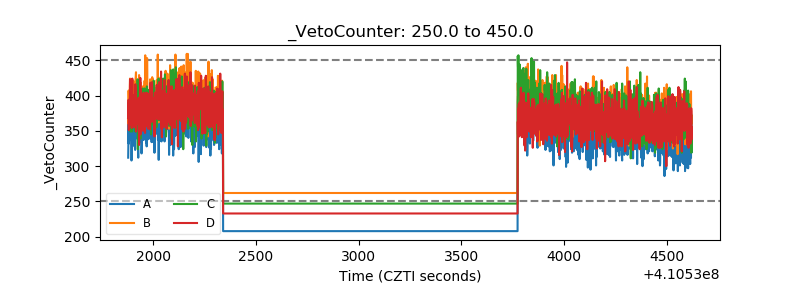 |