| Param | Original file | Final file |
|---|---|---|
| Filename | modeM0/AS1A12_102T01_9000005466_39307cztM0_level2.fits | modeM0/AS1A12_102T01_9000005466_39307cztM0_level2_quad_clean.evt |
| Size (bytes) | 604,566,720 | 84,427,200 |
| Size | 576.6 MB | 80.5 MB |
| Events in quadrant A | 3,057,338 | 663,382 |
| Events in quadrant B | 2,836,447 | 670,255 |
| Events in quadrant C | 2,771,700 | 635,637 |
| Events in quadrant D | 13,252,095 | 172,816 |
| Mode M9 | |||
|---|---|---|---|
| Quadrant | BADHDUFLAG | Total packets | Discarded packets |
| A | 0 | 13 | 0 |
| B | 0 | 13 | 0 |
| C | 0 | 13 | 0 |
| D | 0 | 14 | 0 |
| Mode M0 | |||
|---|---|---|---|
| Quadrant | BADHDUFLAG | Total packets | Discarded packets |
| A | 0 | 12663 | 3 |
| B | 0 | 12388 | 2 |
| C | 0 | 11944 | 2 |
| D | 0 | 43421 | 2 |
| Mode SS | |||
|---|---|---|---|
| Quadrant | BADHDUFLAG | Total packets | Discarded packets |
| A | 0 | 120 | 0 |
| B | 0 | 120 | 0 |
| C | 0 | 120 | 0 |
| D | 0 | 120 | 0 |
| Quadrant | Total seconds | Saturated seconds | Saturation percentage |
|---|---|---|---|
| A | 5927 | 13 | 0.219335% |
| B | 5927 | 16 | 0.269951% |
| C | 5927 | 3 | 0.050616% |
| D | 5927 | 4537 | 76.548001% |
Noise dominated data is calculated using 1-second bins in cleaned event files. If a bin has >2000 counts, and if more than 50% of those come from <1% of pixels, then it is considered to be noise-dominated and hence unusable.
| Quadrant | # 1 sec bins | Bins with >0 counts | Bins with >2000 counts | High rate bins dominated by noise | Noise dominated (total time) | Noise dominated (detector-on time) | Marked lightcurve |
|---|---|---|---|---|---|---|---|
| A | 7239 | 5928 | 4 | 4 | 0.06% | 0.07% | 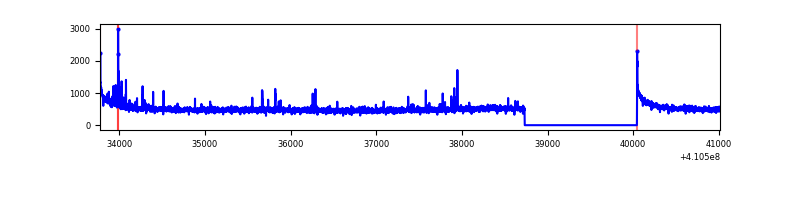 |
| B | 7239 | 5928 | 6 | 6 | 0.08% | 0.10% | 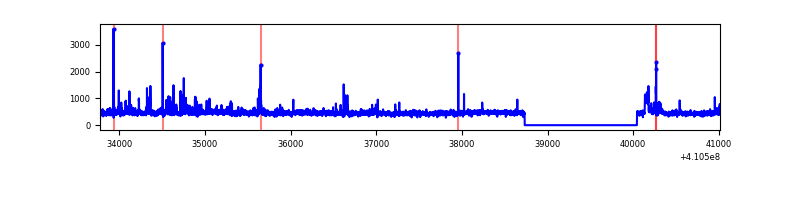 |
| C | 7239 | 5928 | 0 | 0 | 0.00% | 0.00% | 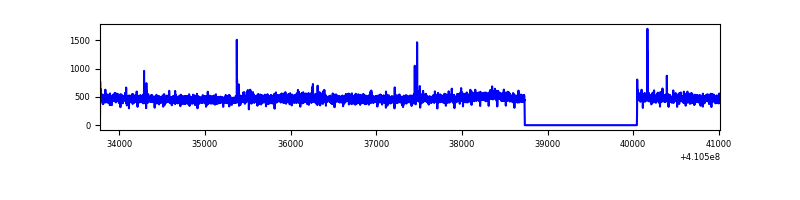 |
| D | 7239 | 5928 | 3746 | 3746 | 51.75% | 63.19% | 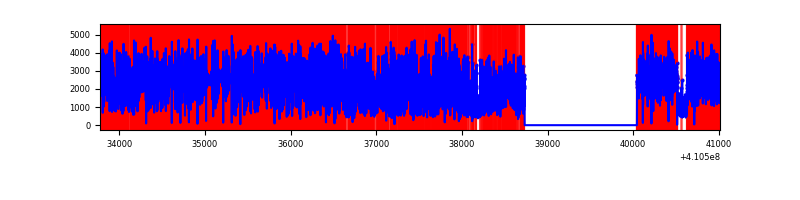 |
Top three noisy pixels from each quadrant. If the there are fewer than three noisy pixels in the level2.evt file, extra rows are filled as -1
| Pixel properties | Quadrant properties | ||||||
|---|---|---|---|---|---|---|---|
| Quadrant | DetID | PixID | Counts | Sigma | Mean | Median | Sigma |
| A | 10 | 83 | 465939 | 3480.02 | 651 | 638 | 133.7 |
| A | 13 | 248 | 69385 | 514.16 | 651 | 638 | 133.7 |
| A | 13 | 254 | 7164 | 48.81 | 651 | 638 | 133.7 |
| B | 0 | 183 | 97360 | 787.4 | 643 | 626 | 122.9 |
| B | 5 | 184 | 74049 | 597.66 | 643 | 626 | 122.9 |
| B | 5 | 172 | 36334 | 290.66 | 643 | 626 | 122.9 |
| C | 15 | 214 | 265424 | 1795.98 | 633 | 638 | 147.4 |
| C | 14 | 254 | 12513 | 80.55 | 633 | 638 | 147.4 |
| C | 9 | 187 | 9515 | 60.21 | 633 | 638 | 147.4 |
| D | 12 | 235 | 11502857 | 128411.39 | 361 | 348 | 89.6 |
| D | 12 | 227 | 211768 | 2360.24 | 361 | 348 | 89.6 |
| D | 2 | 249 | 41858 | 463.41 | 361 | 348 | 89.6 |
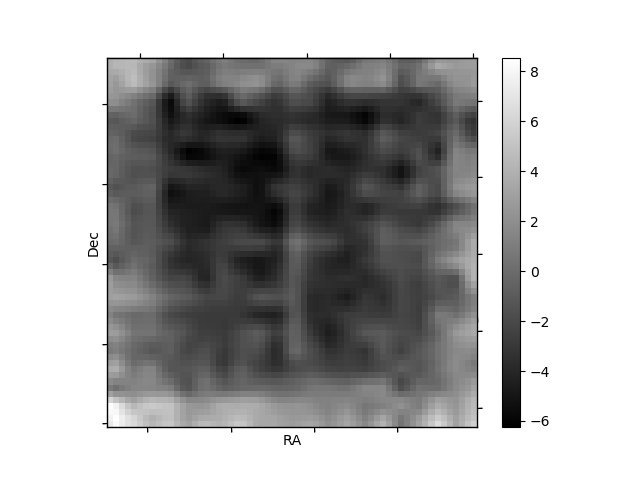
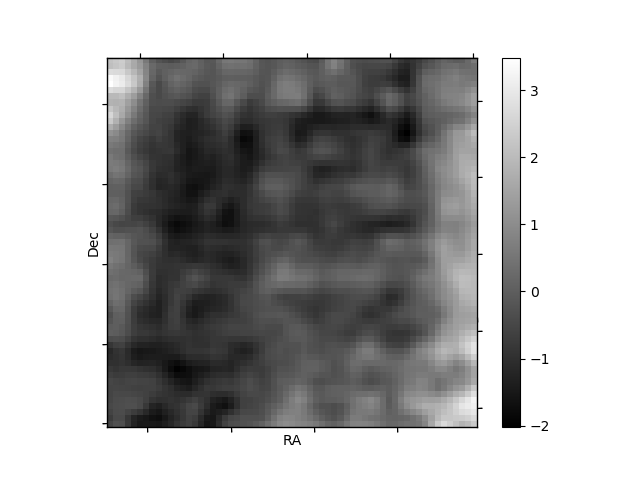
Histogram calculated using DETX and DETY for each event in the final _common_clean file
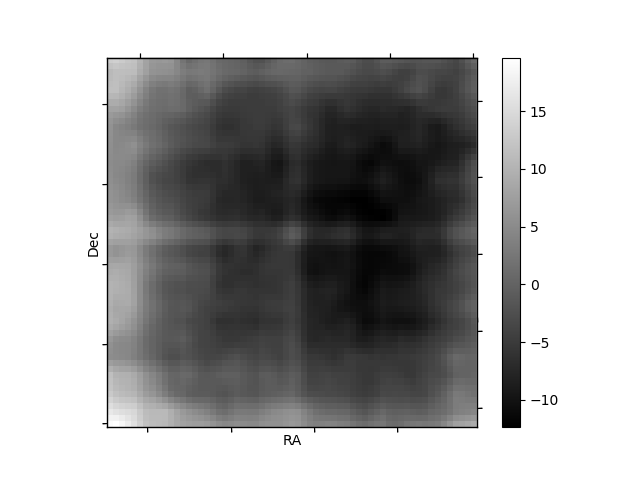
| Quadrant A | 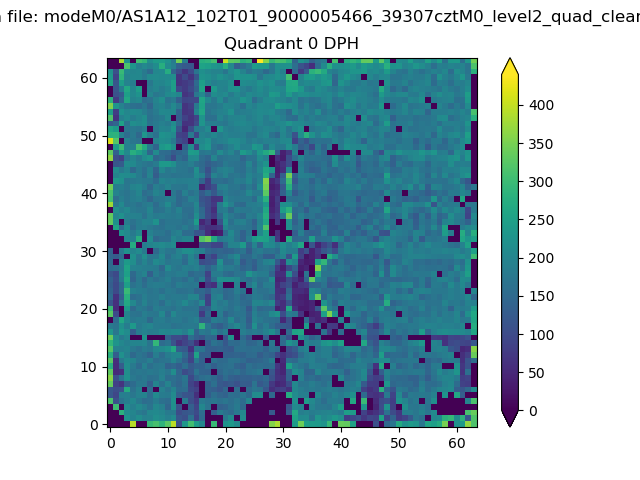 |
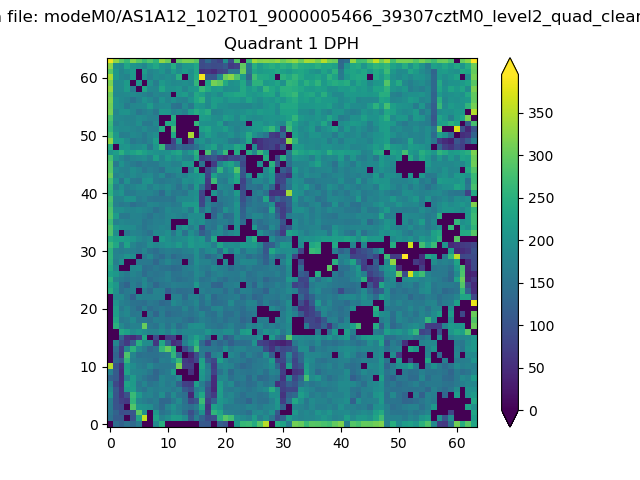 |
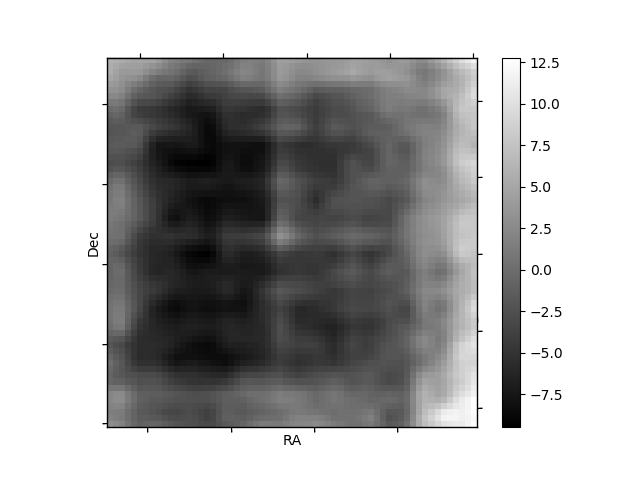
Quadrant B |
|---|---|---|---|
| Quadrant D | 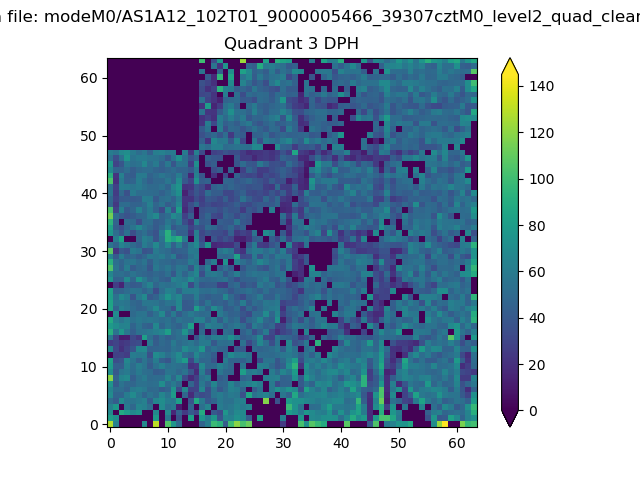 |
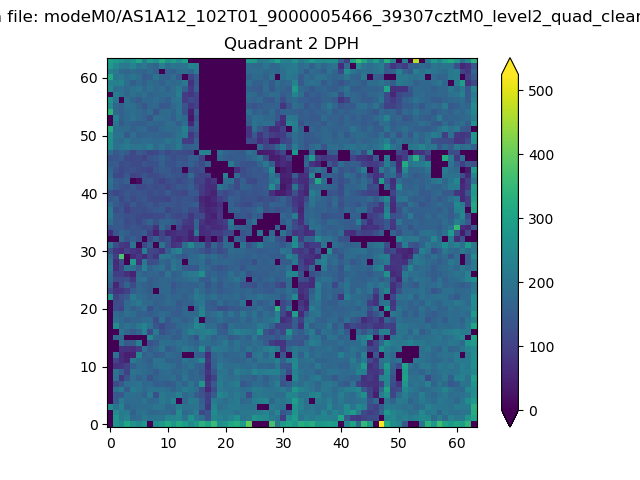 |
Quadrant C |
| Plot type | Count rate plots | Images |
|---|---|---|
| Comparison with Poisson distribution Blue bars denote a histogram of data divided into 1 sec bins. Red curve is a Poisson curve with rate = median count rate of data. |
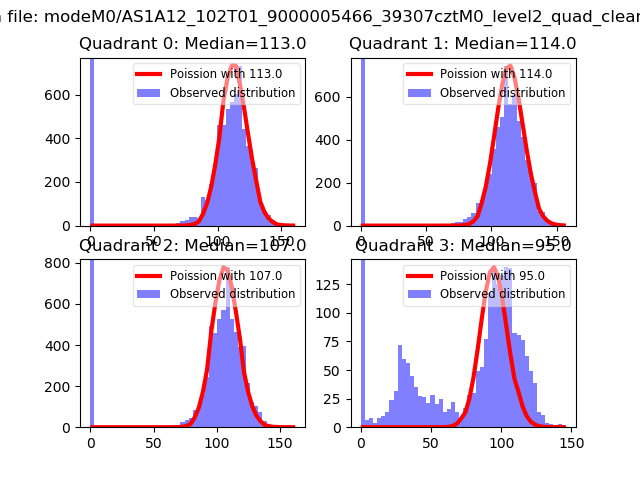 |
 |
| Quadrant-wise count rates Data is divided into 100 sec bins |
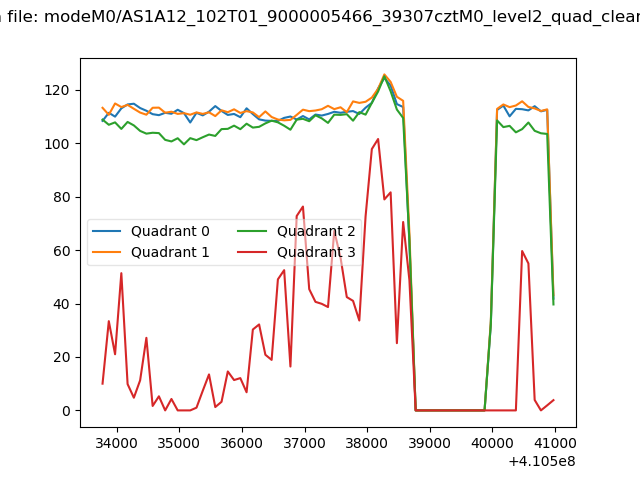 |
|
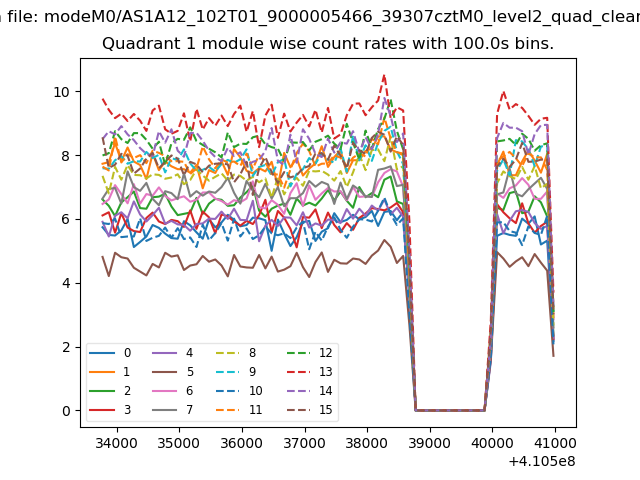
| Module-wise count rates for Quadrant A Data is divided into 100 sec bins |
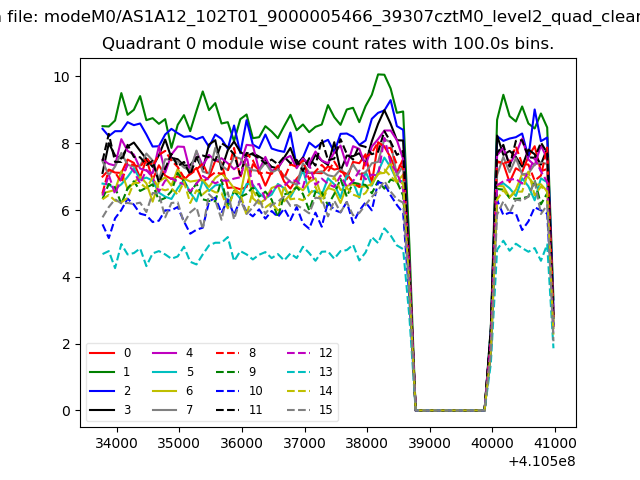 |
 |
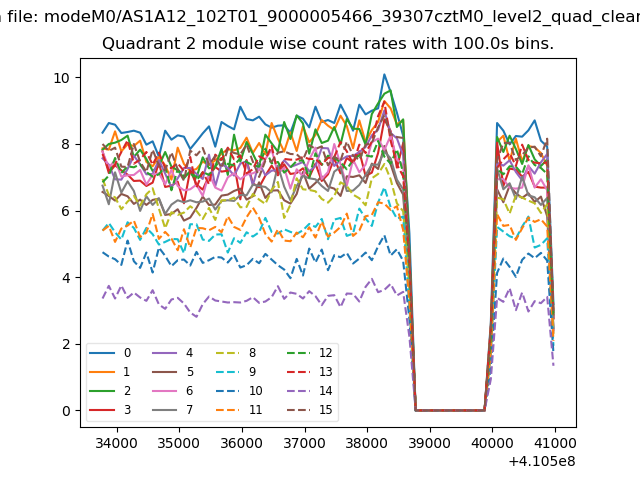
| Module-wise count rates for Quadrant B Data is divided into 100 sec bins |
 |
 |
| Module-wise count rates for Quadrant C Data is divided into 100 sec bins |
 |
 |
| Module-wise count rates for Quadrant D Data is divided into 100 sec bins |
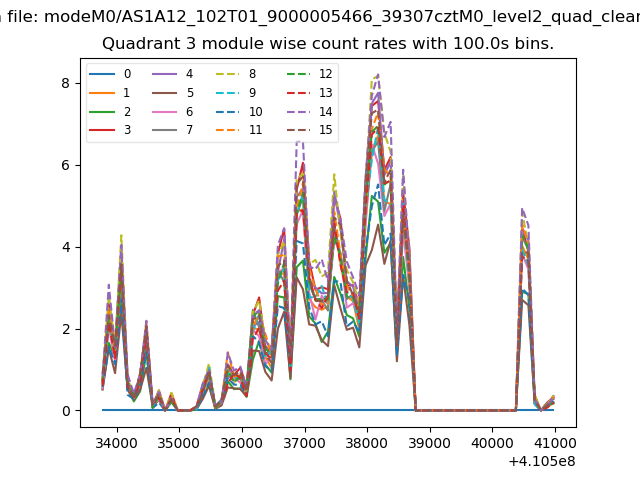 |
 |
| Parameter | Plot |
|---|---|
| CZT HV Monitor | 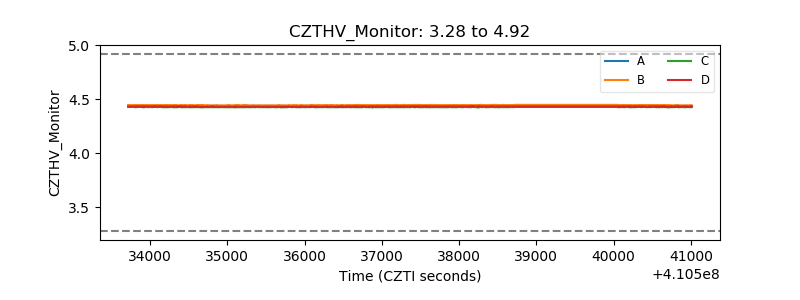 |
| D_VDD | 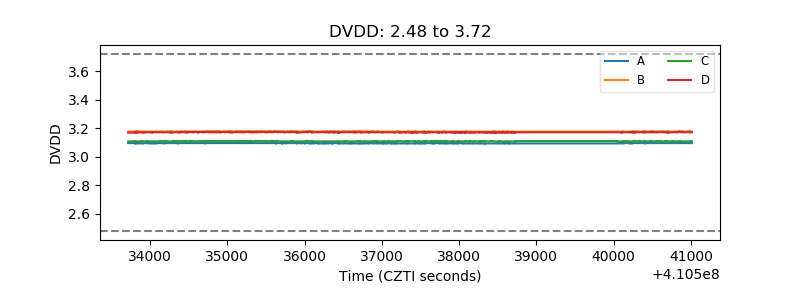 |
| Temperature 1 | 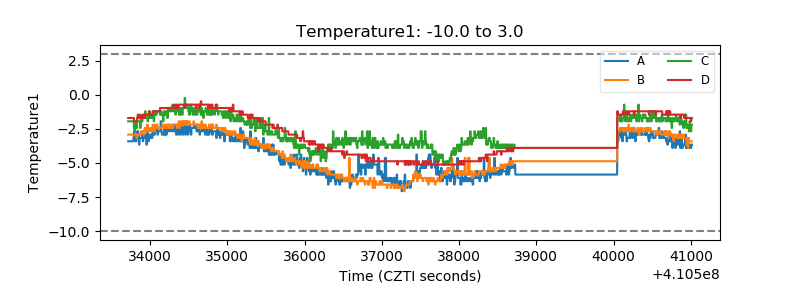 |
| Veto HV Monitor | 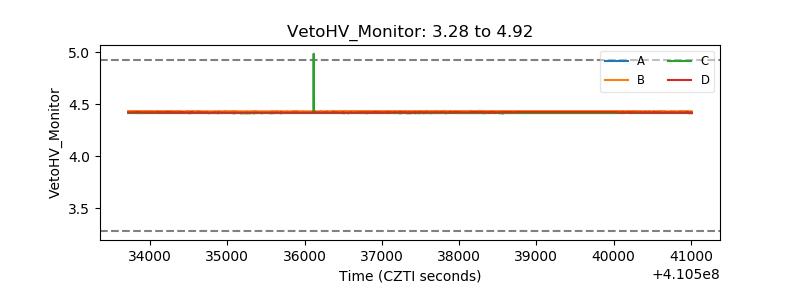 |
| Veto LLD | 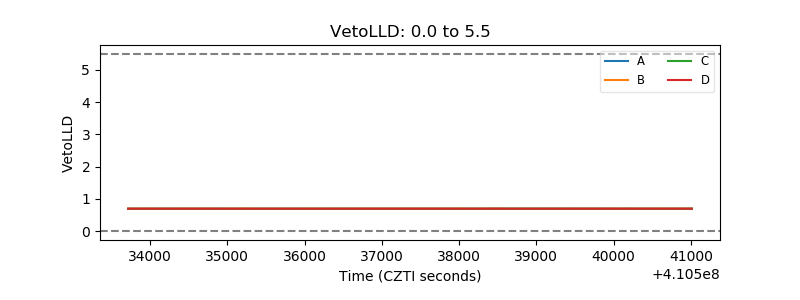 |
| Alpha Counter | 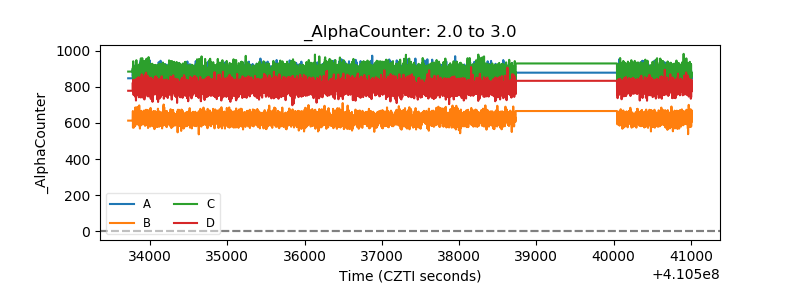 |
| _CPM_Rate | 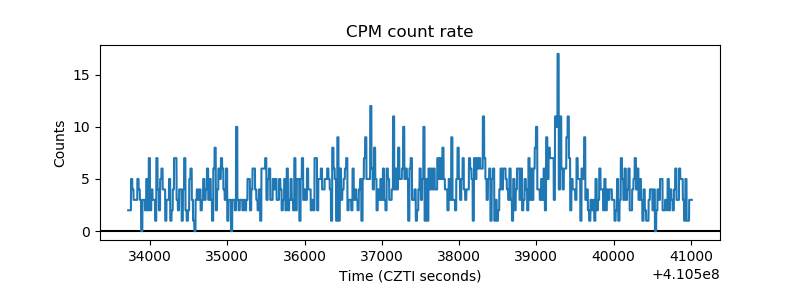 |
| CZT Counter | 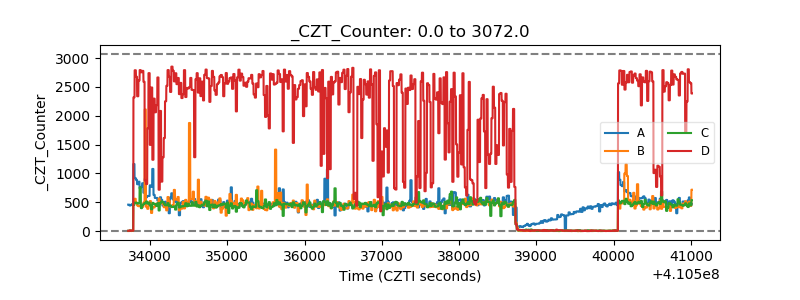 |
| +2.5 Volts monitor | 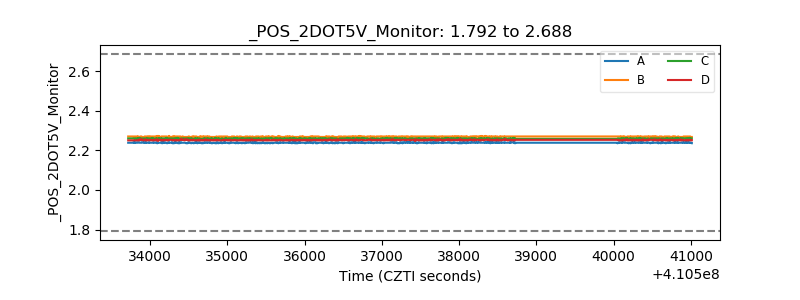 |
| +5 Volts monitor | 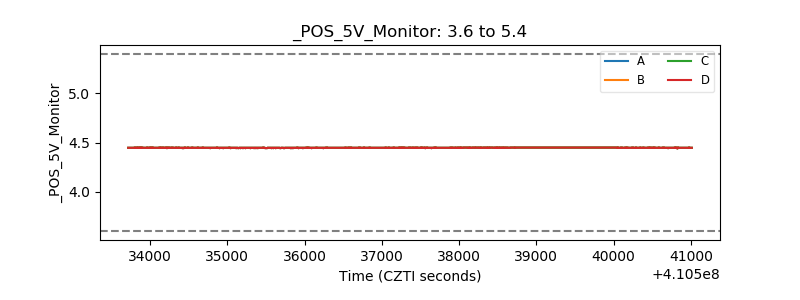 |
| _ROLL_ROT | 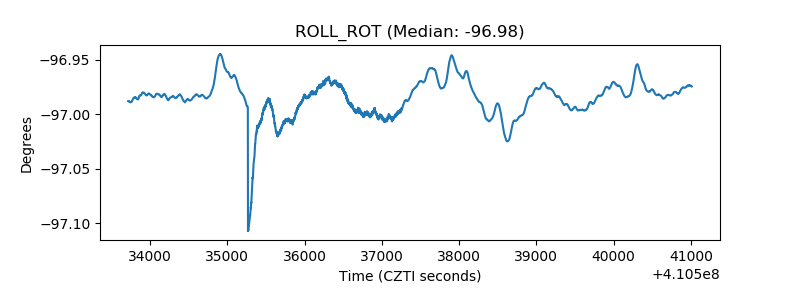 |
| _Roll_DEC | 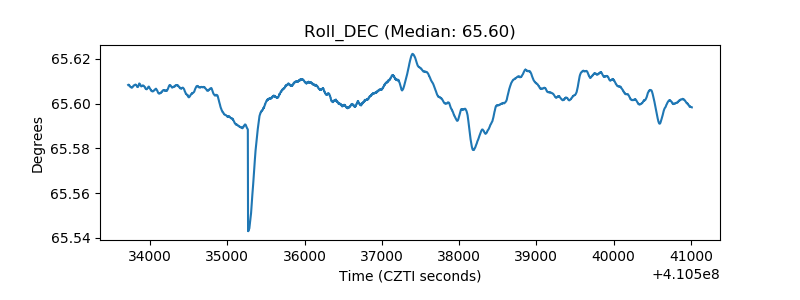 |
| _Roll_RA | 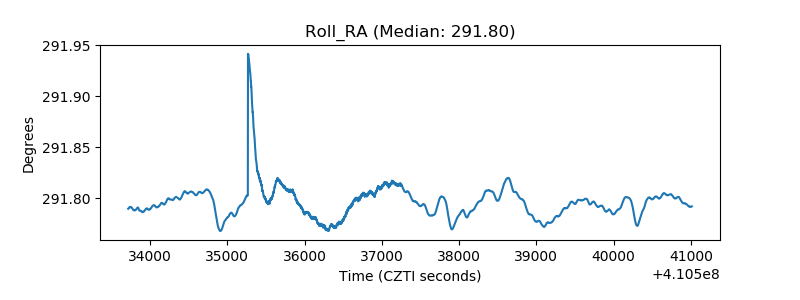 |
| Veto Counter | 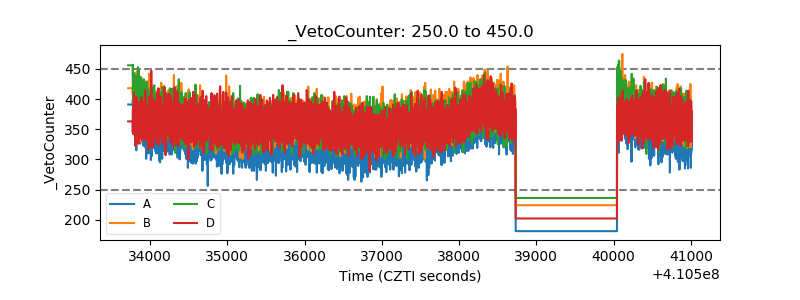 |