| Param | Original file | Final file |
|---|---|---|
| Filename | modeM0/AS1A12_102T01_9000005466_39310cztM0_level2.fits | modeM0/AS1A12_102T01_9000005466_39310cztM0_level2_quad_clean.evt |
| Size (bytes) | 1,707,056,640 | 208,595,520 |
| Size | 1.6 GB | 198.9 MB |
| Events in quadrant A | 7,902,717 | 1,709,008 |
| Events in quadrant B | 7,069,496 | 1,741,180 |
| Events in quadrant C | 7,682,941 | 1,664,397 |
| Events in quadrant D | 39,321,484 | 121,327 |
| Mode M9 | |||
|---|---|---|---|
| Quadrant | BADHDUFLAG | Total packets | Discarded packets |
| A | 0 | 42 | 0 |
| B | 0 | 42 | 0 |
| C | 0 | 42 | 0 |
| D | 0 | 42 | 0 |
| Mode M0 | |||
|---|---|---|---|
| Quadrant | BADHDUFLAG | Total packets | Discarded packets |
| A | 0 | 33287 | 5 |
| B | 0 | 32157 | 4 |
| C | 0 | 32760 | 4 |
| D | 0 | 127641 | 4 |
| Mode SS | |||
|---|---|---|---|
| Quadrant | BADHDUFLAG | Total packets | Discarded packets |
| A | 0 | 318 | 0 |
| B | 0 | 318 | 0 |
| C | 0 | 318 | 0 |
| D | 0 | 318 | 0 |
| Quadrant | Total seconds | Saturated seconds | Saturation percentage |
|---|---|---|---|
| A | 15646 | 54 | 0.345136% |
| B | 15646 | 42 | 0.268439% |
| C | 15646 | 29 | 0.185351% |
| D | 15646 | 14729 | 94.139077% |
Noise dominated data is calculated using 1-second bins in cleaned event files. If a bin has >2000 counts, and if more than 50% of those come from <1% of pixels, then it is considered to be noise-dominated and hence unusable.
| Quadrant | # 1 sec bins | Bins with >0 counts | Bins with >2000 counts | High rate bins dominated by noise | Noise dominated (total time) | Noise dominated (detector-on time) | Marked lightcurve |
|---|---|---|---|---|---|---|---|
| A | 19822 | 15649 | 27 | 27 | 0.14% | 0.17% | 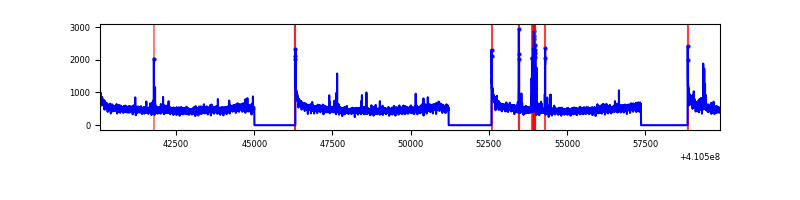 |
| B | 19822 | 15649 | 20 | 20 | 0.10% | 0.13% | 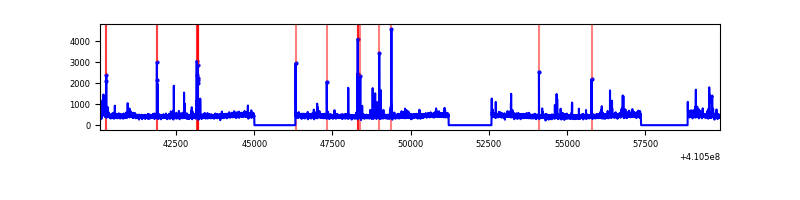 |
| C | 19822 | 15649 | 23 | 23 | 0.12% | 0.15% | 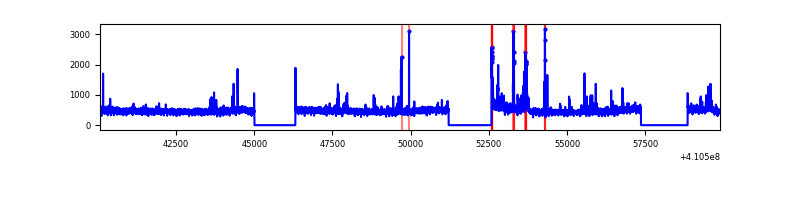 |
| D | 19821 | 15647 | 12263 | 12263 | 61.87% | 78.37% | 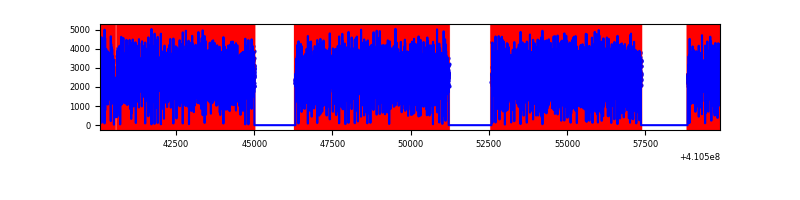 |
Top three noisy pixels from each quadrant. If the there are fewer than three noisy pixels in the level2.evt file, extra rows are filled as -1
| Pixel properties | Quadrant properties | ||||||
|---|---|---|---|---|---|---|---|
| Quadrant | DetID | PixID | Counts | Sigma | Mean | Median | Sigma |
| A | 10 | 83 | 1089967 | 3156.13 | 1713 | 1677 | 344.8 |
| A | 13 | 248 | 172990 | 496.82 | 1713 | 1677 | 344.8 |
| A | 3 | 137 | 19471 | 51.6 | 1713 | 1677 | 344.8 |
| B | 5 | 255 | 149325 | 452.73 | 1703 | 1654 | 326.2 |
| B | 5 | 184 | 106751 | 322.2 | 1703 | 1654 | 326.2 |
| B | 5 | 172 | 102009 | 307.67 | 1703 | 1654 | 326.2 |
| C | 15 | 214 | 691109 | 1782.26 | 1673 | 1685 | 386.8 |
| C | 9 | 187 | 199130 | 510.42 | 1673 | 1685 | 386.8 |
| C | 3 | 233 | 135992 | 347.2 | 1673 | 1685 | 386.8 |
| D | 12 | 235 | 33141209 | 185840.85 | 724 | 701 | 178.3 |
| D | 12 | 227 | 2357698 | 13217.25 | 724 | 701 | 178.3 |
| D | 2 | 249 | 369042 | 2065.53 | 724 | 701 | 178.3 |
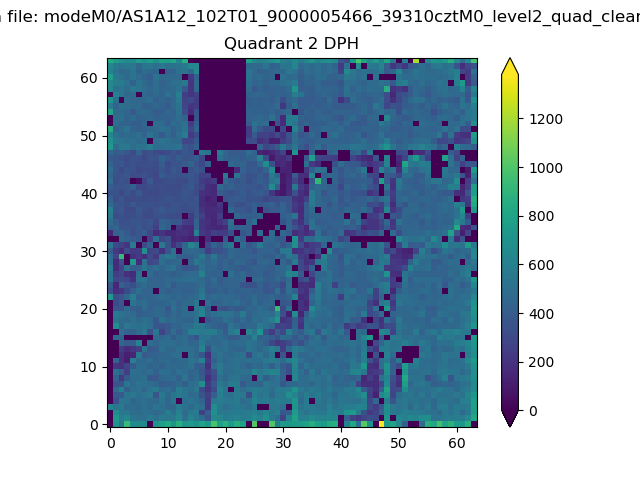
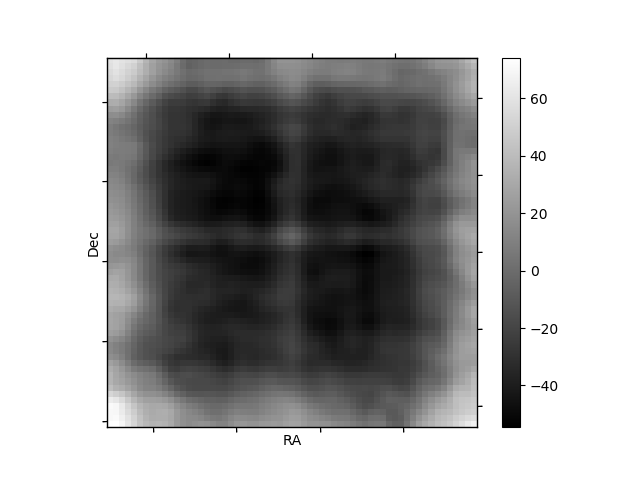
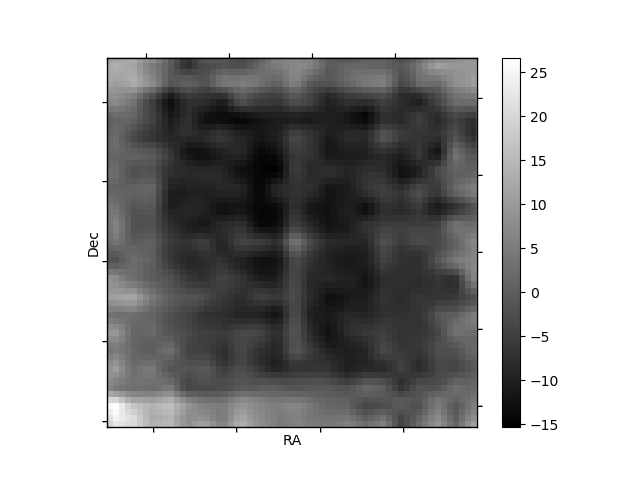
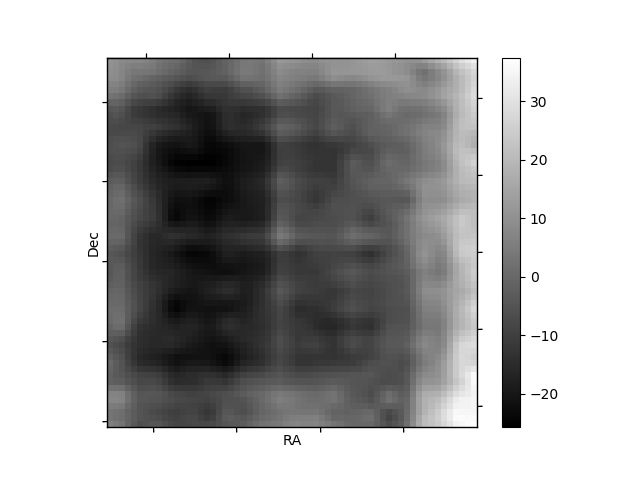
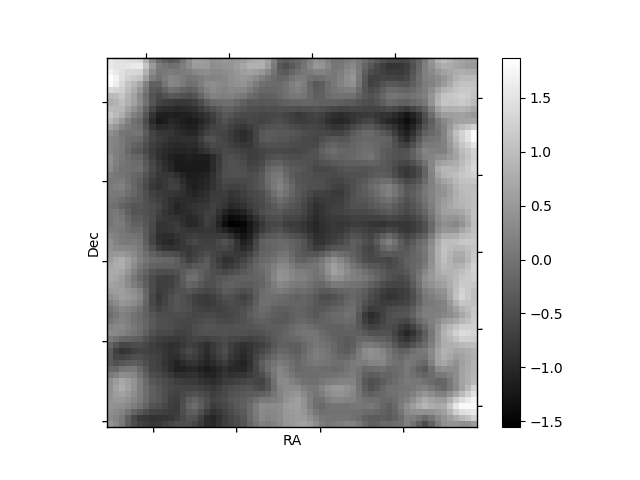
Histogram calculated using DETX and DETY for each event in the final _common_clean file
| Quadrant A | 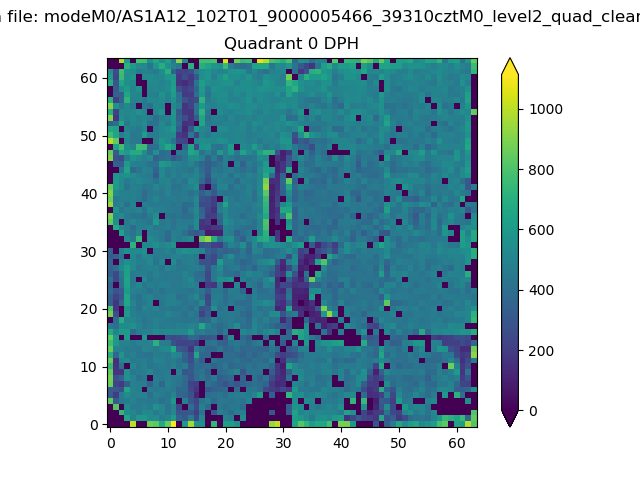 |
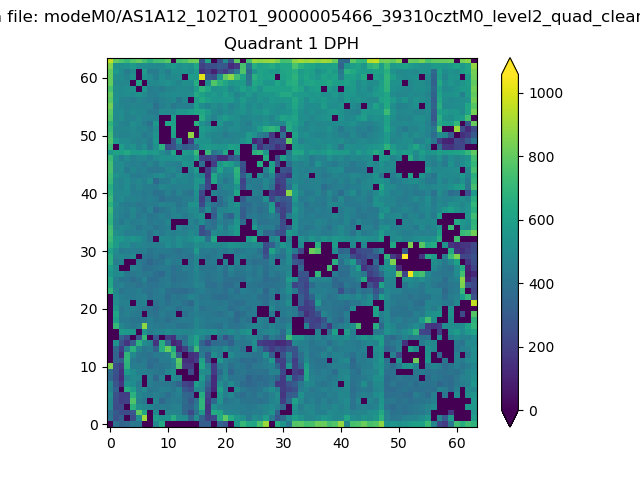 |
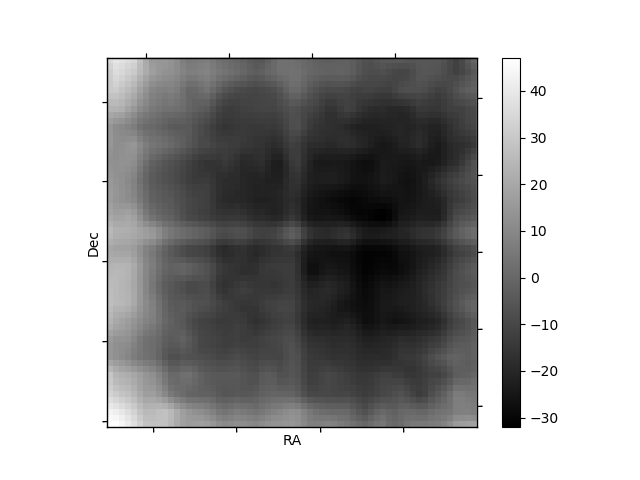
Quadrant B |
|---|---|---|---|
| Quadrant D | 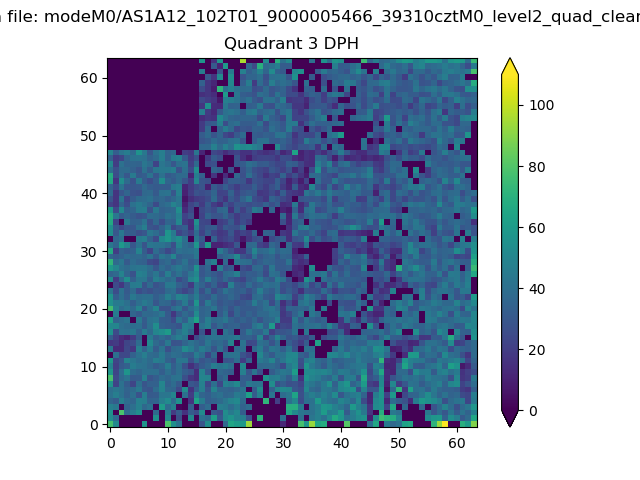 |
 |
Quadrant C |
| Plot type | Count rate plots | Images |
|---|---|---|
| Comparison with Poisson distribution Blue bars denote a histogram of data divided into 1 sec bins. Red curve is a Poisson curve with rate = median count rate of data. |
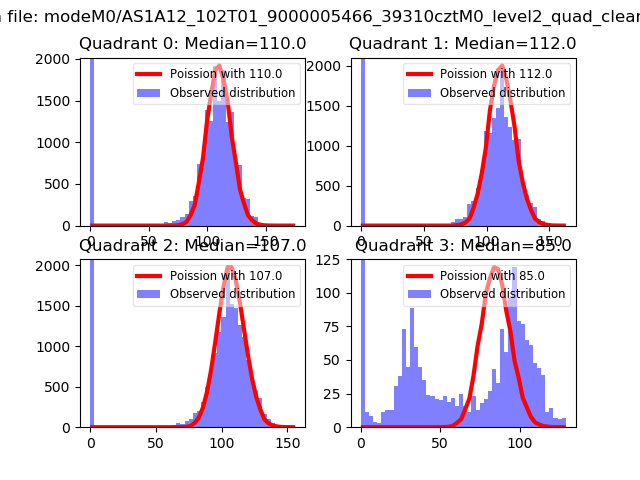 |
 |
| Quadrant-wise count rates Data is divided into 100 sec bins |
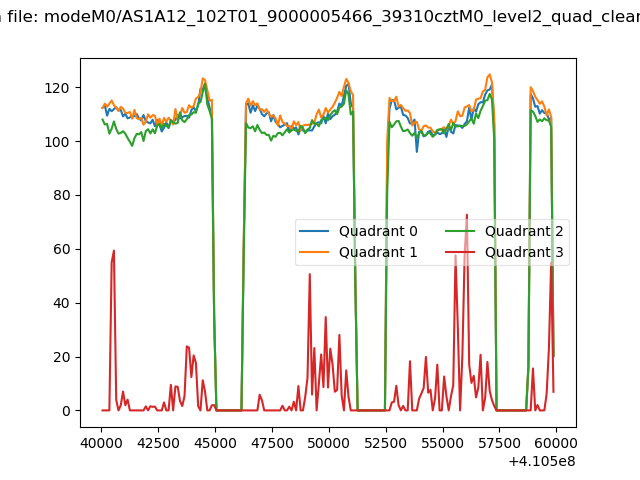 |
|
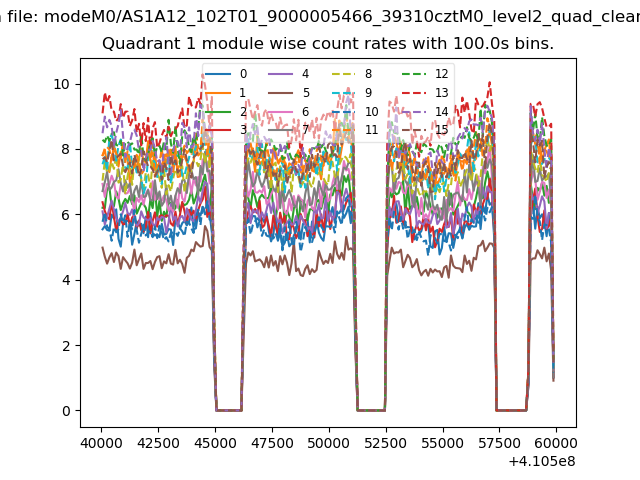
| Module-wise count rates for Quadrant A Data is divided into 100 sec bins |
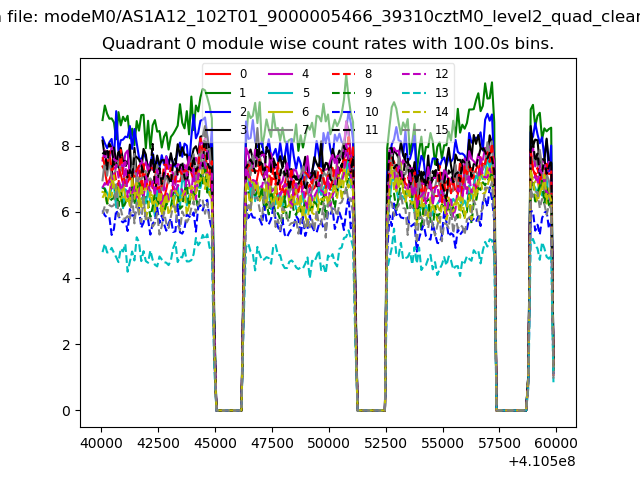 |
 |
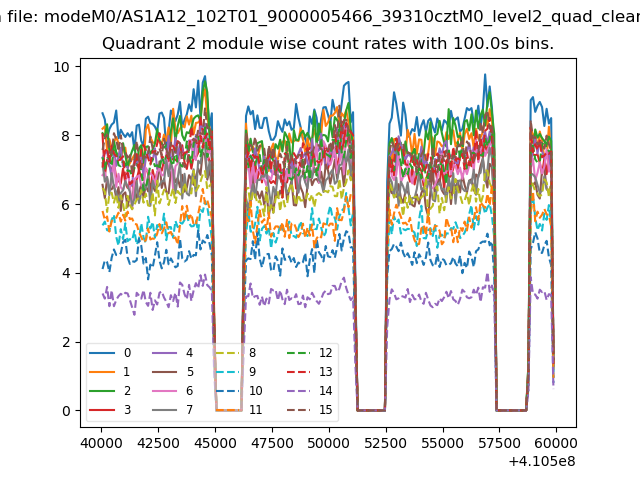
| Module-wise count rates for Quadrant B Data is divided into 100 sec bins |
 |
 |
| Module-wise count rates for Quadrant C Data is divided into 100 sec bins |
 |
 |
| Module-wise count rates for Quadrant D Data is divided into 100 sec bins |
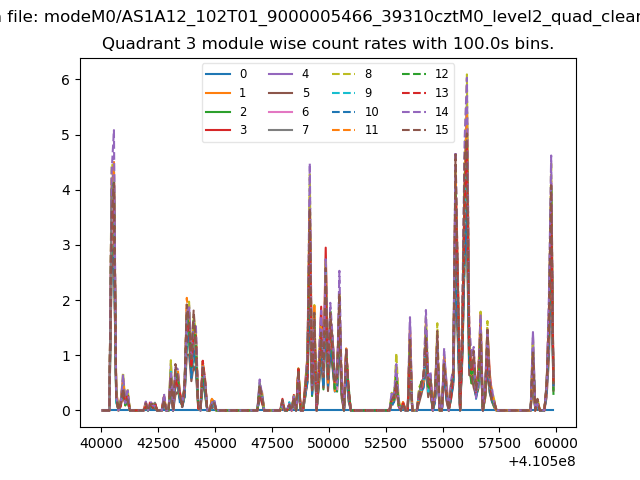 |
 |
| Parameter | Plot |
|---|---|
| CZT HV Monitor | 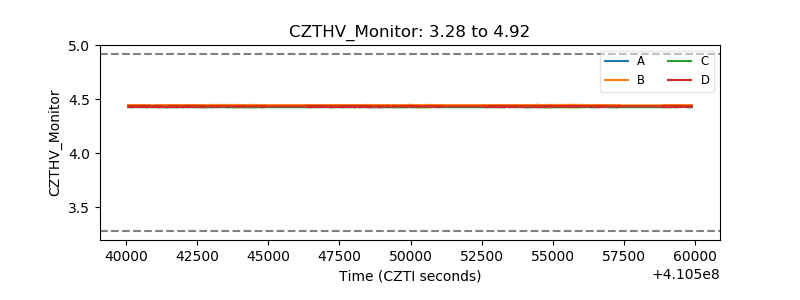 |
| D_VDD | 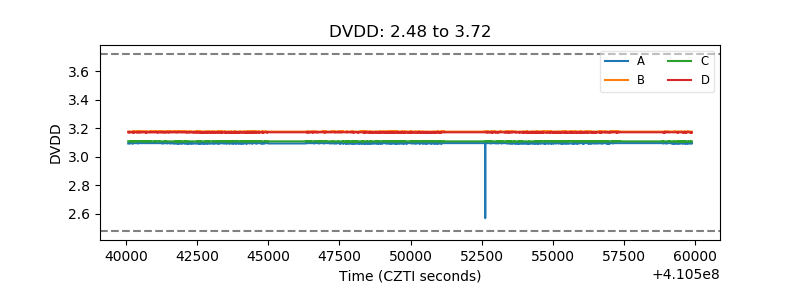 |
| Temperature 1 | 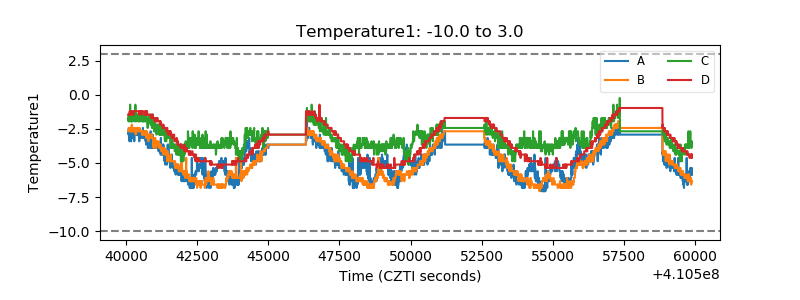 |
| Veto HV Monitor | 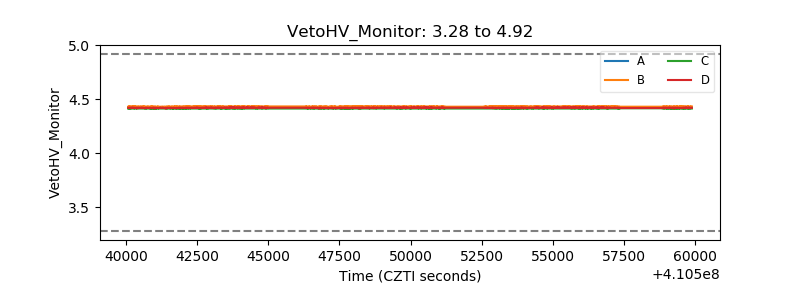 |
| Veto LLD | 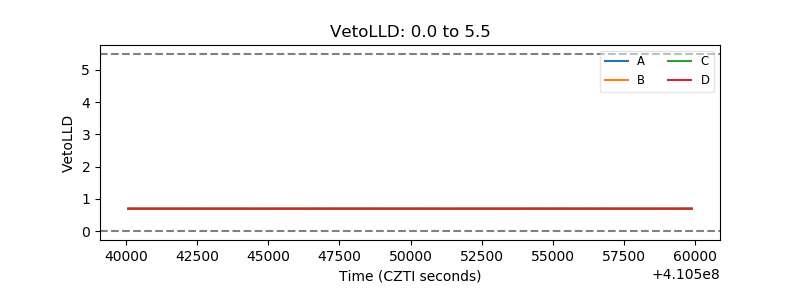 |
| Alpha Counter | 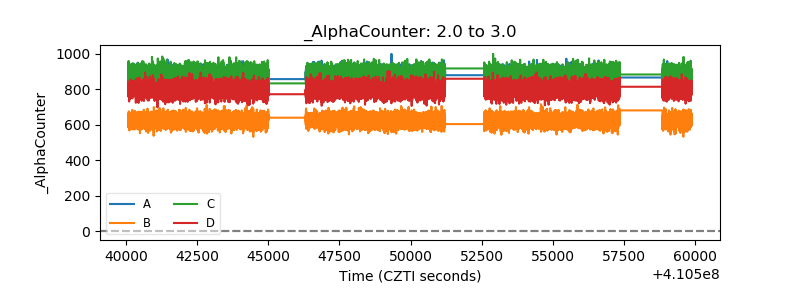 |
| _CPM_Rate | 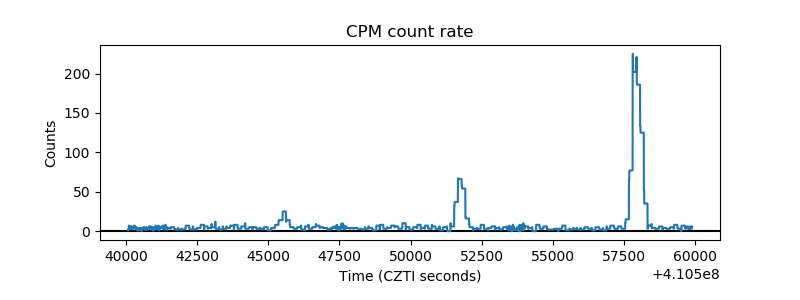 |
| CZT Counter | 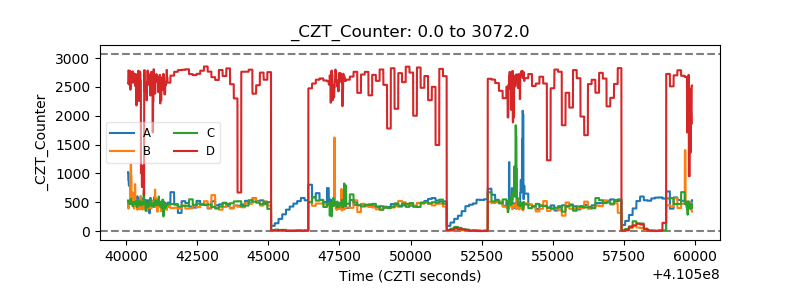 |
| +2.5 Volts monitor |  |
| +5 Volts monitor | 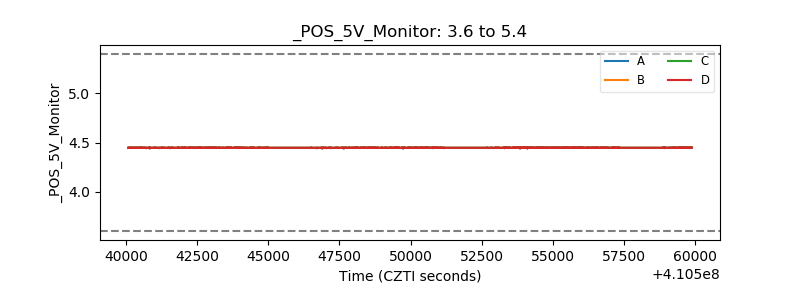 |
| _ROLL_ROT | 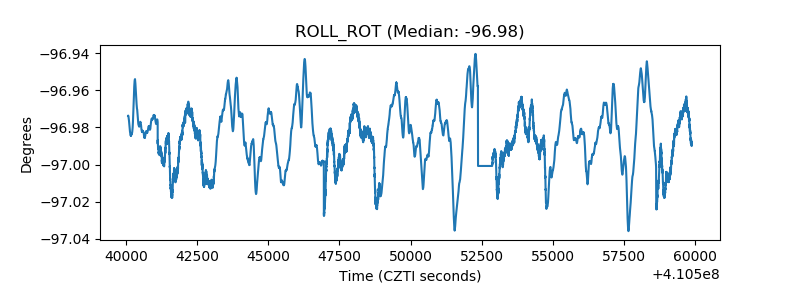 |
| _Roll_DEC | 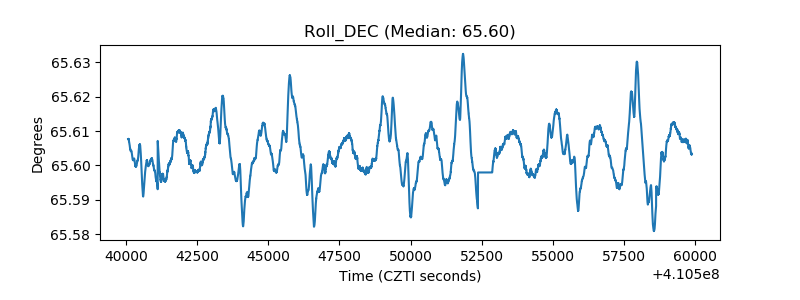 |
| _Roll_RA | 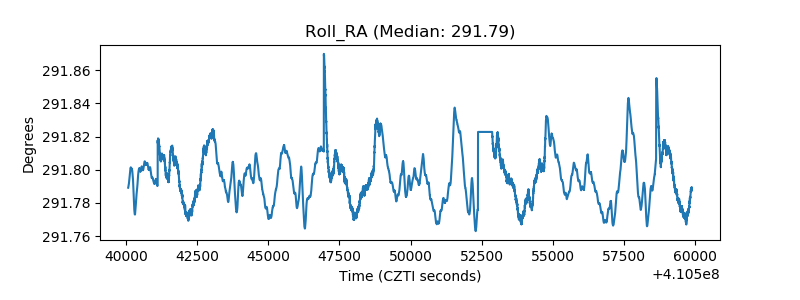 |
| Veto Counter |  |