| Param | Original file | Final file |
|---|---|---|
| Filename | modeM0/AS1A12_102T01_9000005466_39311cztM0_level2.fits | modeM0/AS1A12_102T01_9000005466_39311cztM0_level2_quad_clean.evt |
| Size (bytes) | 550,627,200 | 75,355,200 |
| Size | 525.1 MB | 71.9 MB |
| Events in quadrant A | 2,707,126 | 590,322 |
| Events in quadrant B | 2,472,224 | 601,593 |
| Events in quadrant C | 2,634,021 | 582,785 |
| Events in quadrant D | 12,149,411 | 130,665 |
| Mode M9 | |||
|---|---|---|---|
| Quadrant | BADHDUFLAG | Total packets | Discarded packets |
| A | 0 | 17 | 0 |
| B | 0 | 17 | 0 |
| C | 0 | 17 | 0 |
| D | 0 | 17 | 0 |
| Mode M0 | |||
|---|---|---|---|
| Quadrant | BADHDUFLAG | Total packets | Discarded packets |
| A | 0 | 11469 | 2 |
| B | 0 | 11213 | 1 |
| C | 0 | 11344 | 1 |
| D | 0 | 39765 | 1 |
| Mode SS | |||
|---|---|---|---|
| Quadrant | BADHDUFLAG | Total packets | Discarded packets |
| A | 0 | 106 | 0 |
| B | 0 | 106 | 0 |
| C | 0 | 106 | 0 |
| D | 0 | 106 | 0 |
| Quadrant | Total seconds | Saturated seconds | Saturation percentage |
|---|---|---|---|
| A | 5384 | 16 | 0.297177% |
| B | 5384 | 45 | 0.835810% |
| C | 5384 | 7 | 0.130015% |
| D | 5384 | 4270 | 79.309064% |
Noise dominated data is calculated using 1-second bins in cleaned event files. If a bin has >2000 counts, and if more than 50% of those come from <1% of pixels, then it is considered to be noise-dominated and hence unusable.
| Quadrant | # 1 sec bins | Bins with >0 counts | Bins with >2000 counts | High rate bins dominated by noise | Noise dominated (total time) | Noise dominated (detector-on time) | Marked lightcurve |
|---|---|---|---|---|---|---|---|
| A | 6997 | 5385 | 6 | 6 | 0.09% | 0.11% | 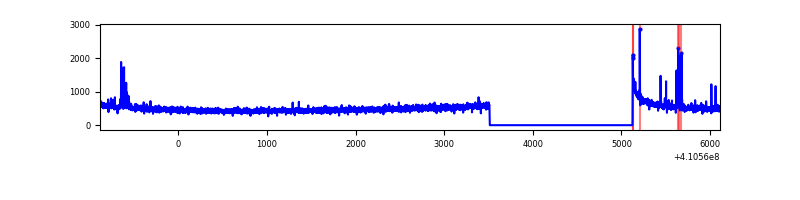 |
| B | 6997 | 5385 | 28 | 28 | 0.40% | 0.52% | 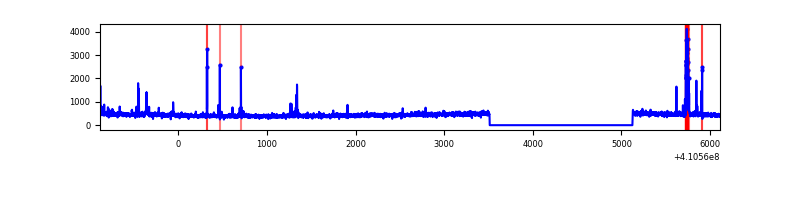 |
| C | 6997 | 5385 | 3 | 3 | 0.04% | 0.06% | 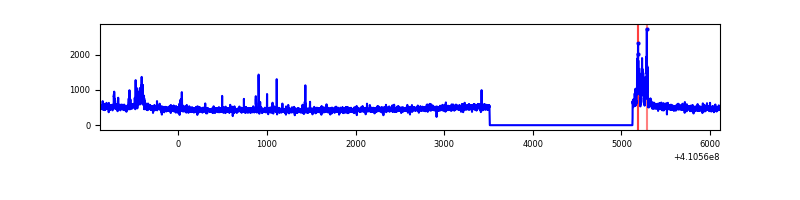 |
| D | 6996 | 5383 | 3528 | 3528 | 50.43% | 65.54% | 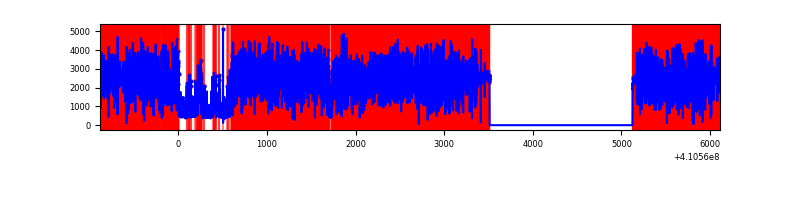 |
Top three noisy pixels from each quadrant. If the there are fewer than three noisy pixels in the level2.evt file, extra rows are filled as -1
| Pixel properties | Quadrant properties | ||||||
|---|---|---|---|---|---|---|---|
| Quadrant | DetID | PixID | Counts | Sigma | Mean | Median | Sigma |
| A | 10 | 83 | 355485 | 2958.27 | 585 | 571 | 120.0 |
| A | 13 | 248 | 59738 | 493.17 | 585 | 571 | 120.0 |
| A | 15 | 222 | 25906 | 211.17 | 585 | 571 | 120.0 |
| B | 5 | 172 | 119283 | 1045.87 | 582 | 567 | 113.5 |
| B | 5 | 255 | 29025 | 250.71 | 582 | 567 | 113.5 |
| B | 5 | 184 | 25763 | 221.97 | 582 | 567 | 113.5 |
| C | 15 | 214 | 238964 | 1755.35 | 575 | 577 | 135.8 |
| C | 9 | 187 | 130755 | 958.56 | 575 | 577 | 135.8 |
| C | 15 | 159 | 10517 | 73.19 | 575 | 577 | 135.8 |
| D | 12 | 235 | 10082764 | 123448.99 | 330 | 321 | 81.7 |
| D | 13 | 249 | 264341 | 3232.65 | 330 | 321 | 81.7 |
| D | 12 | 227 | 251170 | 3071.38 | 330 | 321 | 81.7 |
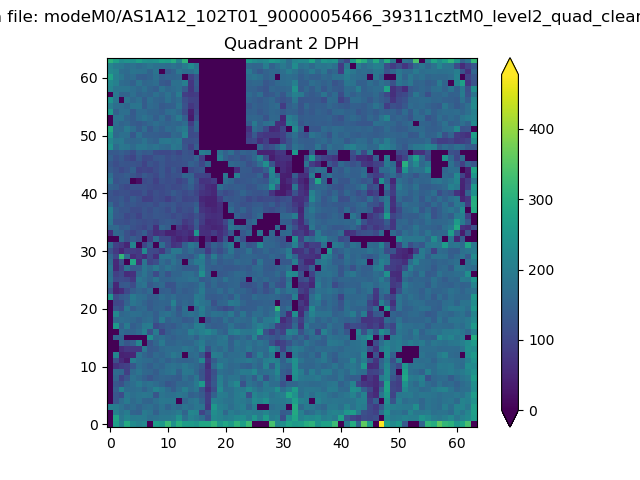
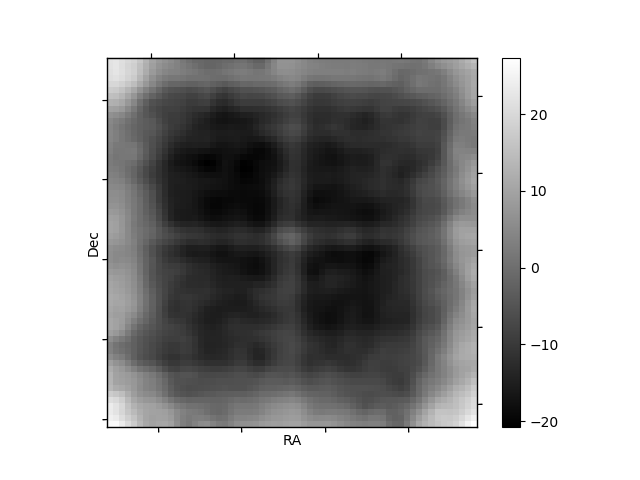
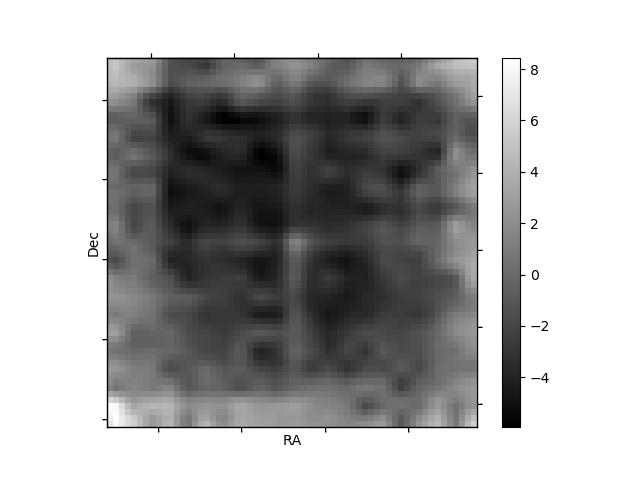
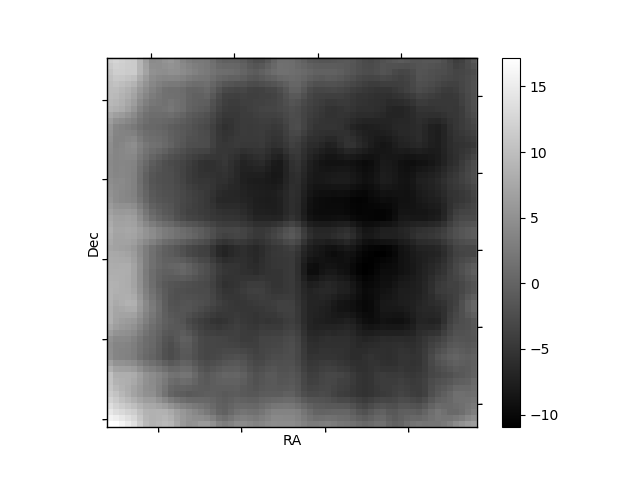
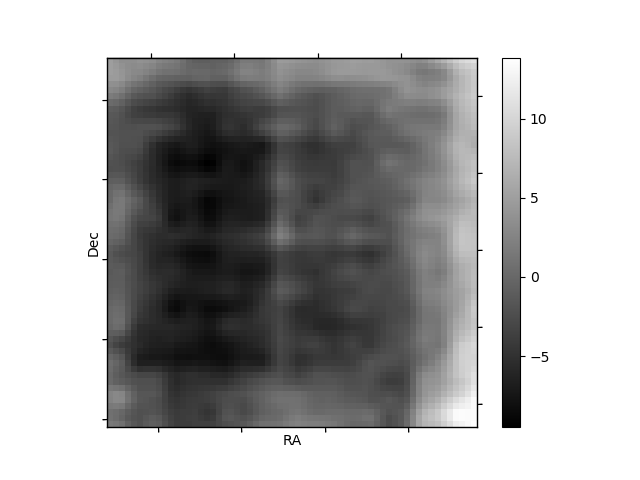
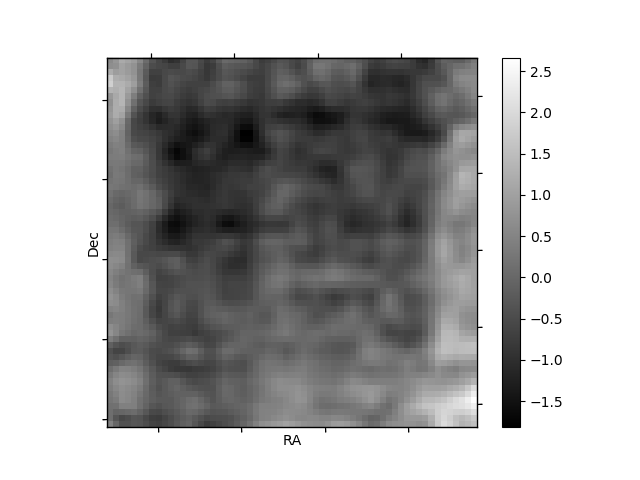
Histogram calculated using DETX and DETY for each event in the final _common_clean file
| Quadrant A | 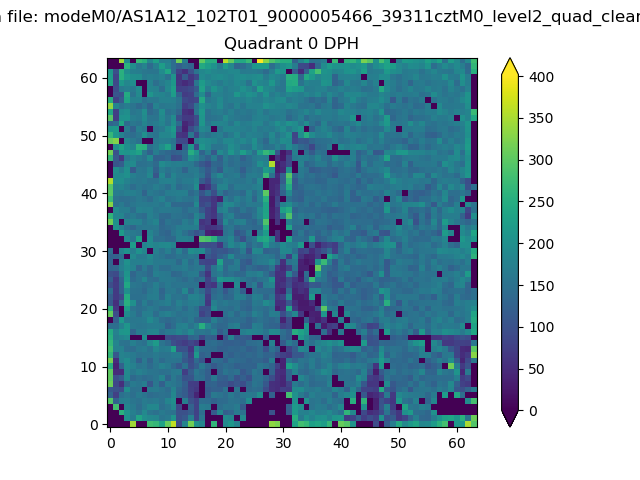 |
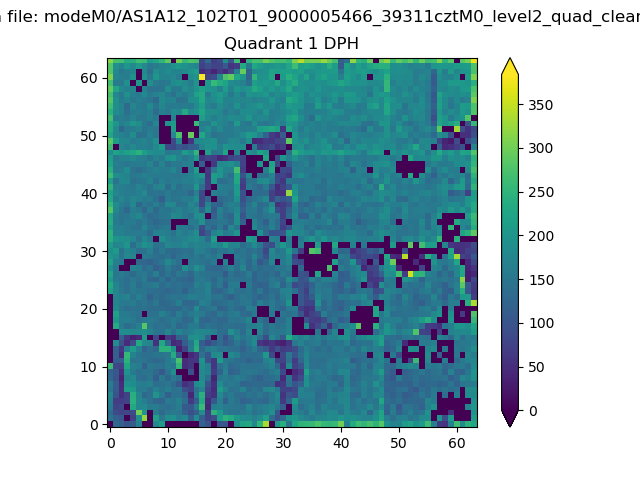 |
Quadrant B |
|---|---|---|---|
| Quadrant D | 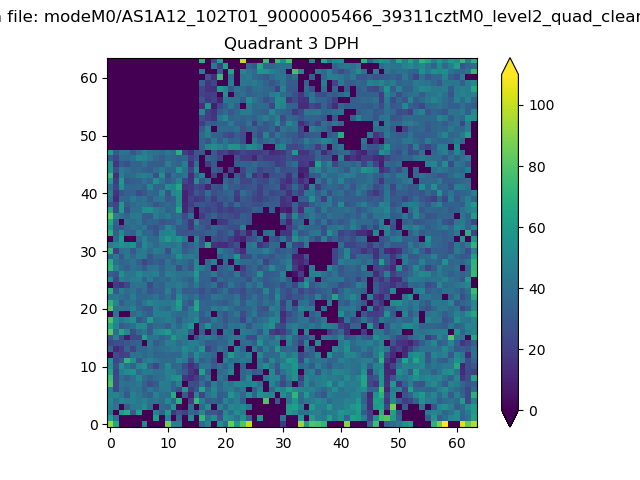 |
 |
Quadrant C |
| Plot type | Count rate plots | Images |
|---|---|---|
| Comparison with Poisson distribution Blue bars denote a histogram of data divided into 1 sec bins. Red curve is a Poisson curve with rate = median count rate of data. |
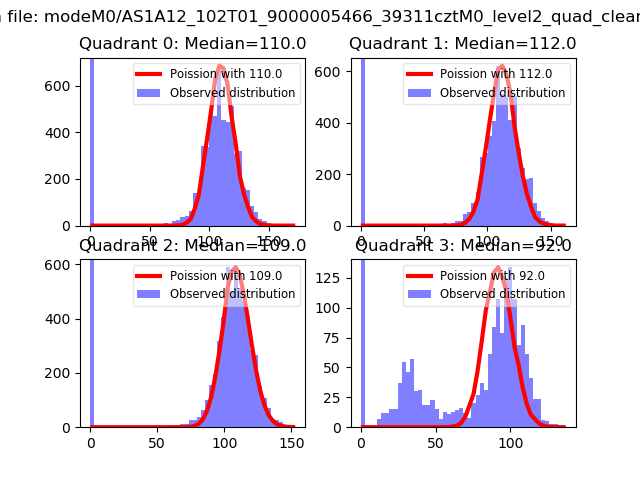 |
 |
| Quadrant-wise count rates Data is divided into 100 sec bins |
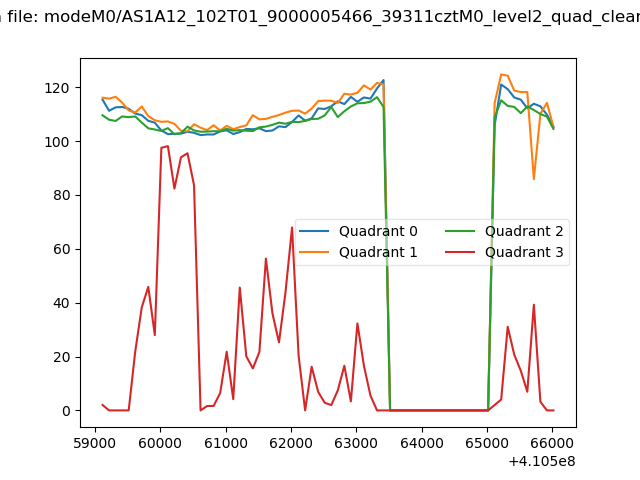 |
|
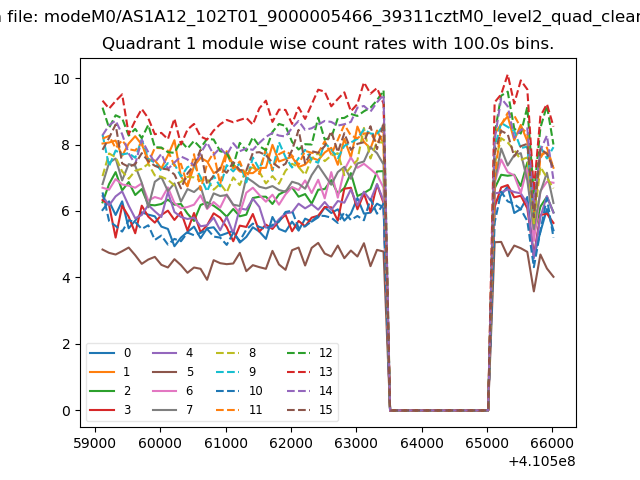
| Module-wise count rates for Quadrant A Data is divided into 100 sec bins |
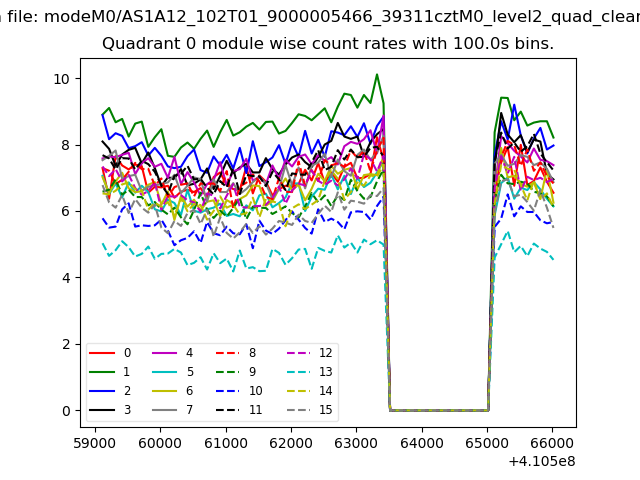 |
 |
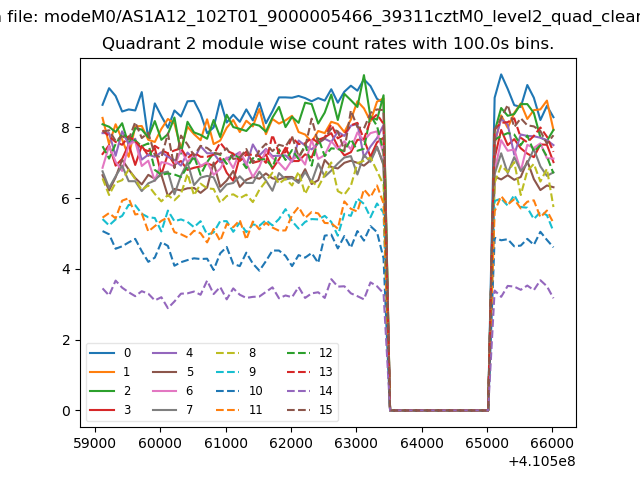
| Module-wise count rates for Quadrant B Data is divided into 100 sec bins |
 |
 |
| Module-wise count rates for Quadrant C Data is divided into 100 sec bins |
 |
 |
| Module-wise count rates for Quadrant D Data is divided into 100 sec bins |
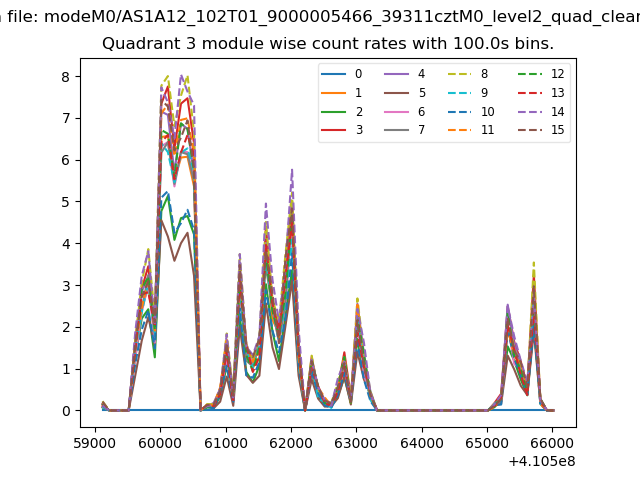 |
 |
| Parameter | Plot |
|---|---|
| CZT HV Monitor | 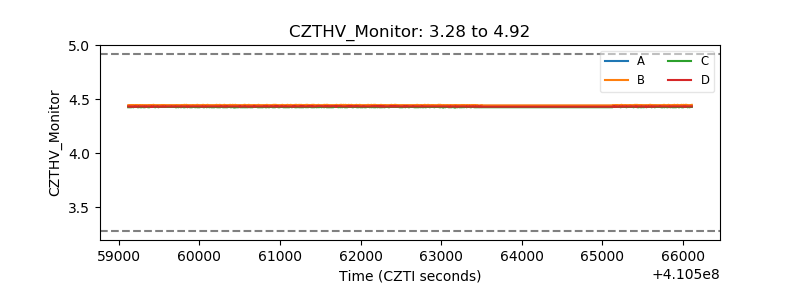 |
| D_VDD | 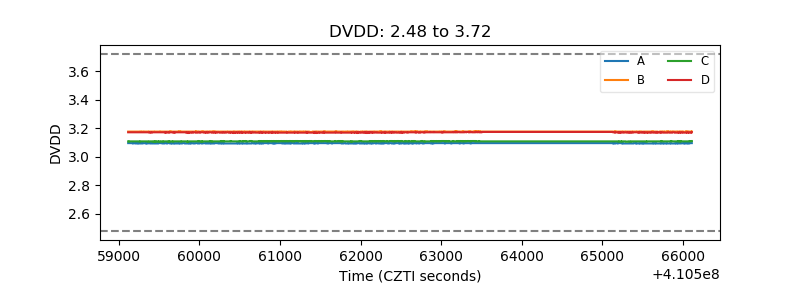 |
| Temperature 1 | 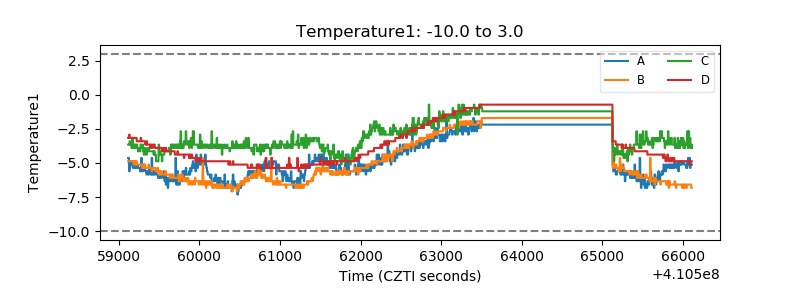 |
| Veto HV Monitor | 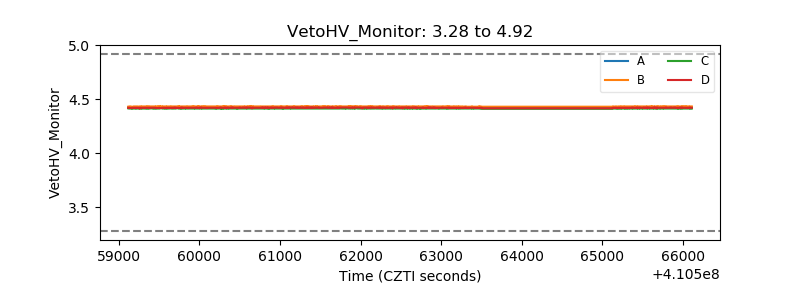 |
| Veto LLD | 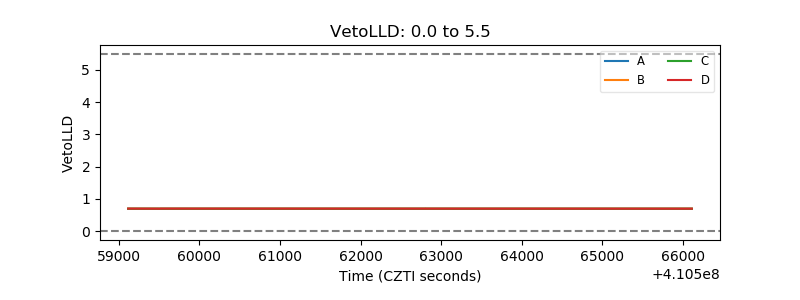 |
| Alpha Counter | 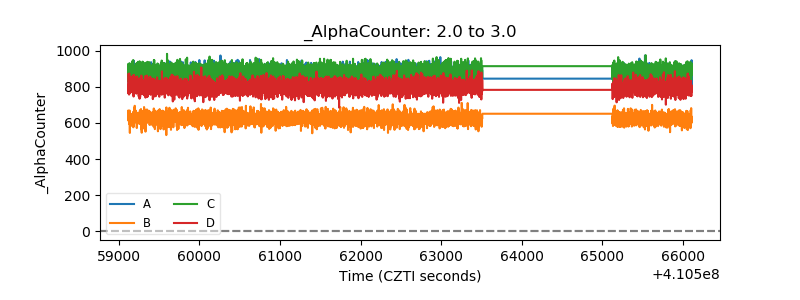 |
| _CPM_Rate |  |
| CZT Counter | 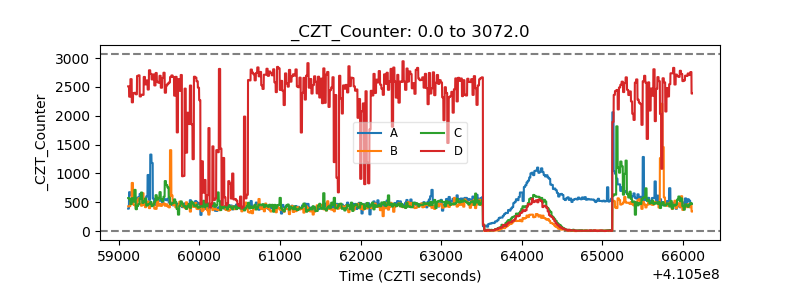 |
| +2.5 Volts monitor | 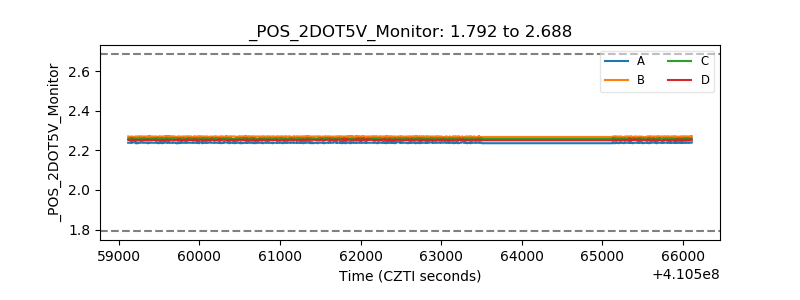 |
| +5 Volts monitor | 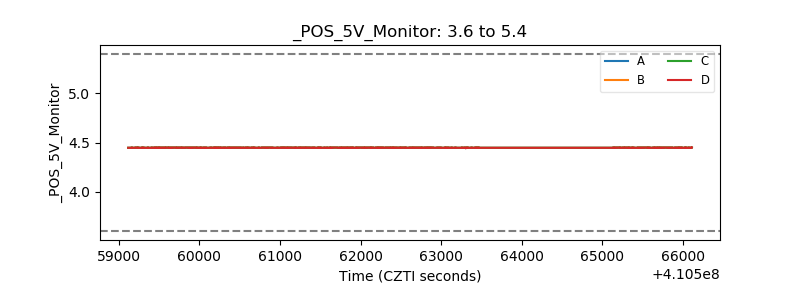 |
| _ROLL_ROT | 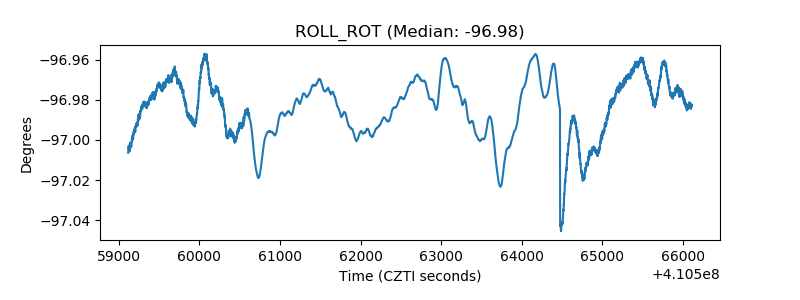 |
| _Roll_DEC | 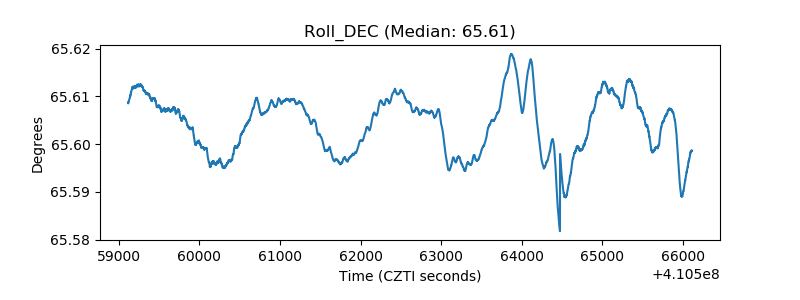 |
| _Roll_RA | 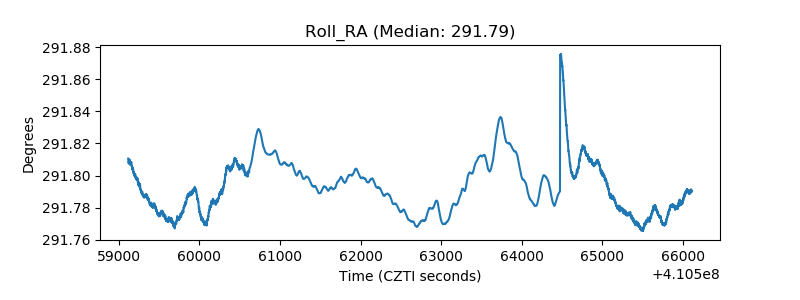 |
| Veto Counter | 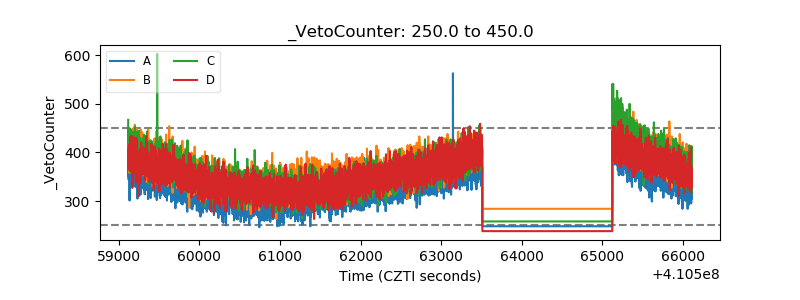 |