| Param | Original file | Final file |
|---|---|---|
| Filename | modeM0/AS1A12_102T01_9000005466_39313cztM0_level2.fits | modeM0/AS1A12_102T01_9000005466_39313cztM0_level2_quad_clean.evt |
| Size (bytes) | 544,740,480 | 81,789,120 |
| Size | 519.5 MB | 78.0 MB |
| Events in quadrant A | 3,014,436 | 613,605 |
| Events in quadrant B | 2,520,681 | 631,449 |
| Events in quadrant C | 2,752,851 | 607,631 |
| Events in quadrant D | 11,448,029 | 238,499 |
| Mode M9 | |||
|---|---|---|---|
| Quadrant | BADHDUFLAG | Total packets | Discarded packets |
| A | 0 | 21 | 0 |
| B | 0 | 21 | 0 |
| C | 0 | 21 | 0 |
| D | 0 | 22 | 0 |
| Mode M0 | |||
|---|---|---|---|
| Quadrant | BADHDUFLAG | Total packets | Discarded packets |
| A | 0 | 12411 | 3 |
| B | 0 | 11447 | 2 |
| C | 0 | 11705 | 2 |
| D | 0 | 37823 | 2 |
| Mode SS | |||
|---|---|---|---|
| Quadrant | BADHDUFLAG | Total packets | Discarded packets |
| A | 0 | 112 | 0 |
| B | 0 | 112 | 0 |
| C | 0 | 112 | 0 |
| D | 0 | 112 | 0 |
| Quadrant | Total seconds | Saturated seconds | Saturation percentage |
|---|---|---|---|
| A | 5505 | 52 | 0.944596% |
| B | 5505 | 43 | 0.781108% |
| C | 5505 | 8 | 0.145322% |
| D | 5505 | 3571 | 64.868302% |
Noise dominated data is calculated using 1-second bins in cleaned event files. If a bin has >2000 counts, and if more than 50% of those come from <1% of pixels, then it is considered to be noise-dominated and hence unusable.
| Quadrant | # 1 sec bins | Bins with >0 counts | Bins with >2000 counts | High rate bins dominated by noise | Noise dominated (total time) | Noise dominated (detector-on time) | Marked lightcurve |
|---|---|---|---|---|---|---|---|
| A | 7238 | 5506 | 36 | 36 | 0.50% | 0.65% | 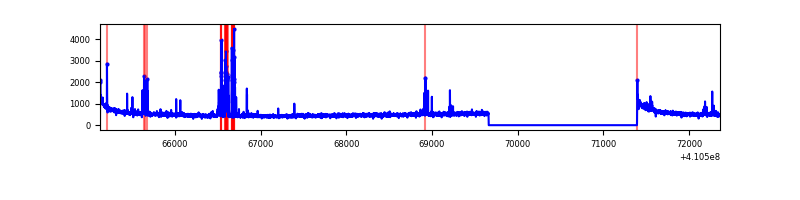 |
| B | 7238 | 5506 | 25 | 25 | 0.35% | 0.45% | 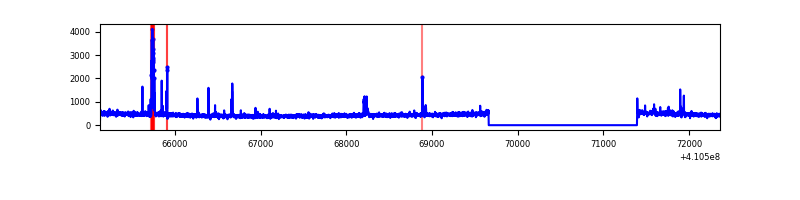 |
| C | 7238 | 5506 | 5 | 5 | 0.07% | 0.09% | 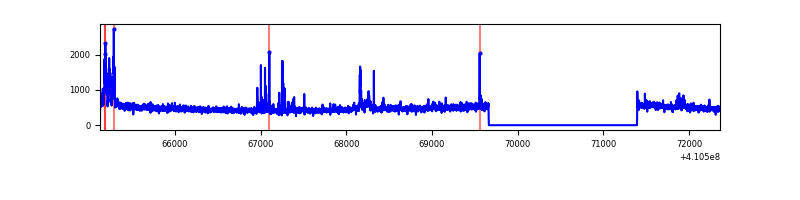 |
| D | 7238 | 5506 | 2983 | 2983 | 41.21% | 54.18% | 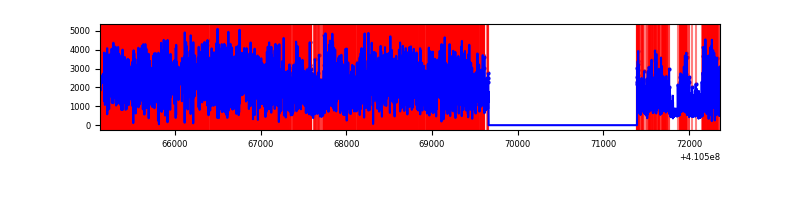 |
Top three noisy pixels from each quadrant. If the there are fewer than three noisy pixels in the level2.evt file, extra rows are filled as -1
| Pixel properties | Quadrant properties | ||||||
|---|---|---|---|---|---|---|---|
| Quadrant | DetID | PixID | Counts | Sigma | Mean | Median | Sigma |
| A | 10 | 83 | 422625 | 3440.51 | 601 | 589 | 122.7 |
| A | 13 | 248 | 233943 | 1902.34 | 601 | 589 | 122.7 |
| A | 15 | 222 | 29404 | 234.91 | 601 | 589 | 122.7 |
| B | 5 | 172 | 118460 | 1015.53 | 602 | 585 | 116.1 |
| B | 5 | 184 | 36844 | 312.38 | 602 | 585 | 116.1 |
| B | 12 | 111 | 14905 | 123.37 | 602 | 585 | 116.1 |
| C | 15 | 214 | 247539 | 1783.16 | 590 | 594 | 138.5 |
| C | 9 | 187 | 153917 | 1107.13 | 590 | 594 | 138.5 |
| C | 14 | 254 | 38887 | 276.51 | 590 | 594 | 138.5 |
| D | 12 | 235 | 8635404 | 87671.55 | 400 | 388 | 98.5 |
| D | 12 | 227 | 716442 | 7270.12 | 400 | 388 | 98.5 |
| D | 13 | 249 | 380250 | 3856.75 | 400 | 388 | 98.5 |
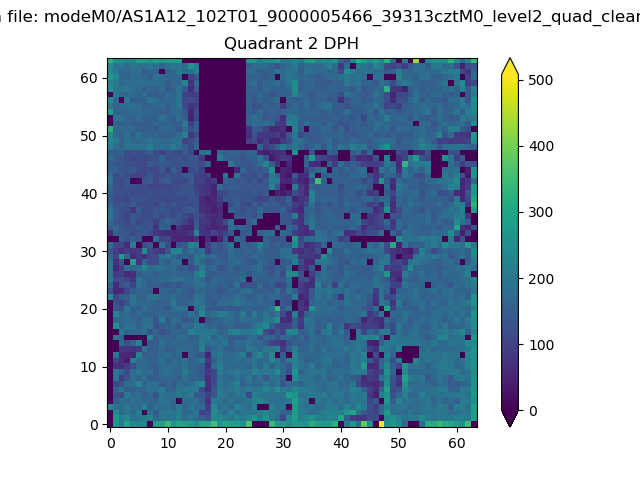
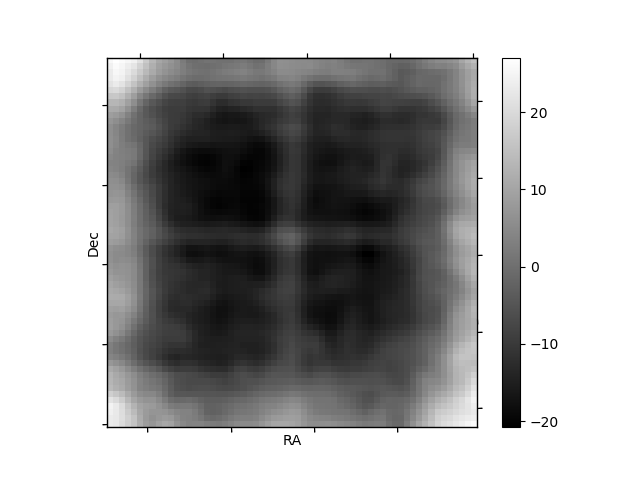
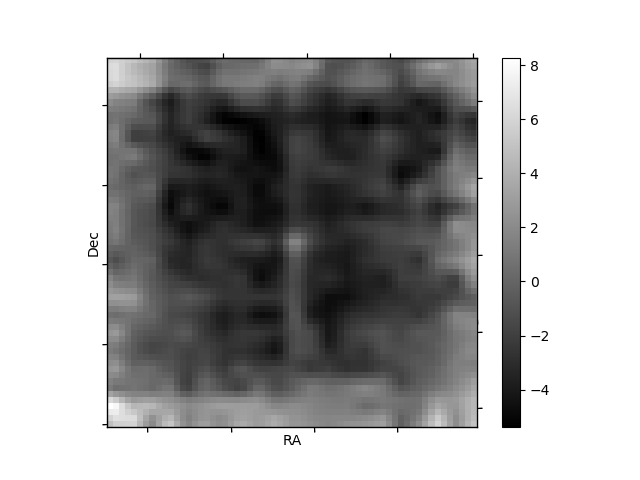
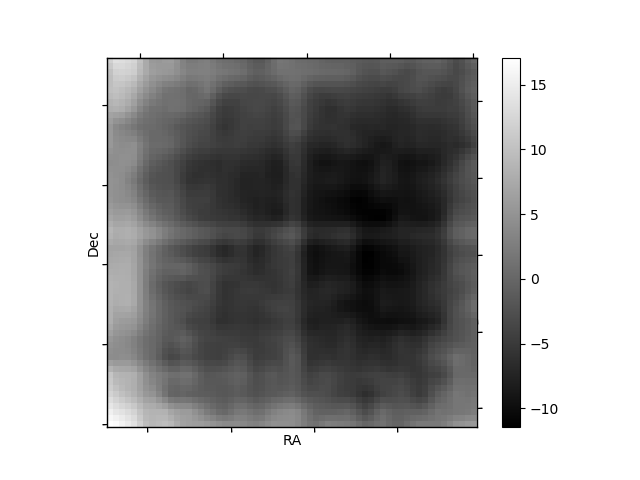
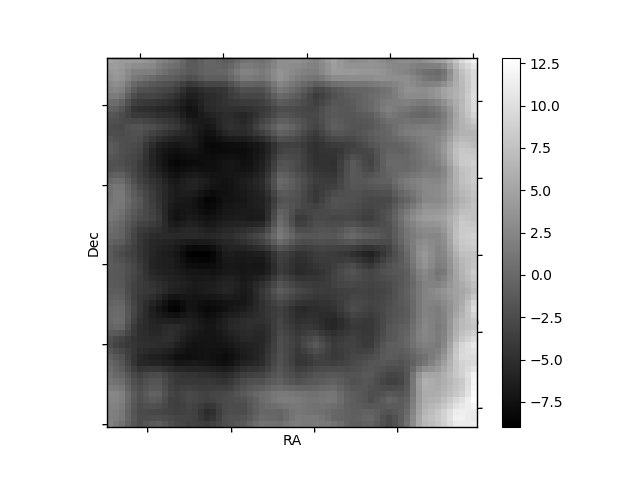
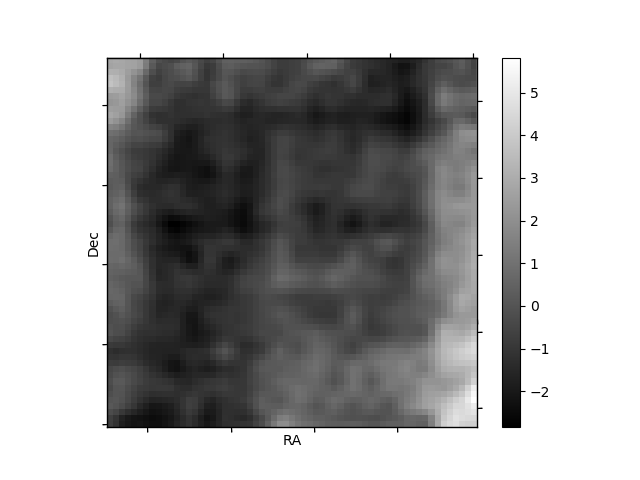
Histogram calculated using DETX and DETY for each event in the final _common_clean file
| Quadrant A | 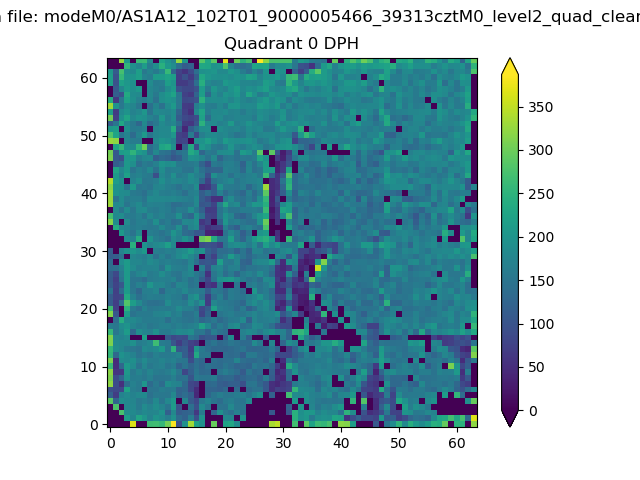 |
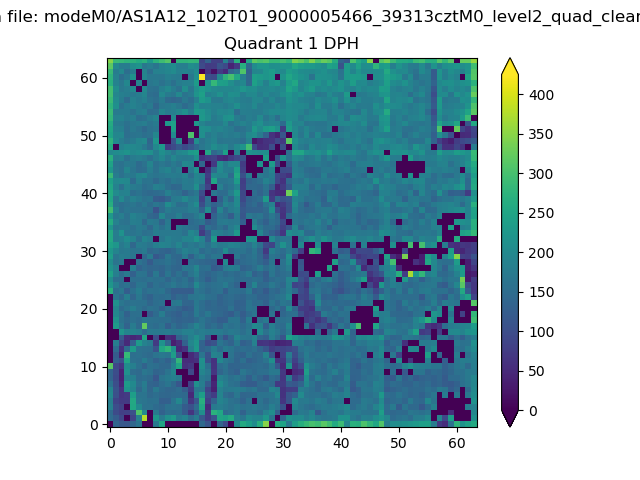 |
Quadrant B |
|---|---|---|---|
| Quadrant D | 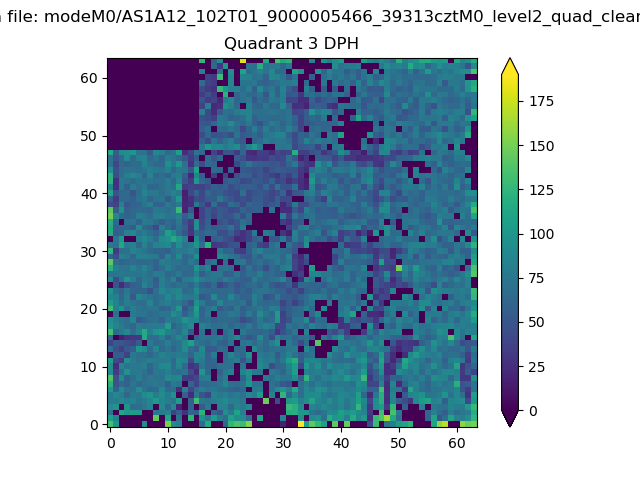 |
 |
Quadrant C |
| Plot type | Count rate plots | Images |
|---|---|---|
| Comparison with Poisson distribution Blue bars denote a histogram of data divided into 1 sec bins. Red curve is a Poisson curve with rate = median count rate of data. |
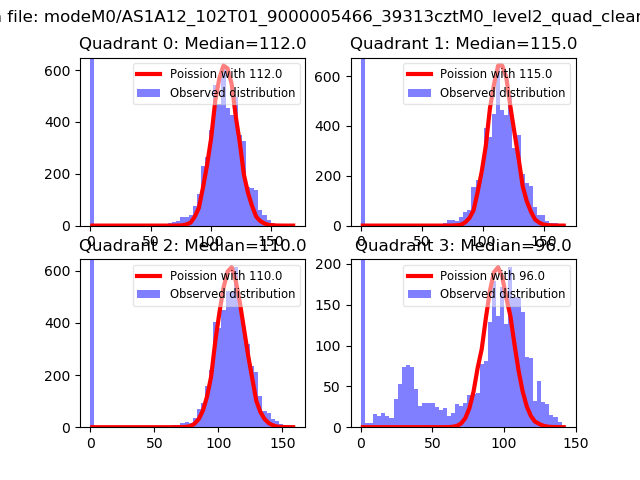 |
 |
| Quadrant-wise count rates Data is divided into 100 sec bins |
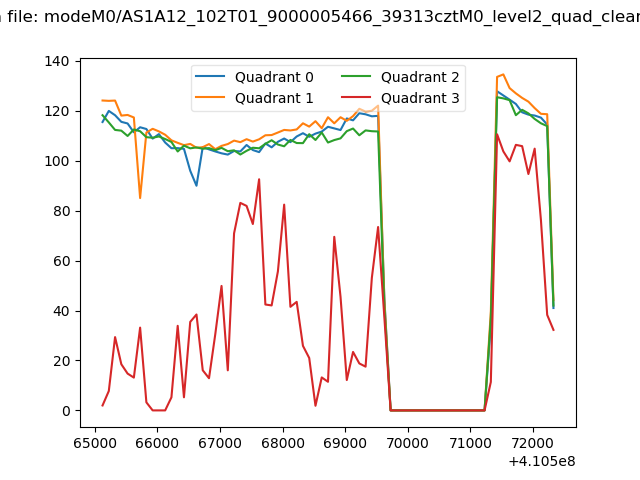 |
|
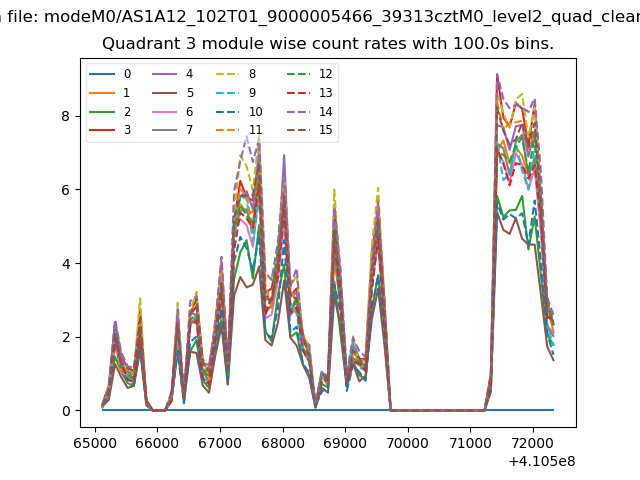
| Module-wise count rates for Quadrant A Data is divided into 100 sec bins |
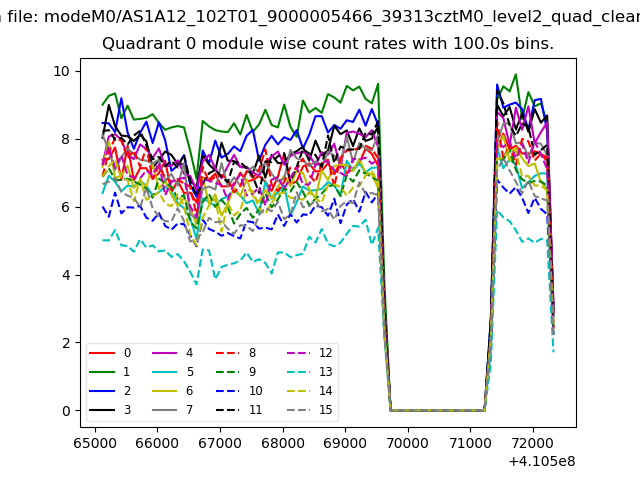 |
 |
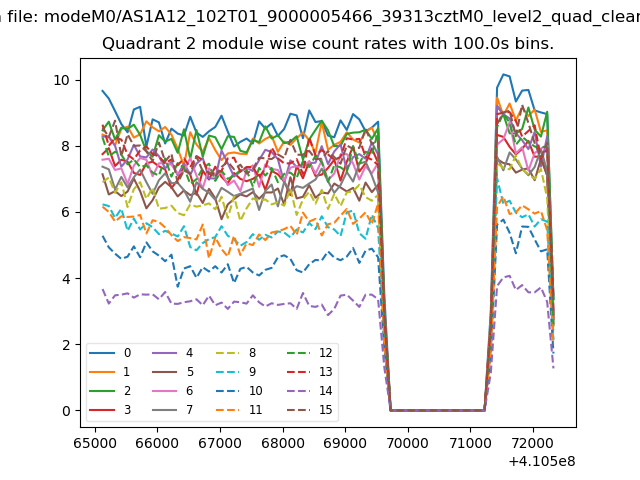
| Module-wise count rates for Quadrant B Data is divided into 100 sec bins |
 |
 |
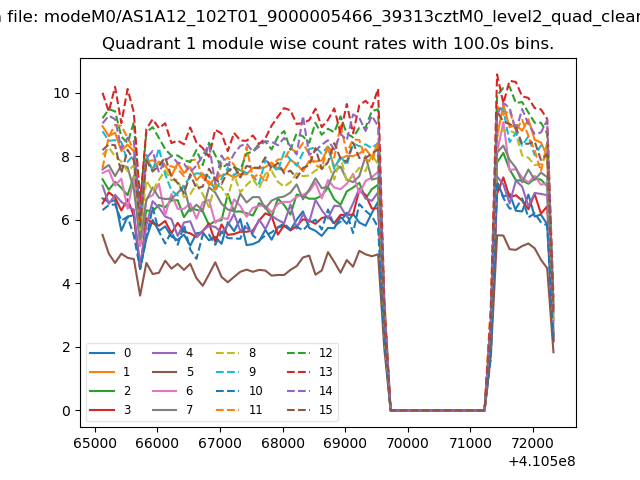
| Module-wise count rates for Quadrant C Data is divided into 100 sec bins |
 |
 |
| Module-wise count rates for Quadrant D Data is divided into 100 sec bins |
 |
 |
| Parameter | Plot |
|---|---|
| CZT HV Monitor |  |
| D_VDD |  |
| Temperature 1 | 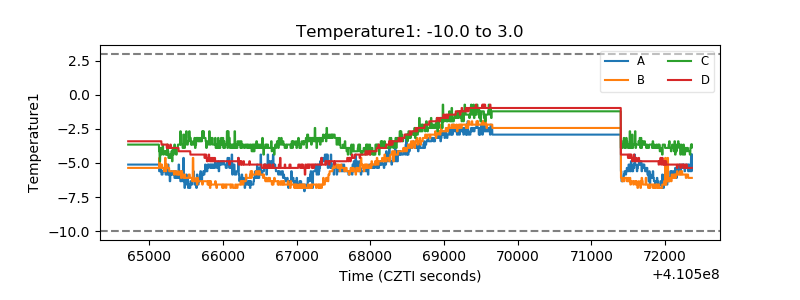 |
| Veto HV Monitor | 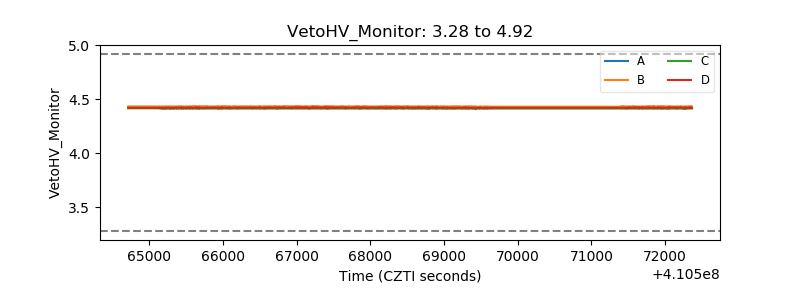 |
| Veto LLD | 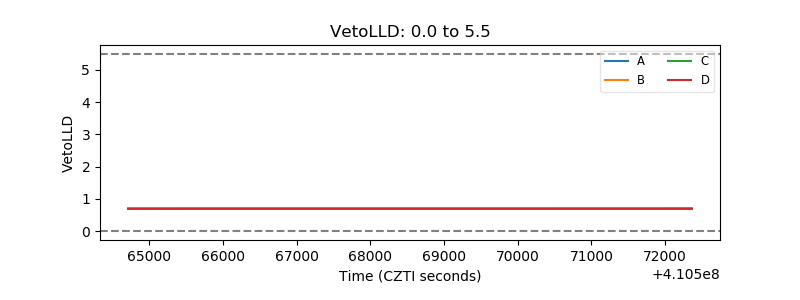 |
| Alpha Counter | 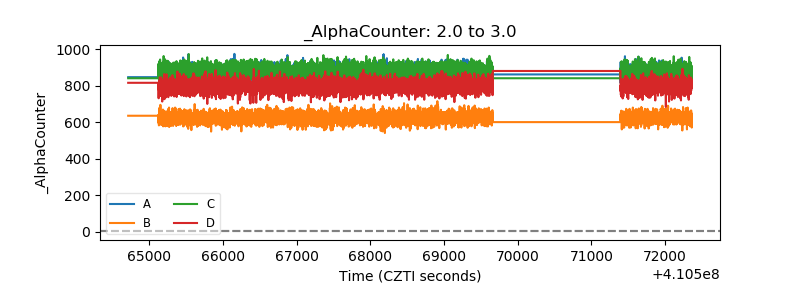 |
| _CPM_Rate | 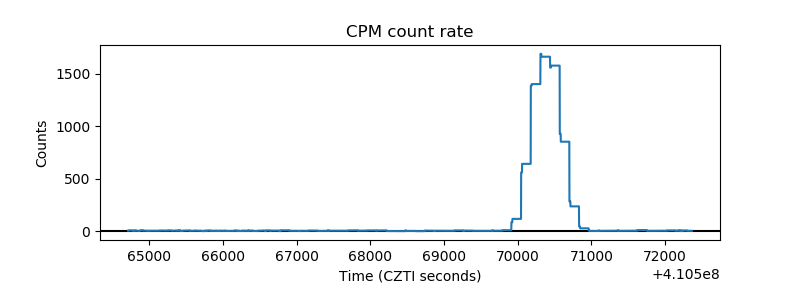 |
| CZT Counter | 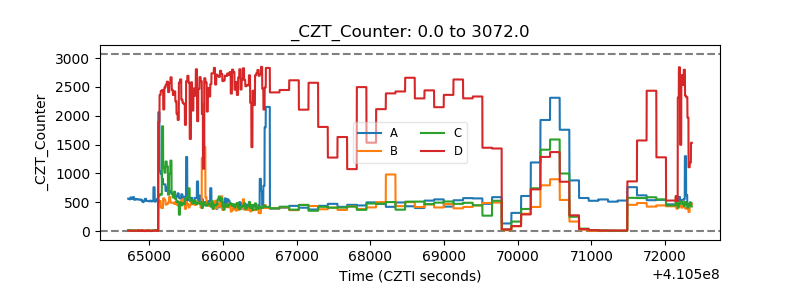 |
| +2.5 Volts monitor | 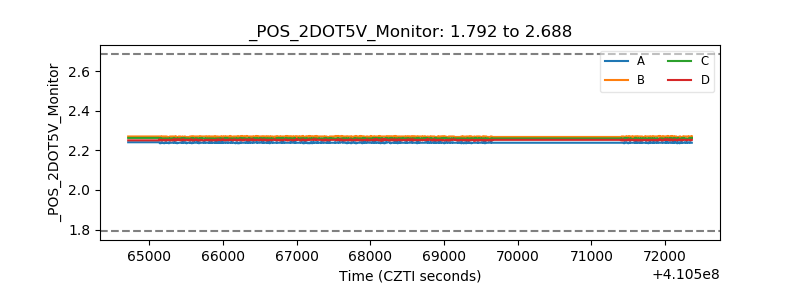 |
| +5 Volts monitor | 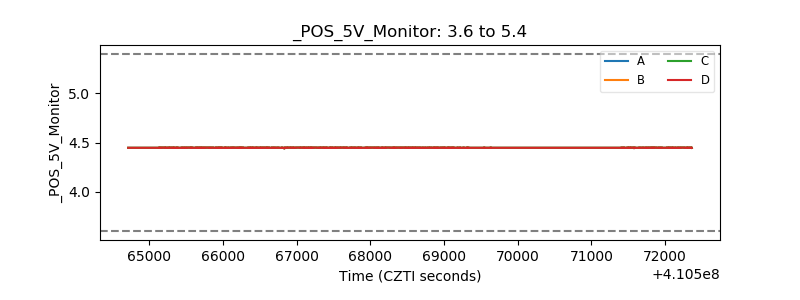 |
| _ROLL_ROT | 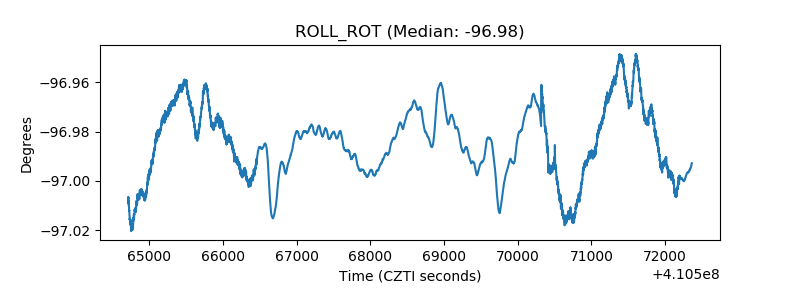 |
| _Roll_DEC | 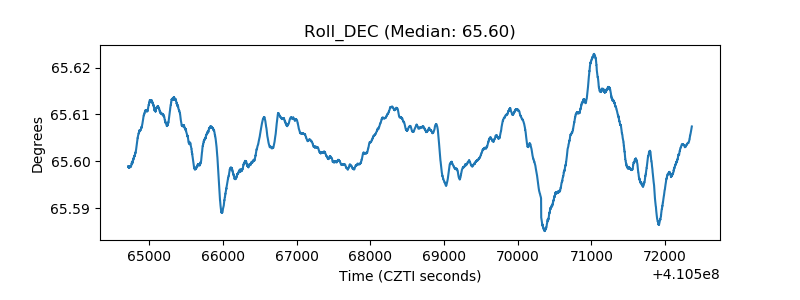 |
| _Roll_RA | 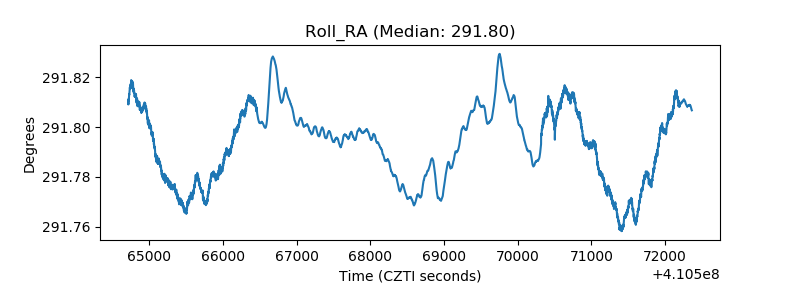 |
| Veto Counter | 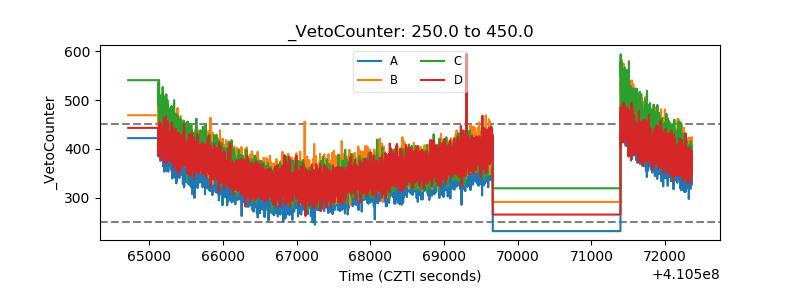 |