| Param | Original file | Final file |
|---|---|---|
| Filename | modeM0/AS1A12_102T01_9000005466_39314cztM0_level2.fits | modeM0/AS1A12_102T01_9000005466_39314cztM0_level2_quad_clean.evt |
| Size (bytes) | 367,752,960 | 71,565,120 |
| Size | 350.7 MB | 68.2 MB |
| Events in quadrant A | 2,302,168 | 502,506 |
| Events in quadrant B | 2,371,393 | 506,751 |
| Events in quadrant C | 2,207,900 | 492,290 |
| Events in quadrant D | 6,389,726 | 356,735 |
| Mode M9 | |||
|---|---|---|---|
| Quadrant | BADHDUFLAG | Total packets | Discarded packets |
| A | 0 | 4 | 0 |
| B | 0 | 4 | 0 |
| C | 0 | 4 | 0 |
| D | 0 | 5 | 0 |
| Mode M0 | |||
|---|---|---|---|
| Quadrant | BADHDUFLAG | Total packets | Discarded packets |
| A | 0 | 9561 | 1 |
| B | 0 | 10096 | 1 |
| C | 0 | 9362 | 1 |
| D | 0 | 22047 | 1 |
| Mode SS | |||
|---|---|---|---|
| Quadrant | BADHDUFLAG | Total packets | Discarded packets |
| A | 0 | 90 | 0 |
| B | 0 | 90 | 0 |
| C | 0 | 90 | 0 |
| D | 0 | 90 | 0 |
| Quadrant | Total seconds | Saturated seconds | Saturation percentage |
|---|---|---|---|
| A | 4387 | 14 | 0.319125% |
| B | 4387 | 123 | 2.803738% |
| C | 4387 | 37 | 0.843401% |
| D | 4387 | 1232 | 28.082972% |
Noise dominated data is calculated using 1-second bins in cleaned event files. If a bin has >2000 counts, and if more than 50% of those come from <1% of pixels, then it is considered to be noise-dominated and hence unusable.
| Quadrant | # 1 sec bins | Bins with >0 counts | Bins with >2000 counts | High rate bins dominated by noise | Noise dominated (total time) | Noise dominated (detector-on time) | Marked lightcurve |
|---|---|---|---|---|---|---|---|
| A | 4387 | 4387 | 6 | 6 | 0.14% | 0.14% | 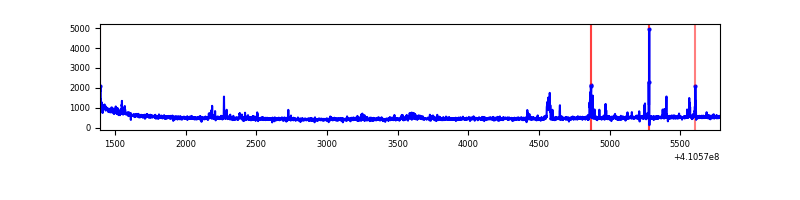 |
| B | 4387 | 4387 | 108 | 108 | 2.46% | 2.46% | 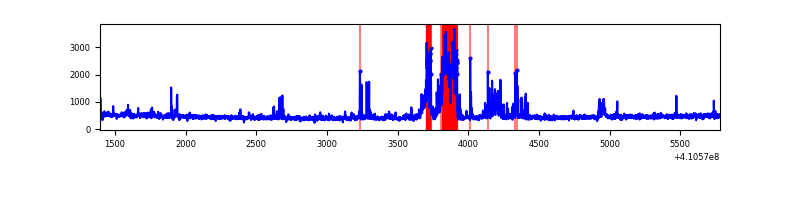 |
| C | 4387 | 4387 | 31 | 31 | 0.71% | 0.71% | 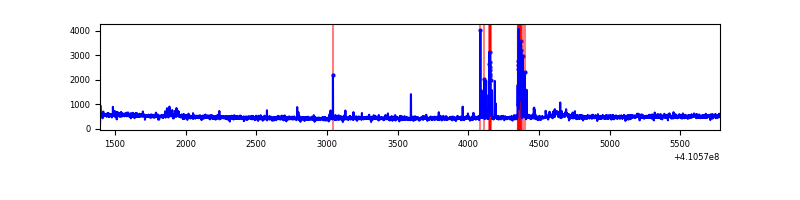 |
| D | 4386 | 4386 | 1059 | 1059 | 24.15% | 24.15% | 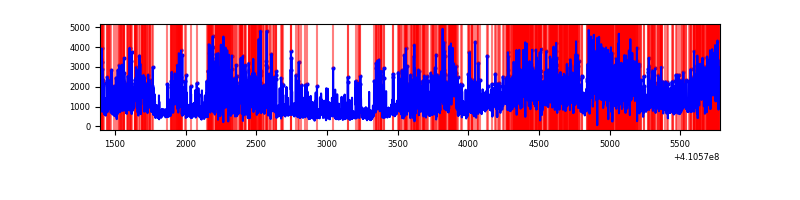 |
Top three noisy pixels from each quadrant. If the there are fewer than three noisy pixels in the level2.evt file, extra rows are filled as -1
| Pixel properties | Quadrant properties | ||||||
|---|---|---|---|---|---|---|---|
| Quadrant | DetID | PixID | Counts | Sigma | Mean | Median | Sigma |
| A | 10 | 83 | 287693 | 2908.47 | 481 | 470 | 98.8 |
| A | 13 | 248 | 92248 | 929.36 | 481 | 470 | 98.8 |
| A | 15 | 222 | 37926 | 379.29 | 481 | 470 | 98.8 |
| B | 5 | 172 | 487400 | 5327.72 | 475 | 463 | 91.4 |
| B | 12 | 111 | 11527 | 121.05 | 475 | 463 | 91.4 |
| B | 11 | 111 | 10481 | 109.61 | 475 | 463 | 91.4 |
| C | 15 | 214 | 193854 | 1771.03 | 468 | 471 | 109.2 |
| C | 14 | 254 | 143780 | 1312.44 | 468 | 471 | 109.2 |
| C | 9 | 187 | 35385 | 319.75 | 468 | 471 | 109.2 |
| D | 12 | 235 | 3854829 | 38385.15 | 412 | 399 | 100.4 |
| D | 12 | 227 | 395086 | 3930.57 | 412 | 399 | 100.4 |
| D | 13 | 249 | 379893 | 3779.27 | 412 | 399 | 100.4 |
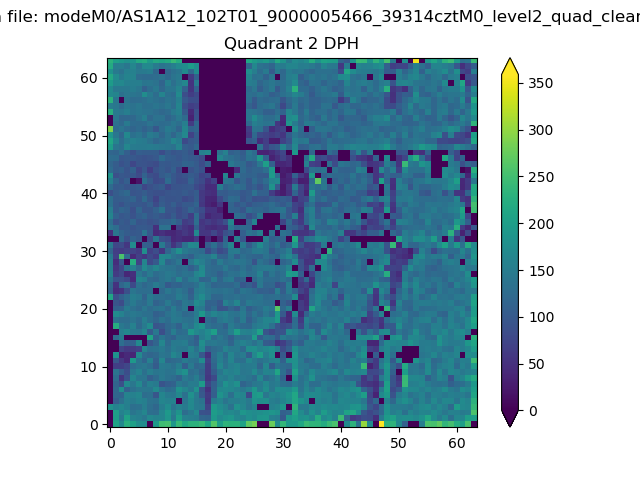
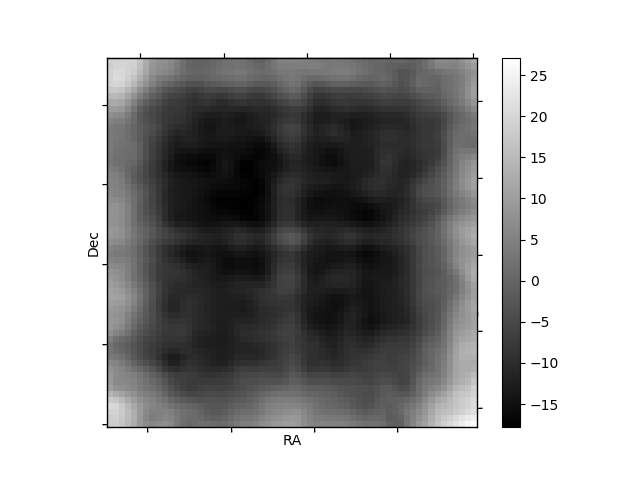
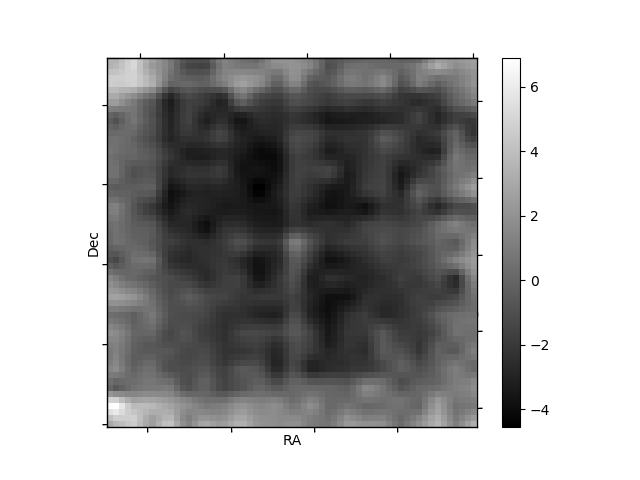
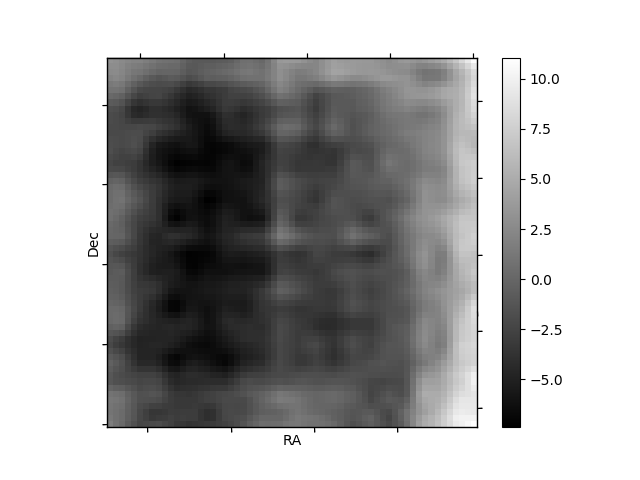
Histogram calculated using DETX and DETY for each event in the final _common_clean file
| Quadrant A | 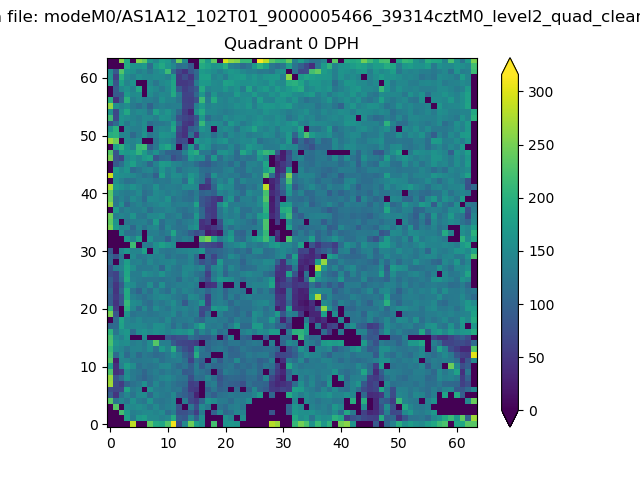 |
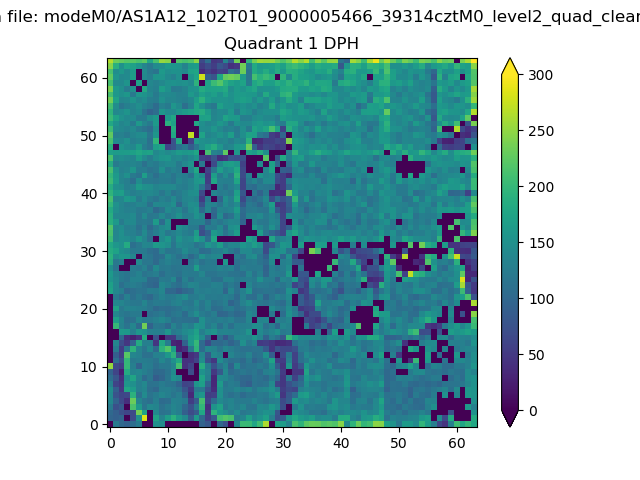 |
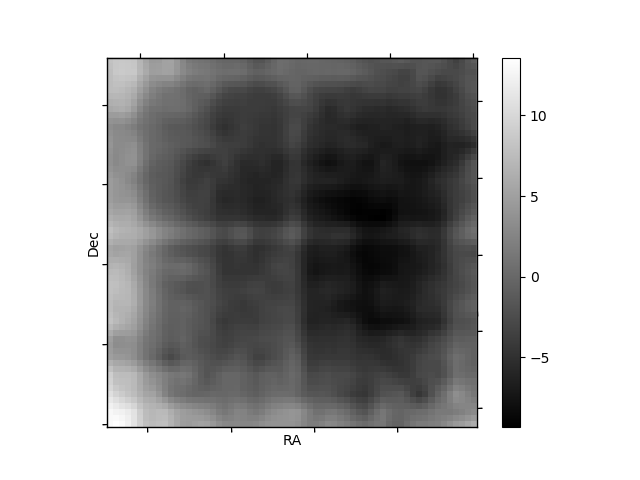
Quadrant B |
|---|---|---|---|
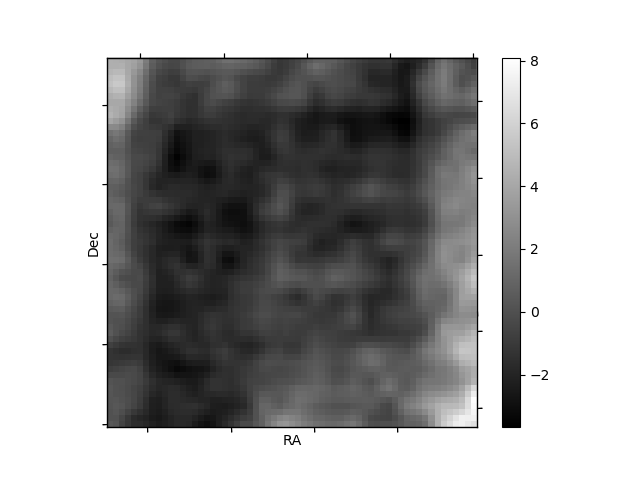
| Quadrant D | 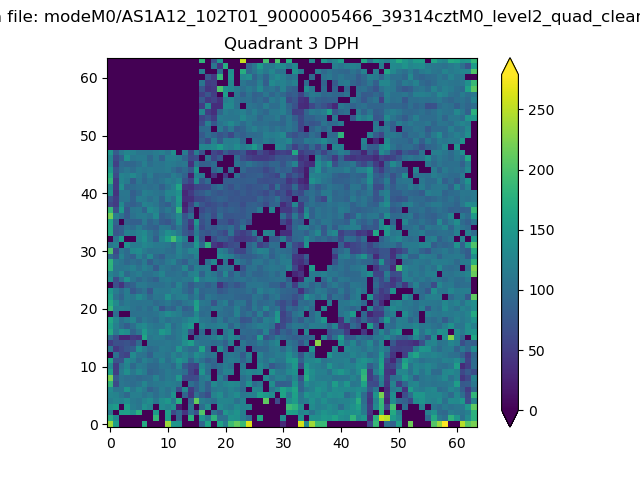 |
 |
Quadrant C |
| Plot type | Count rate plots | Images |
|---|---|---|
| Comparison with Poisson distribution Blue bars denote a histogram of data divided into 1 sec bins. Red curve is a Poisson curve with rate = median count rate of data. |
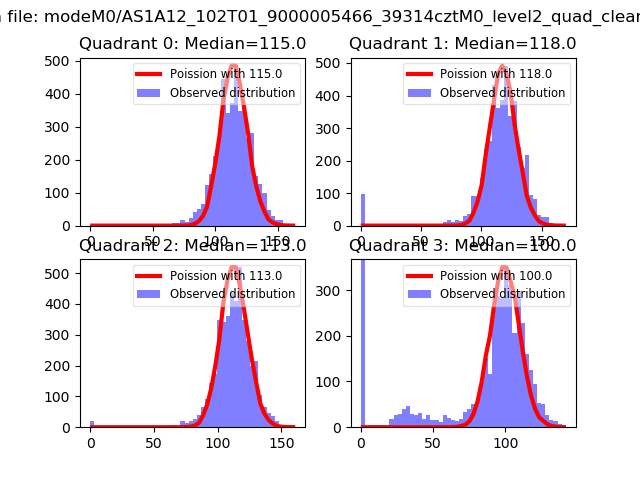 |
 |
| Quadrant-wise count rates Data is divided into 100 sec bins |
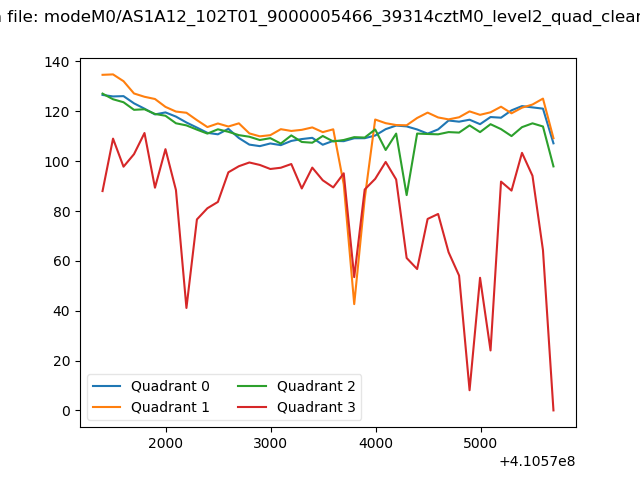 |
|
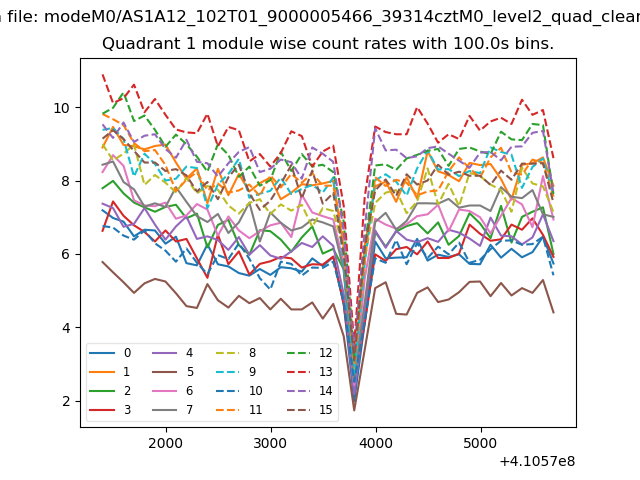
| Module-wise count rates for Quadrant A Data is divided into 100 sec bins |
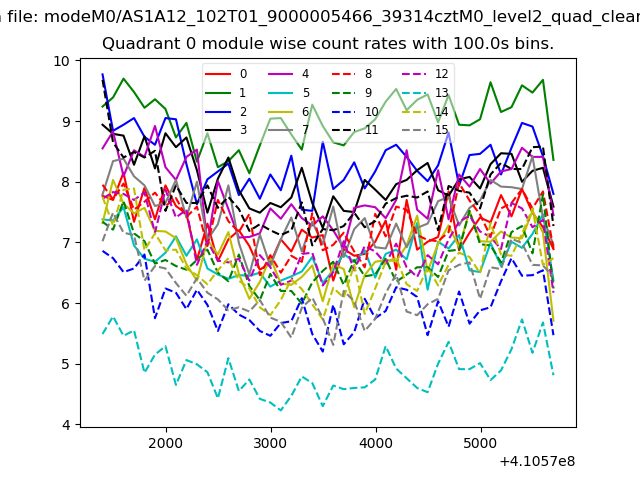 |
 |
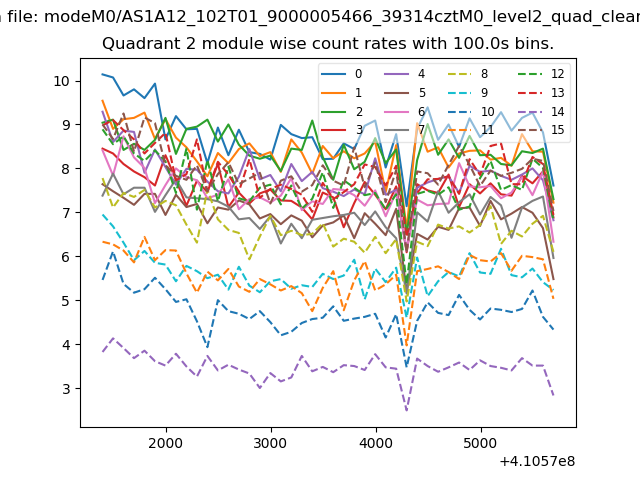
| Module-wise count rates for Quadrant B Data is divided into 100 sec bins |
 |
 |
| Module-wise count rates for Quadrant C Data is divided into 100 sec bins |
 |
 |
| Module-wise count rates for Quadrant D Data is divided into 100 sec bins |
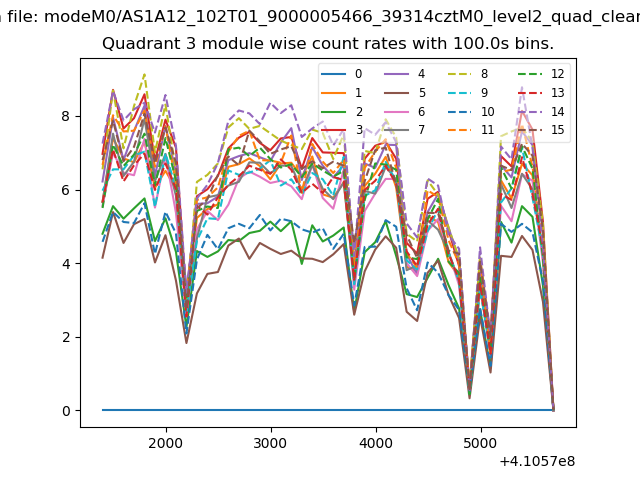 |
 |
| Parameter | Plot |
|---|---|
| CZT HV Monitor | 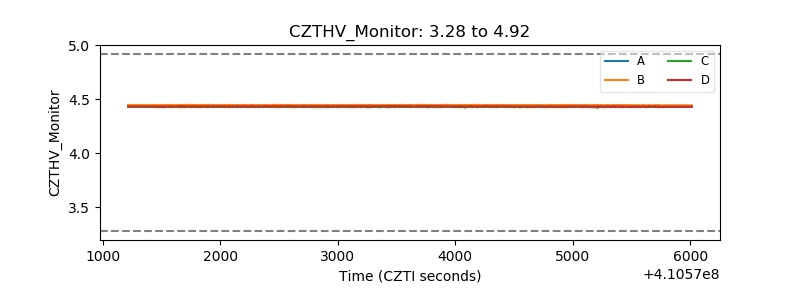 |
| D_VDD | 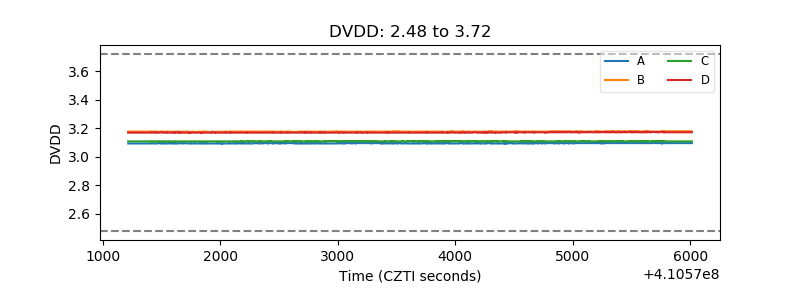 |
| Temperature 1 | 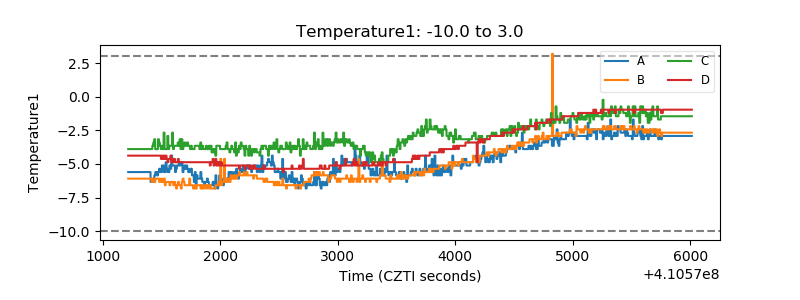 |
| Veto HV Monitor | 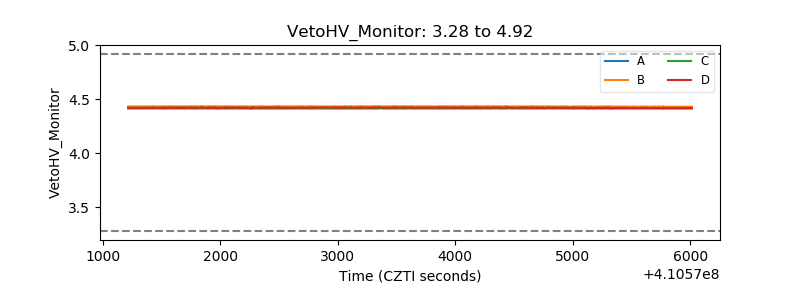 |
| Veto LLD | 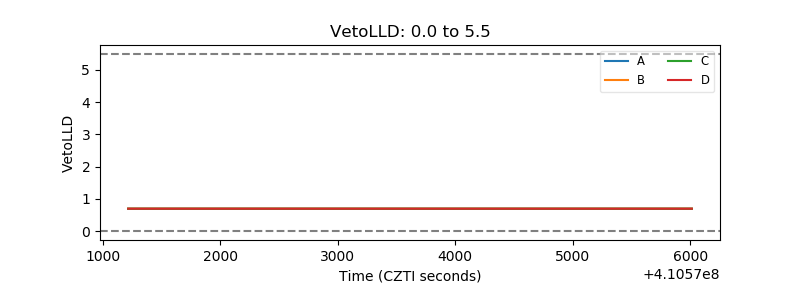 |
| Alpha Counter | 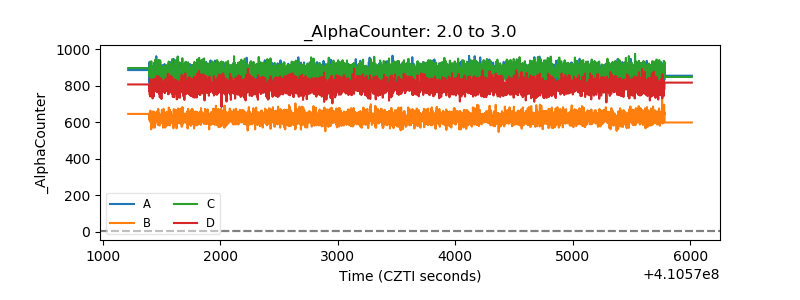 |
| _CPM_Rate | 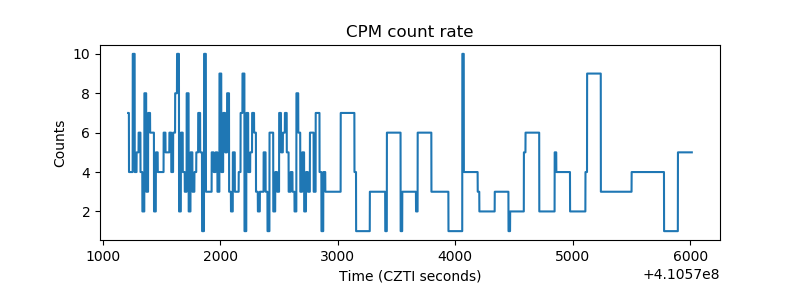 |
| CZT Counter | 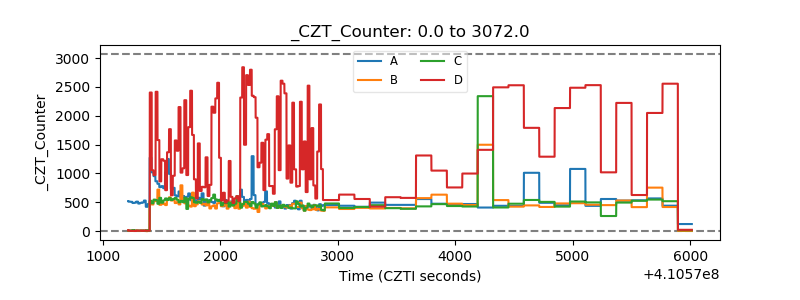 |
| +2.5 Volts monitor | 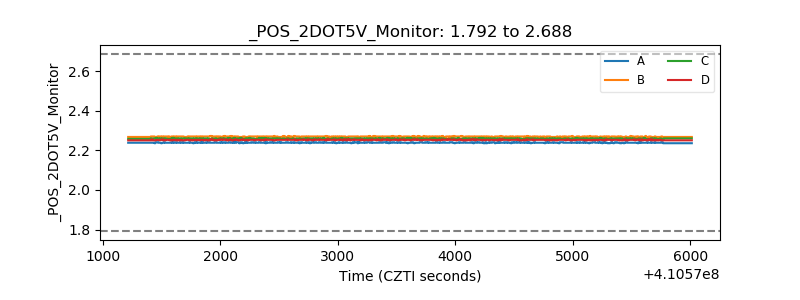 |
| +5 Volts monitor | 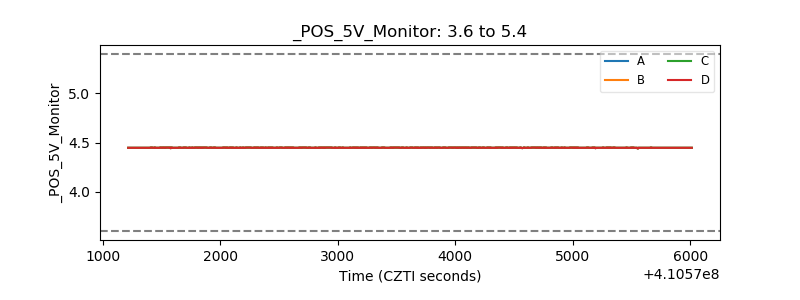 |
| _ROLL_ROT | 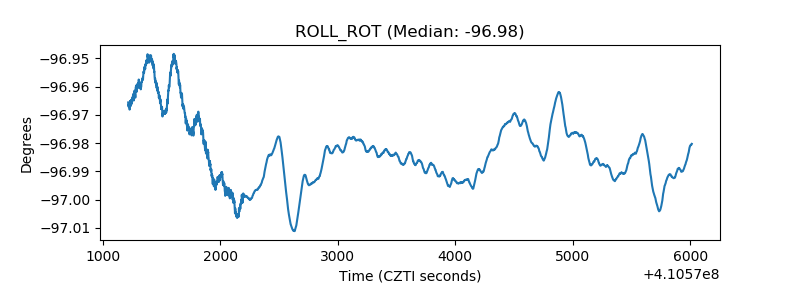 |
| _Roll_DEC | 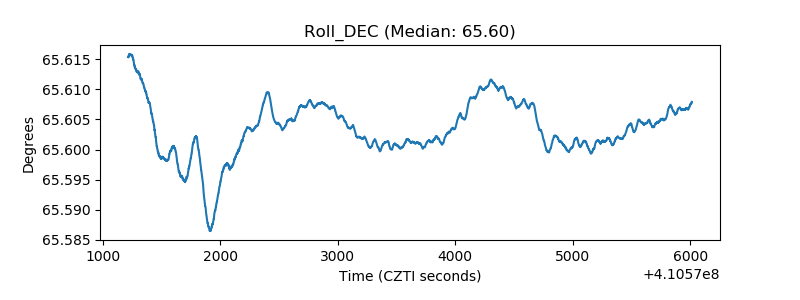 |
| _Roll_RA | 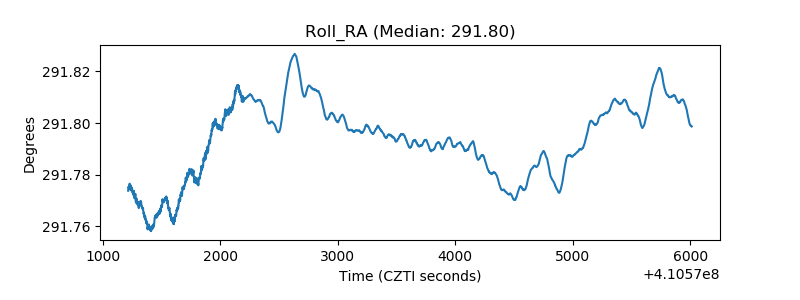 |
| Veto Counter | 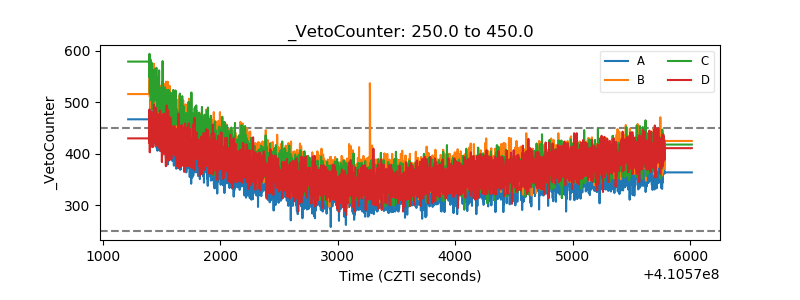 |