| Param | Original file | Final file |
|---|---|---|
| Filename | modeM0/AS1A12_102T01_9000005466_39317cztM0_level2.fits | modeM0/AS1A12_102T01_9000005466_39317cztM0_level2_quad_clean.evt |
| Size (bytes) | 1,268,795,520 | 195,995,520 |
| Size | 1.2 GB | 186.9 MB |
| Events in quadrant A | 6,814,193 | 1,470,249 |
| Events in quadrant B | 6,349,394 | 1,489,044 |
| Events in quadrant C | 6,506,597 | 1,438,350 |
| Events in quadrant D | 26,264,474 | 616,648 |
| Mode M9 | |||
|---|---|---|---|
| Quadrant | BADHDUFLAG | Total packets | Discarded packets |
| A | 0 | 37 | 0 |
| B | 0 | 37 | 0 |
| C | 0 | 37 | 0 |
| D | 0 | 37 | 0 |
| Mode M0 | |||
|---|---|---|---|
| Quadrant | BADHDUFLAG | Total packets | Discarded packets |
| A | 0 | 28649 | 2 |
| B | 0 | 28505 | 2 |
| C | 0 | 28036 | 2 |
| D | 0 | 87235 | 2 |
| Mode SS | |||
|---|---|---|---|
| Quadrant | BADHDUFLAG | Total packets | Discarded packets |
| A | 0 | 270 | 0 |
| B | 0 | 270 | 0 |
| C | 0 | 270 | 0 |
| D | 0 | 270 | 0 |
| Quadrant | Total seconds | Saturated seconds | Saturation percentage |
|---|---|---|---|
| A | 13321 | 67 | 0.502965% |
| B | 13321 | 174 | 1.306208% |
| C | 13321 | 44 | 0.330306% |
| D | 13321 | 7933 | 59.552586% |
Noise dominated data is calculated using 1-second bins in cleaned event files. If a bin has >2000 counts, and if more than 50% of those come from <1% of pixels, then it is considered to be noise-dominated and hence unusable.
| Quadrant | # 1 sec bins | Bins with >0 counts | Bins with >2000 counts | High rate bins dominated by noise | Noise dominated (total time) | Noise dominated (detector-on time) | Marked lightcurve |
|---|---|---|---|---|---|---|---|
| A | 16667 | 13323 | 41 | 41 | 0.25% | 0.31% | 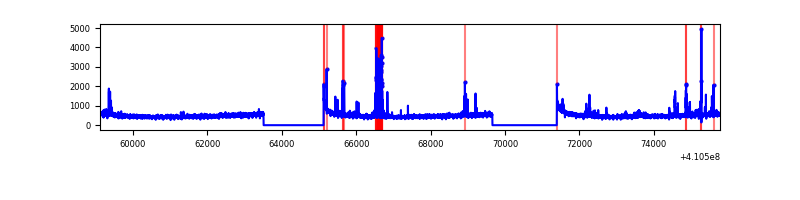 |
| B | 16667 | 13323 | 137 | 137 | 0.82% | 1.03% | 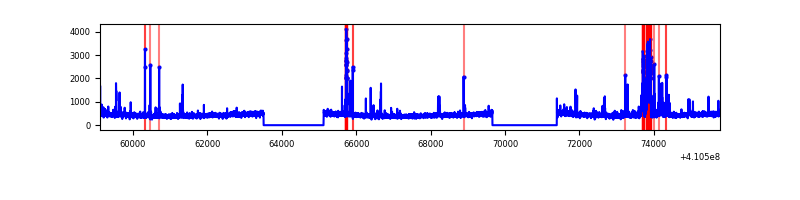 |
| C | 16667 | 13323 | 36 | 36 | 0.22% | 0.27% | 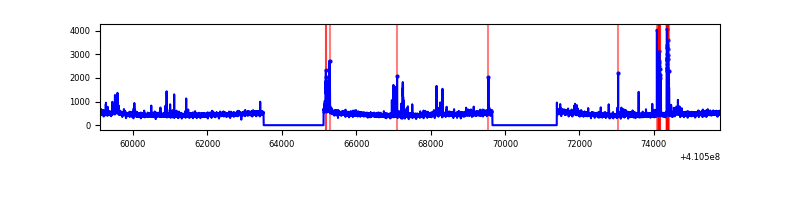 |
| D | 16666 | 13321 | 6640 | 6640 | 39.84% | 49.85% | 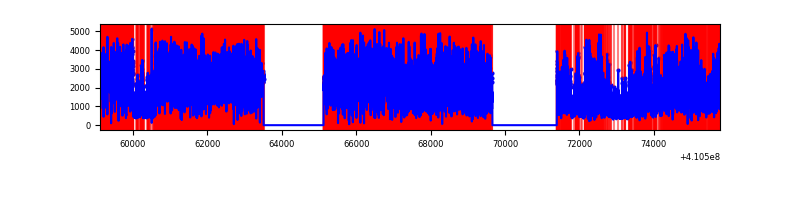 |
Top three noisy pixels from each quadrant. If the there are fewer than three noisy pixels in the level2.evt file, extra rows are filled as -1
| Pixel properties | Quadrant properties | ||||||
|---|---|---|---|---|---|---|---|
| Quadrant | DetID | PixID | Counts | Sigma | Mean | Median | Sigma |
| A | 10 | 83 | 805415 | 2766.47 | 1442 | 1414 | 290.6 |
| A | 13 | 248 | 321749 | 1102.23 | 1442 | 1414 | 290.6 |
| A | 15 | 222 | 86065 | 291.27 | 1442 | 1414 | 290.6 |
| B | 5 | 172 | 623768 | 2282.35 | 1432 | 1391 | 272.7 |
| B | 5 | 184 | 54310 | 194.06 | 1432 | 1391 | 272.7 |
| B | 5 | 255 | 36742 | 129.64 | 1432 | 1391 | 272.7 |
| C | 15 | 214 | 583794 | 1789.65 | 1404 | 1412 | 325.4 |
| C | 9 | 187 | 222729 | 680.1 | 1404 | 1412 | 325.4 |
| C | 14 | 254 | 186633 | 569.18 | 1404 | 1412 | 325.4 |
| D | 12 | 235 | 19961220 | 82798.37 | 989 | 960 | 241.1 |
| D | 12 | 227 | 1120890 | 4645.65 | 989 | 960 | 241.1 |
| D | 13 | 249 | 823266 | 3411.06 | 989 | 960 | 241.1 |
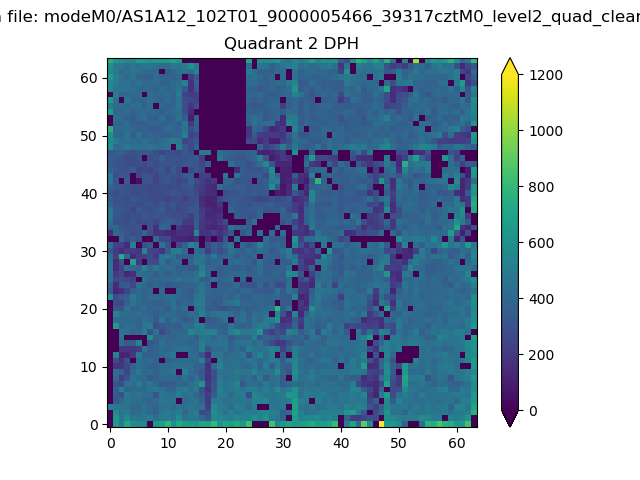
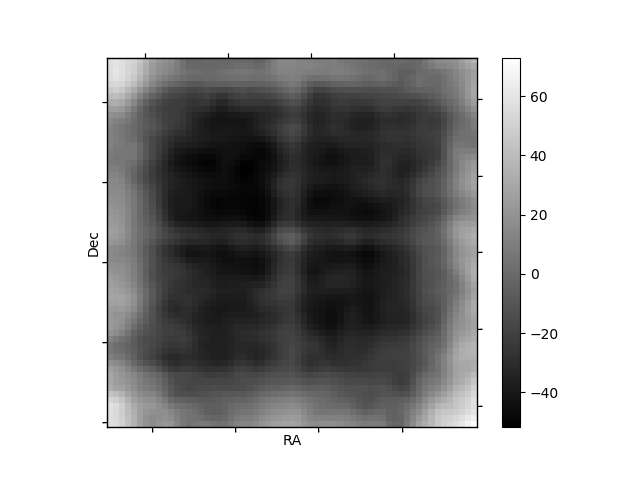
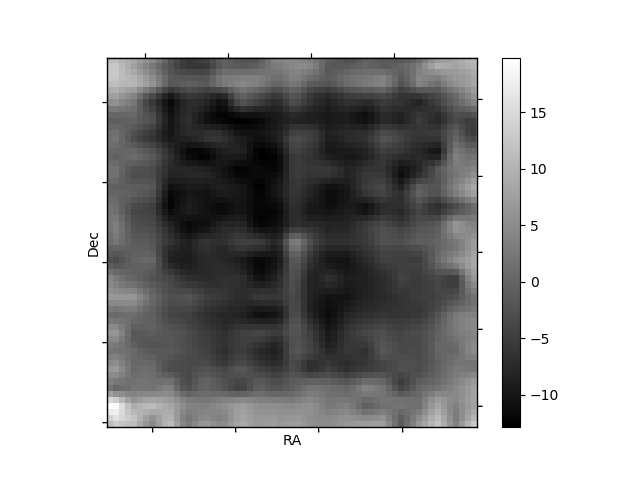
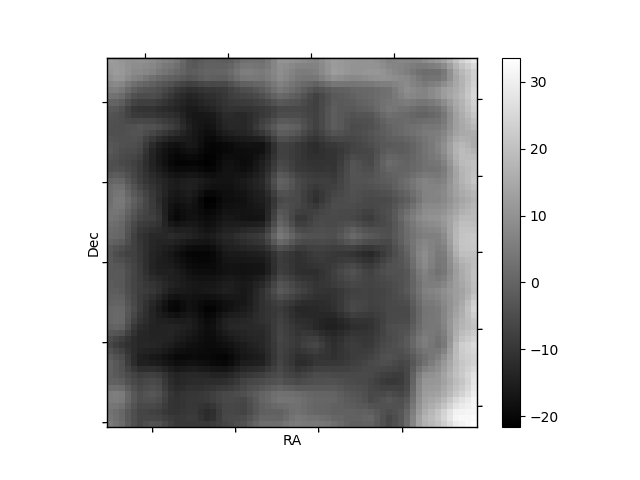
Histogram calculated using DETX and DETY for each event in the final _common_clean file
| Quadrant A | 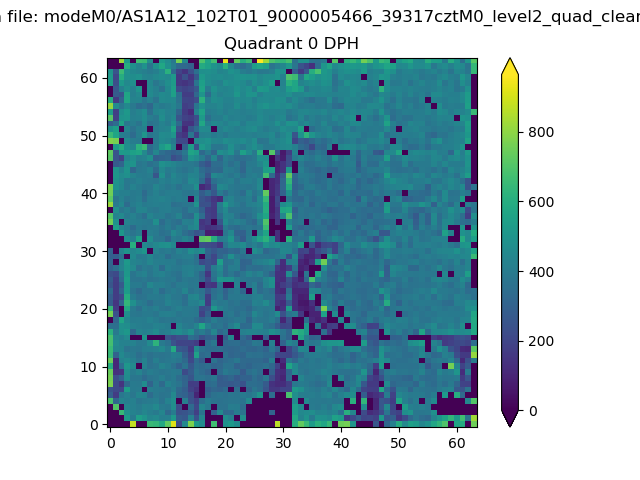 |
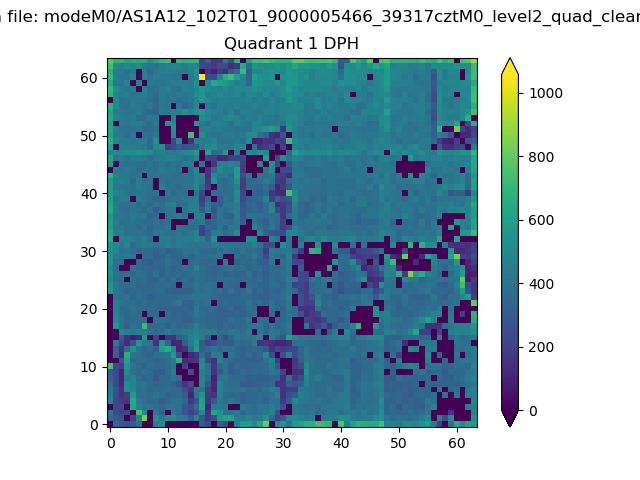 |
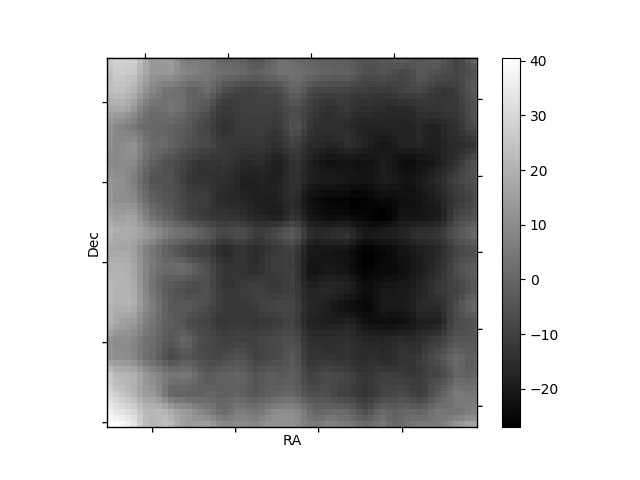
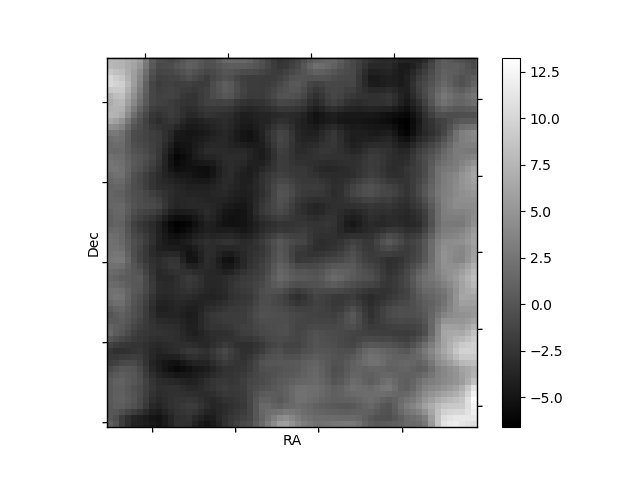
Quadrant B |
|---|---|---|---|
| Quadrant D | 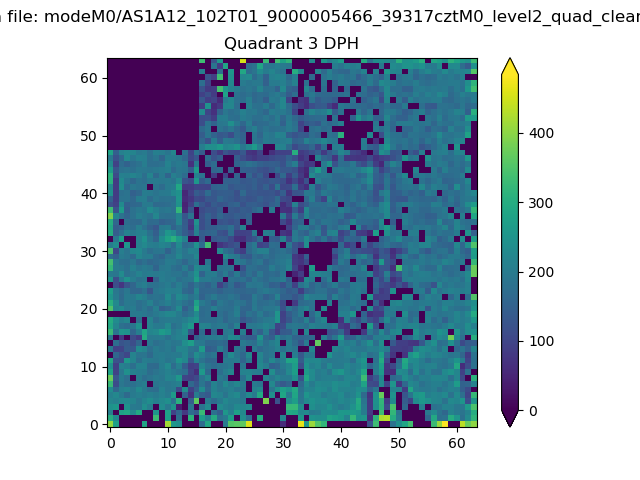 |
 |
Quadrant C |
| Plot type | Count rate plots | Images |
|---|---|---|
| Comparison with Poisson distribution Blue bars denote a histogram of data divided into 1 sec bins. Red curve is a Poisson curve with rate = median count rate of data. |
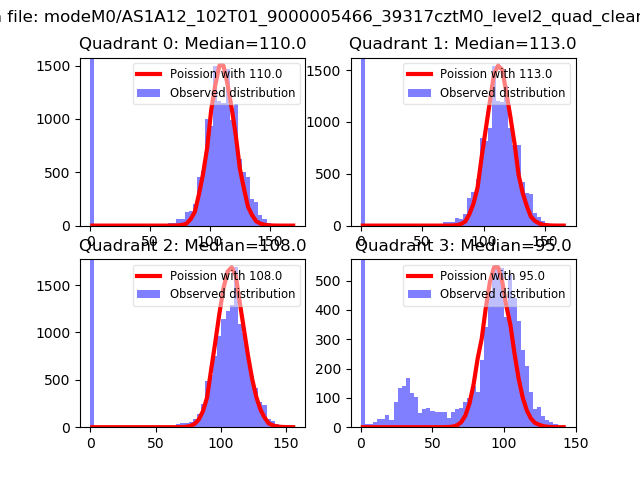 |
 |
| Quadrant-wise count rates Data is divided into 100 sec bins |
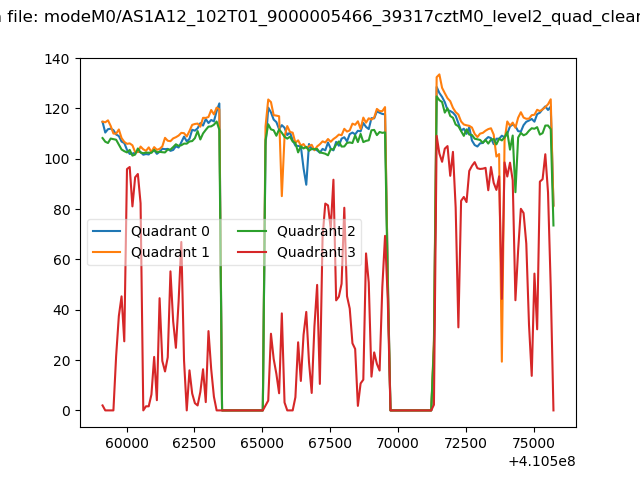 |
|
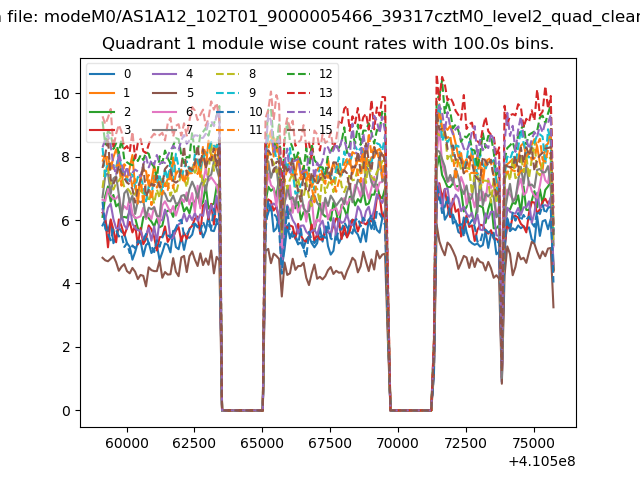
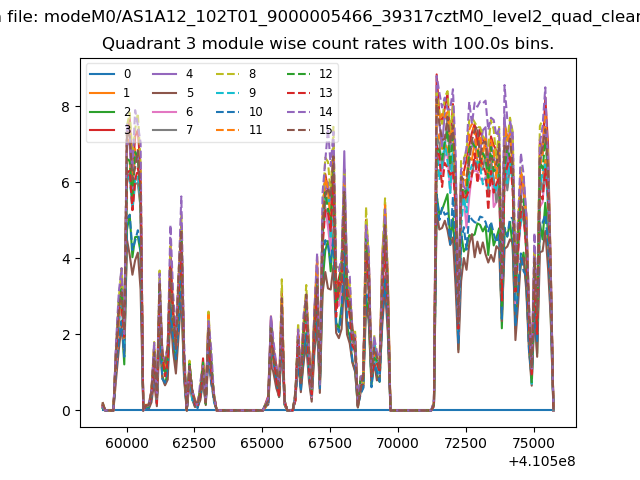
| Module-wise count rates for Quadrant A Data is divided into 100 sec bins |
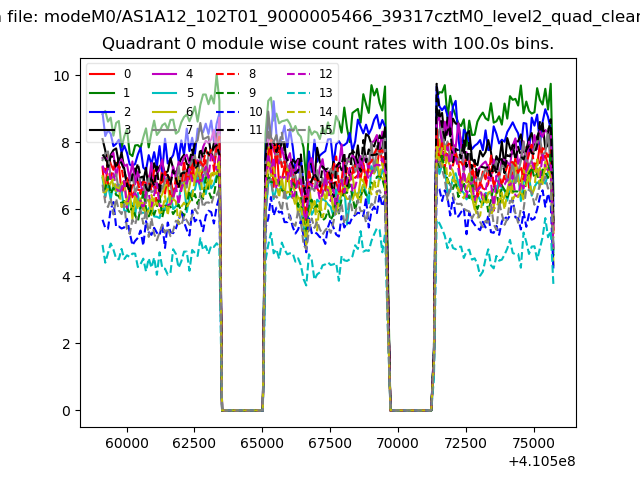 |
 |
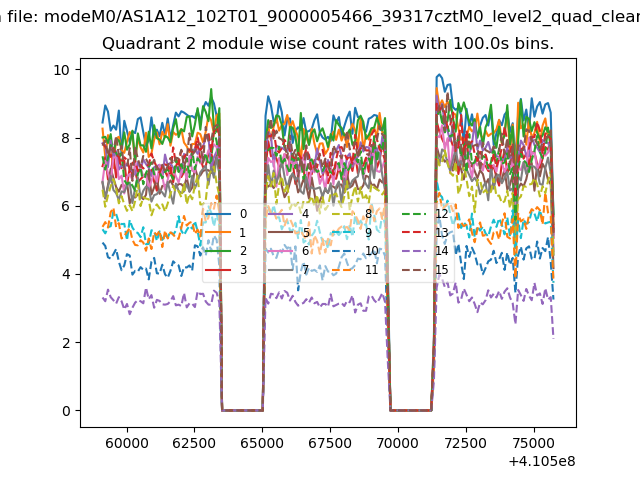
| Module-wise count rates for Quadrant B Data is divided into 100 sec bins |
 |
 |
| Module-wise count rates for Quadrant C Data is divided into 100 sec bins |
 |
 |
| Module-wise count rates for Quadrant D Data is divided into 100 sec bins |
 |
 |
| Parameter | Plot |
|---|---|
| CZT HV Monitor | 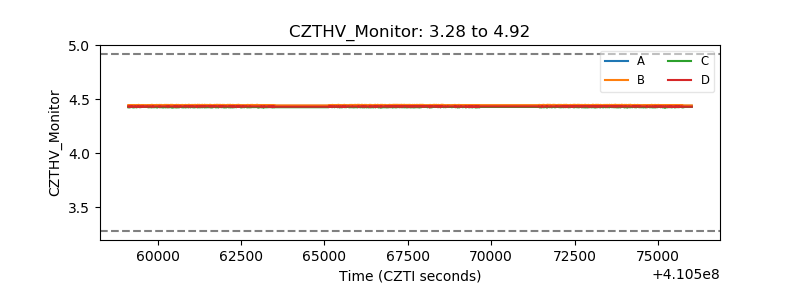 |
| D_VDD | 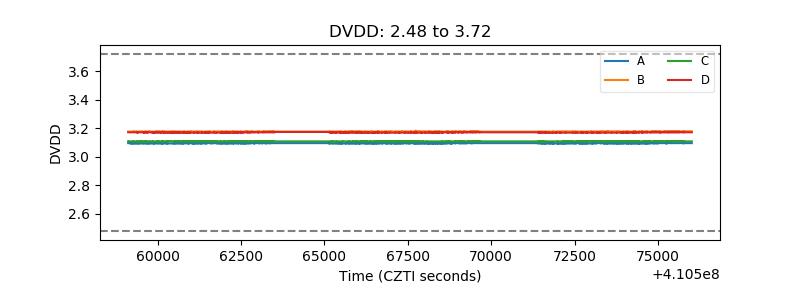 |
| Temperature 1 | 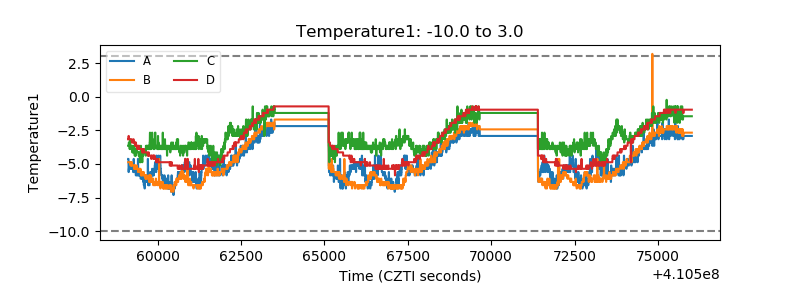 |
| Veto HV Monitor | 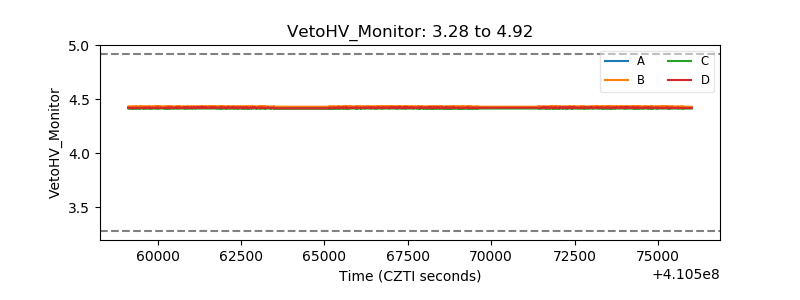 |
| Veto LLD | 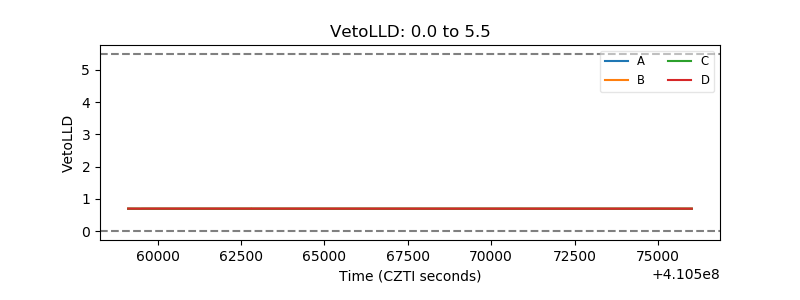 |
| Alpha Counter | 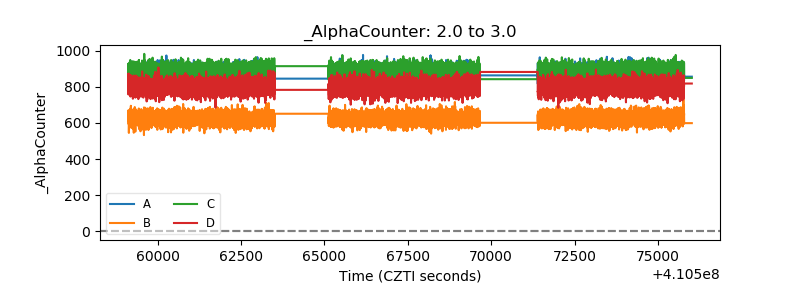 |
| _CPM_Rate | 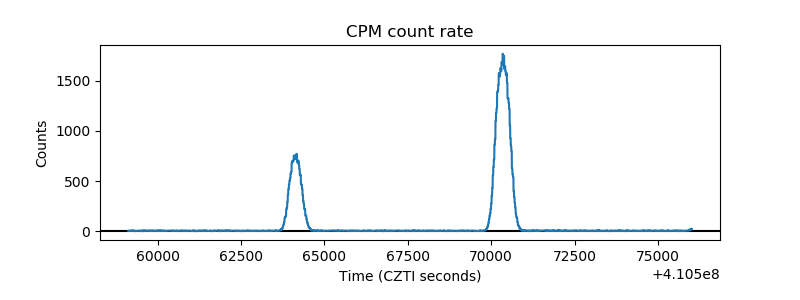 |
| CZT Counter | 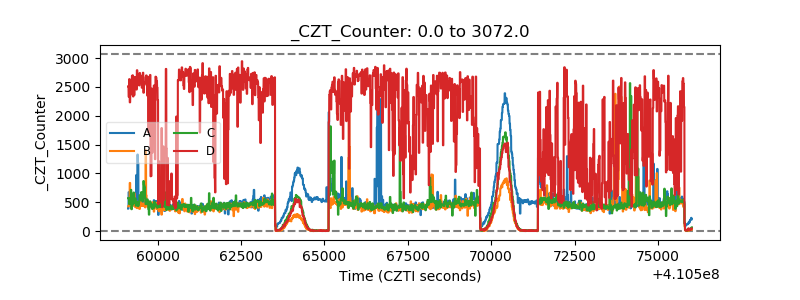 |
| +2.5 Volts monitor | 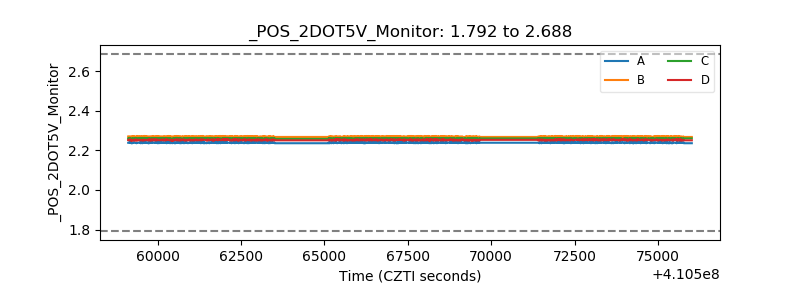 |
| +5 Volts monitor | 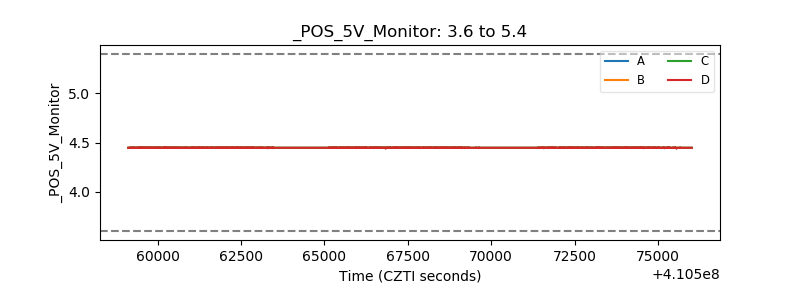 |
| _ROLL_ROT | 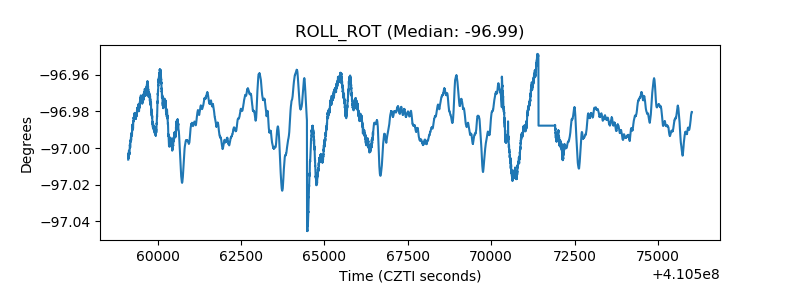 |
| _Roll_DEC | 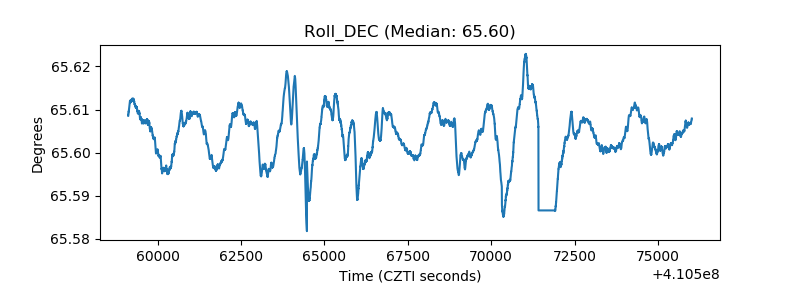 |
| _Roll_RA | 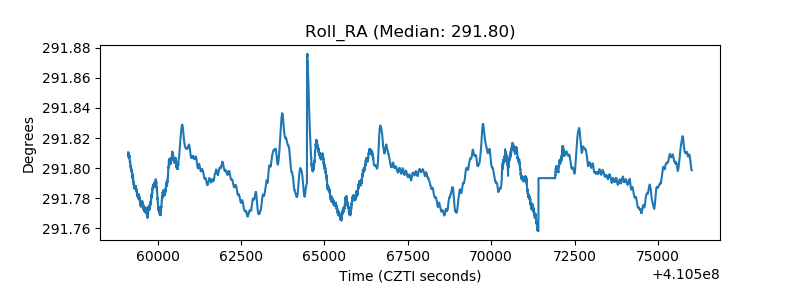 |
| Veto Counter | 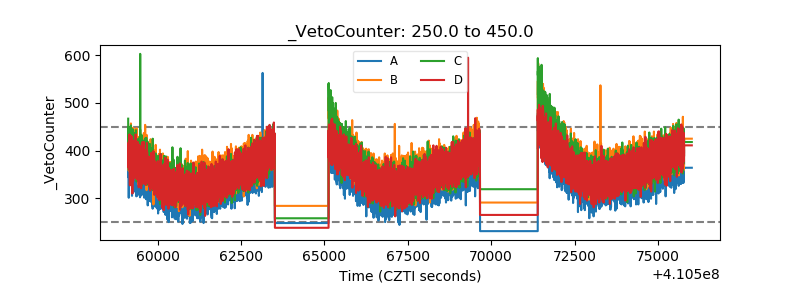 |