| Param | Original file | Final file |
|---|---|---|
| Filename | modeM0/AS1A12_061T07_9000005468_39314cztM0_level2.fits | modeM0/AS1A12_061T07_9000005468_39314cztM0_level2_quad_clean.evt |
| Size (bytes) | 91,560,960 | 17,487,360 |
| Size | 87.3 MB | 16.7 MB |
| Events in quadrant A | 613,327 | 129,301 |
| Events in quadrant B | 472,291 | 133,431 |
| Events in quadrant C | 495,047 | 120,954 |
| Events in quadrant D | 1,730,769 | 72,088 |
| Mode M9 | |||
|---|---|---|---|
| Quadrant | BADHDUFLAG | Total packets | Discarded packets |
| A | 0 | 1 | 0 |
| B | 0 | 1 | 0 |
| C | 0 | 1 | 0 |
| D | 0 | 1 | 0 |
| Mode SS | |||
|---|---|---|---|
| Quadrant | BADHDUFLAG | Total packets | Discarded packets |
| A | 0 | 18 | 0 |
| B | 0 | 18 | 0 |
| C | 0 | 18 | 0 |
| D | 0 | 18 | 0 |
| Mode M0 | |||
|---|---|---|---|
| Quadrant | BADHDUFLAG | Total packets | Discarded packets |
| A | 0 | 2394 | 2 |
| B | 0 | 1959 | 1 |
| C | 0 | 1977 | 1 |
| D | 0 | 5818 | 1 |
| Quadrant | Total seconds | Saturated seconds | Saturation percentage |
|---|---|---|---|
| A | 962 | 14 | 1.455301% |
| B | 962 | 4 | 0.415800% |
| C | 962 | 1 | 0.103950% |
| D | 962 | 415 | 43.139293% |
Noise dominated data is calculated using 1-second bins in cleaned event files. If a bin has >2000 counts, and if more than 50% of those come from <1% of pixels, then it is considered to be noise-dominated and hence unusable.
| Quadrant | # 1 sec bins | Bins with >0 counts | Bins with >2000 counts | High rate bins dominated by noise | Noise dominated (total time) | Noise dominated (detector-on time) | Marked lightcurve |
|---|---|---|---|---|---|---|---|
| A | 962 | 962 | 8 | 8 | 0.83% | 0.83% | 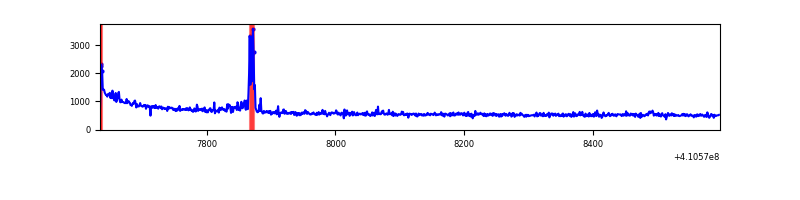 |
| B | 962 | 962 | 0 | 0 | 0.00% | 0.00% | 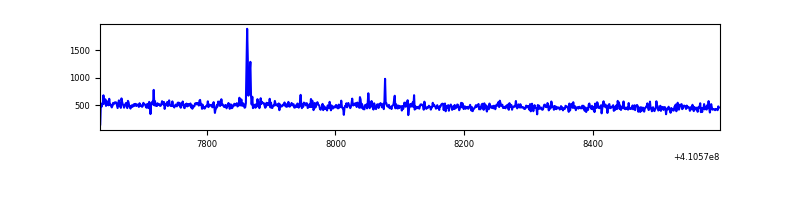 |
| C | 962 | 962 | 0 | 0 | 0.00% | 0.00% | 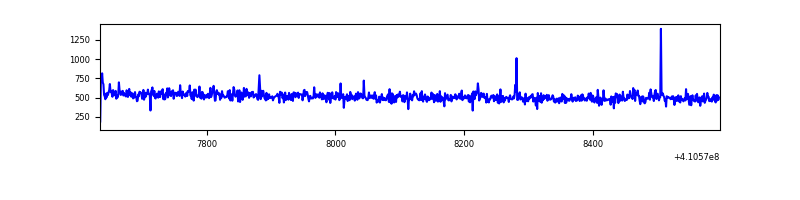 |
| D | 962 | 962 | 401 | 401 | 41.68% | 41.68% | 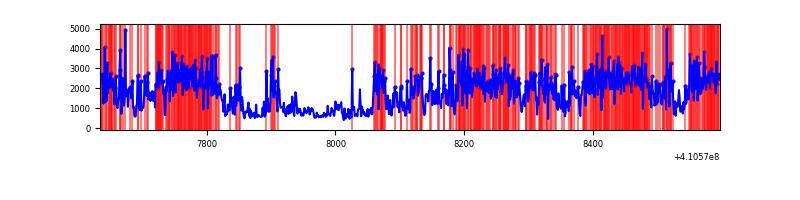 |
Top three noisy pixels from each quadrant. If the there are fewer than three noisy pixels in the level2.evt file, extra rows are filled as -1
| Pixel properties | Quadrant properties | ||||||
|---|---|---|---|---|---|---|---|
| Quadrant | DetID | PixID | Counts | Sigma | Mean | Median | Sigma |
| A | 10 | 83 | 128777 | 5083.88 | 115 | 113 | 25.3 |
| A | 13 | 248 | 33606 | 1323.4 | 115 | 113 | 25.3 |
| A | 15 | 222 | 3534 | 135.17 | 115 | 113 | 25.3 |
| B | 5 | 172 | 7260 | 299.91 | 117 | 114 | 23.8 |
| B | 0 | 230 | 5585 | 229.61 | 117 | 114 | 23.8 |
| B | 12 | 111 | 2674 | 107.44 | 117 | 114 | 23.8 |
| C | 15 | 214 | 47785 | 1686.67 | 113 | 114 | 28.3 |
| C | 14 | 254 | 2440 | 82.3 | 113 | 114 | 28.3 |
| C | 12 | 249 | 1940 | 64.61 | 113 | 114 | 28.3 |
| D | 12 | 235 | 1168757 | 47836.94 | 94 | 91 | 24.4 |
| D | 13 | 249 | 135424 | 5539.58 | 94 | 91 | 24.4 |
| D | 12 | 227 | 23021 | 938.59 | 94 | 91 | 24.4 |
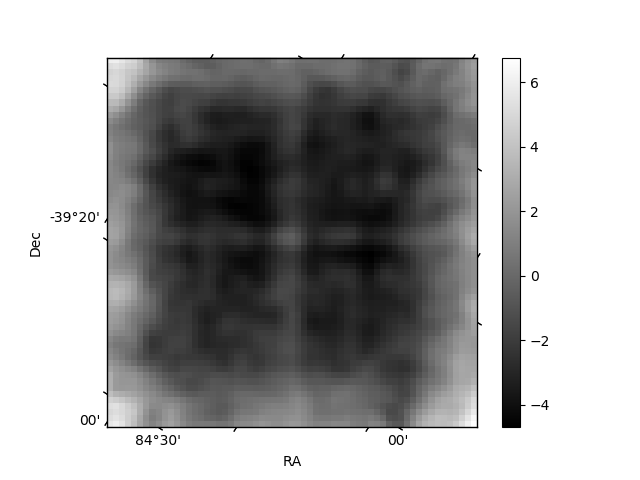
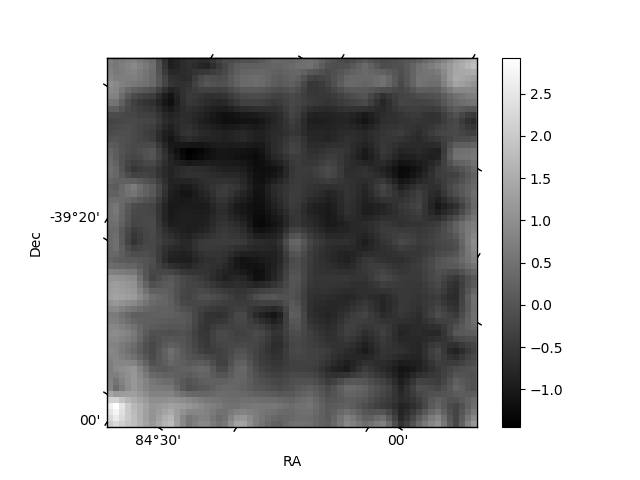
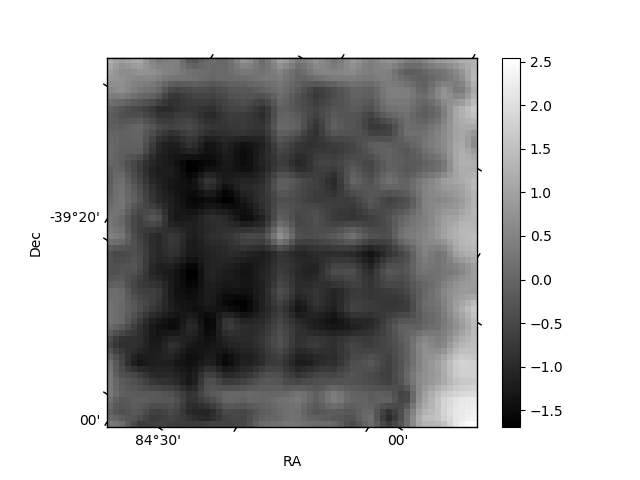
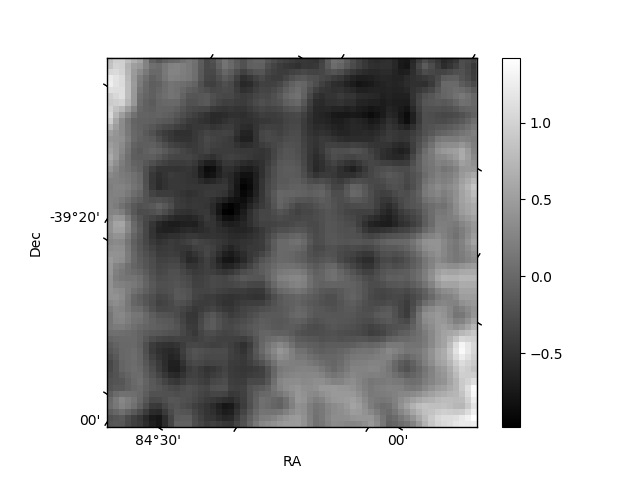
Histogram calculated using DETX and DETY for each event in the final _common_clean file
| Quadrant A | 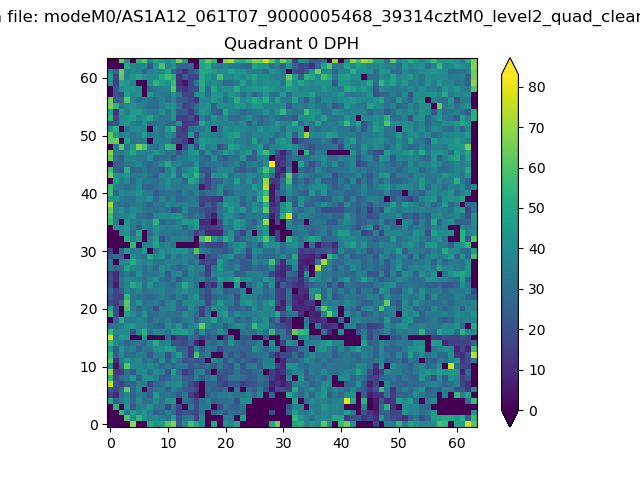 |
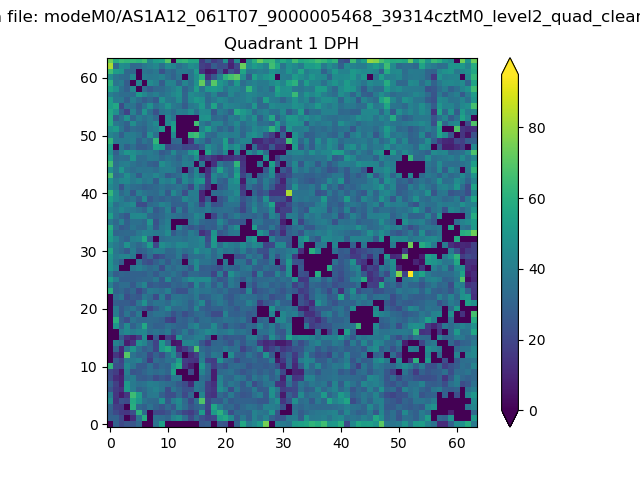 |
Quadrant B |
|---|---|---|---|
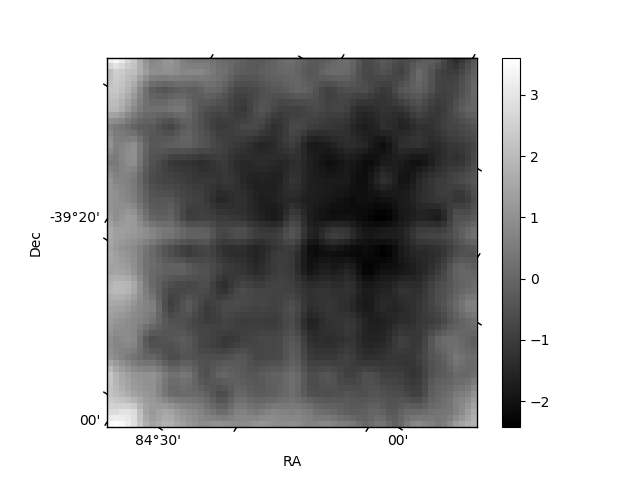
| Quadrant D | 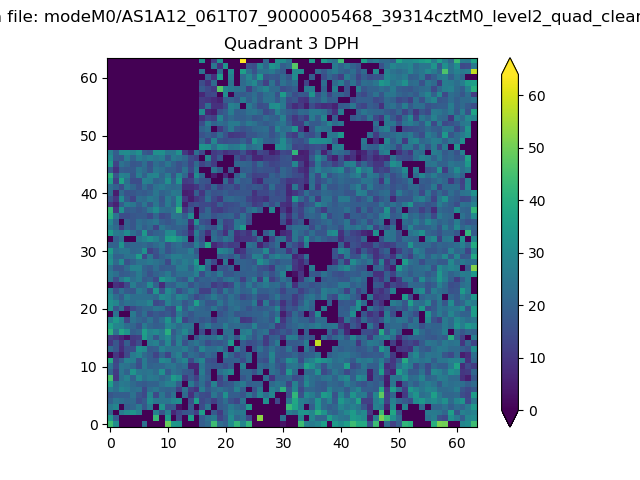 |
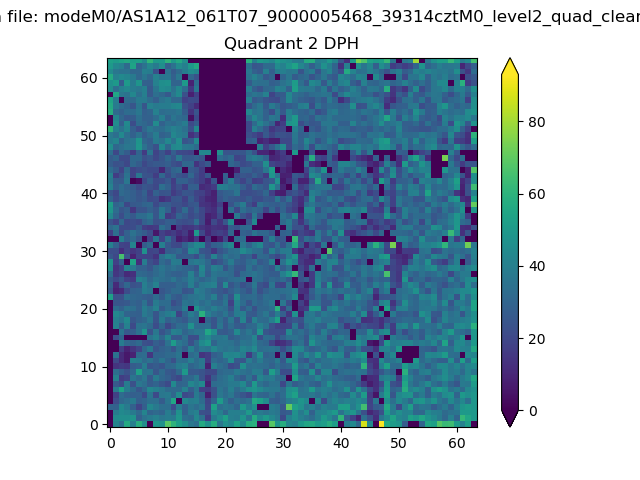 |
Quadrant C |
| Plot type | Count rate plots | Images |
|---|---|---|
| Comparison with Poisson distribution Blue bars denote a histogram of data divided into 1 sec bins. Red curve is a Poisson curve with rate = median count rate of data. |
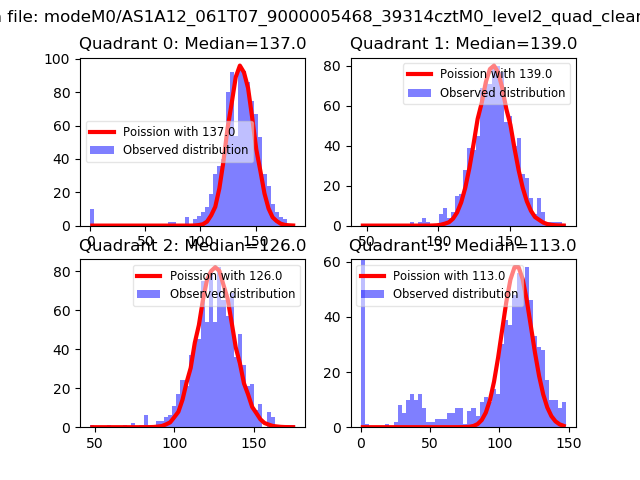 |
 |
| Quadrant-wise count rates Data is divided into 100 sec bins |
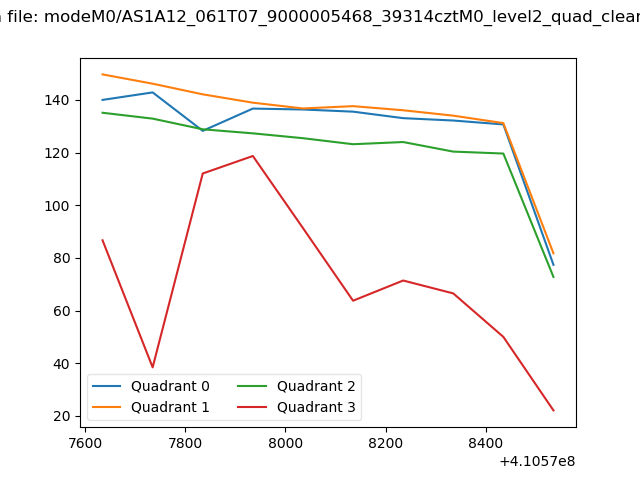 |
|
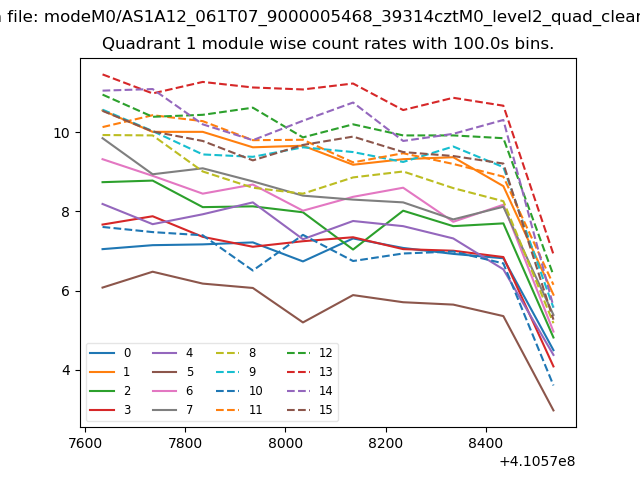
| Module-wise count rates for Quadrant A Data is divided into 100 sec bins |
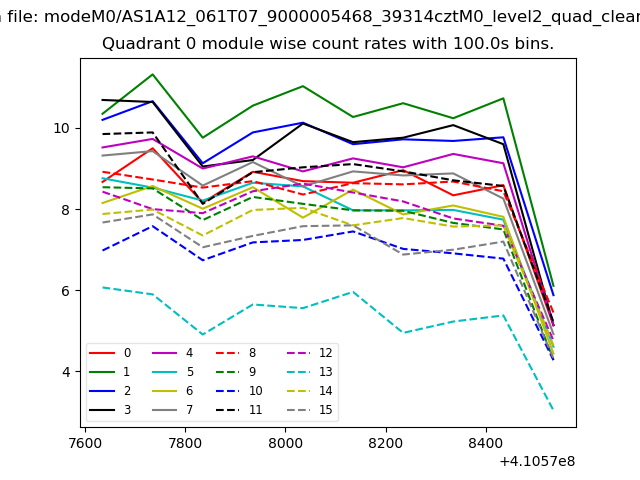 |
 |
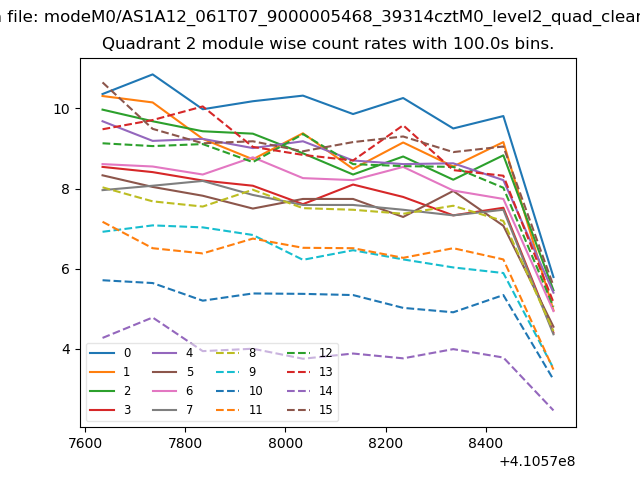
| Module-wise count rates for Quadrant B Data is divided into 100 sec bins |
 |
 |
| Module-wise count rates for Quadrant C Data is divided into 100 sec bins |
 |
 |
| Module-wise count rates for Quadrant D Data is divided into 100 sec bins |
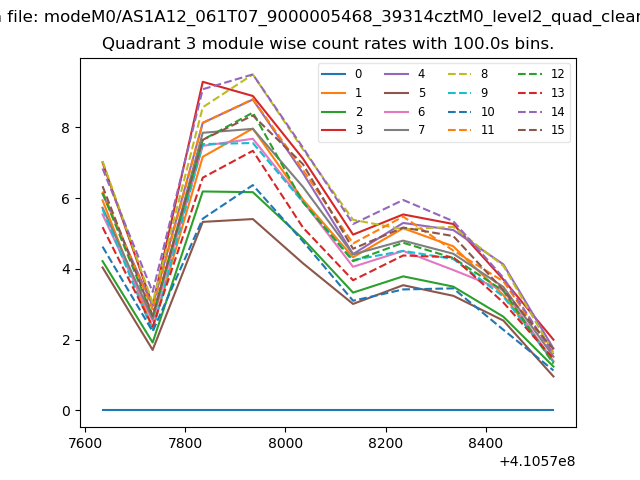 |
 |
| Parameter | Plot |
|---|---|
| CZT HV Monitor | 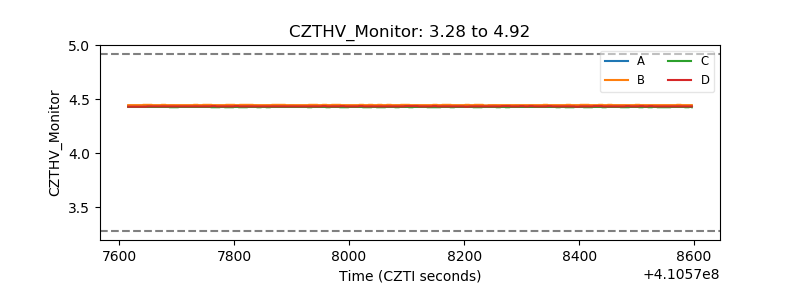 |
| D_VDD | 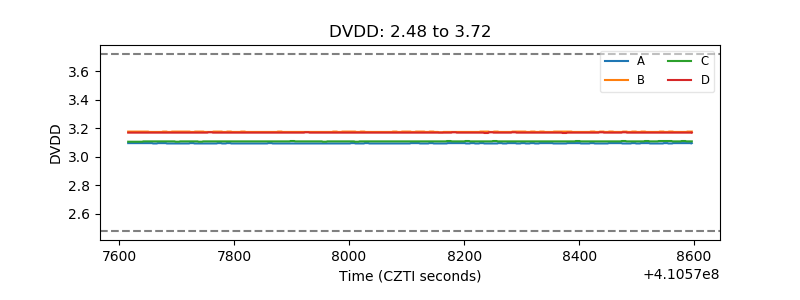 |
| Temperature 1 | 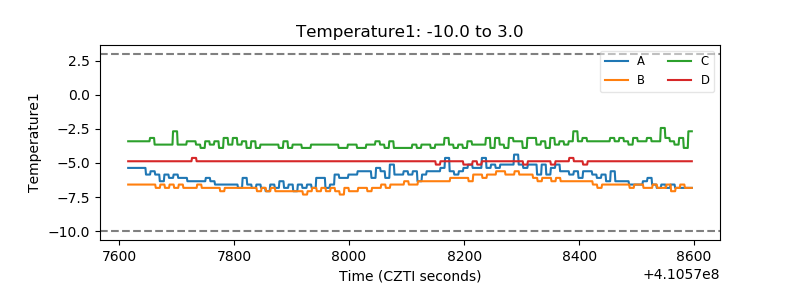 |
| Veto HV Monitor | 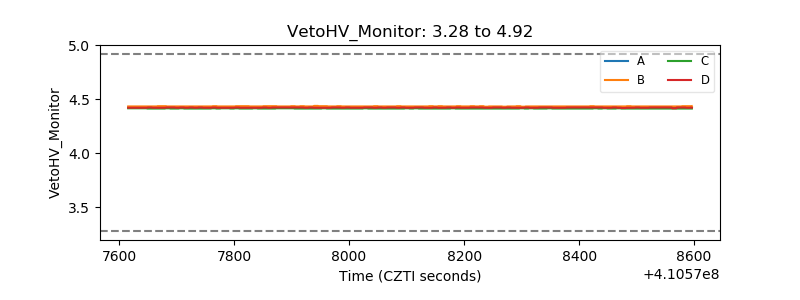 |
| Veto LLD | 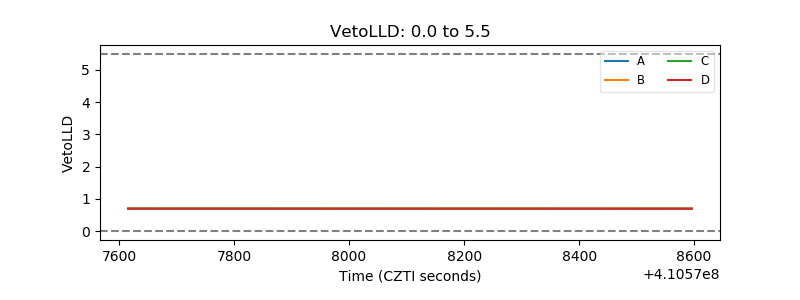 |
| Alpha Counter | 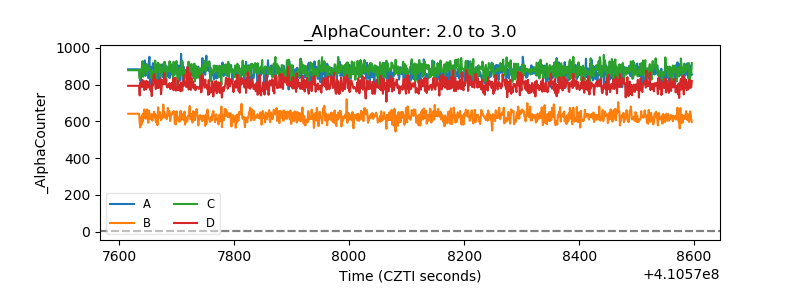 |
| _CPM_Rate | 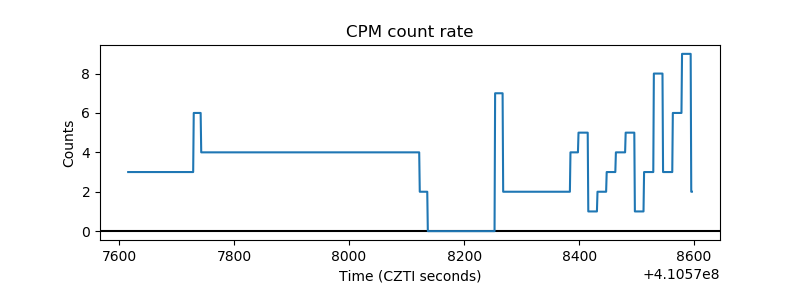 |
| CZT Counter | 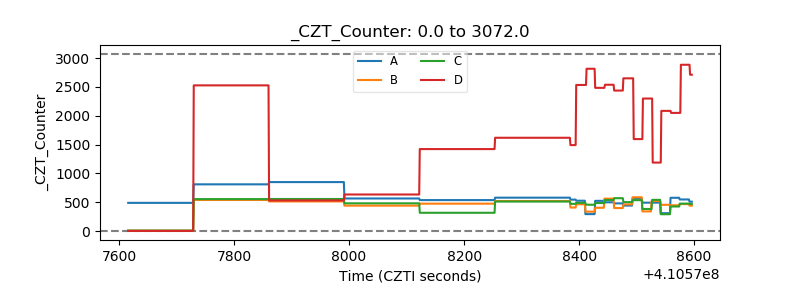 |
| +2.5 Volts monitor | 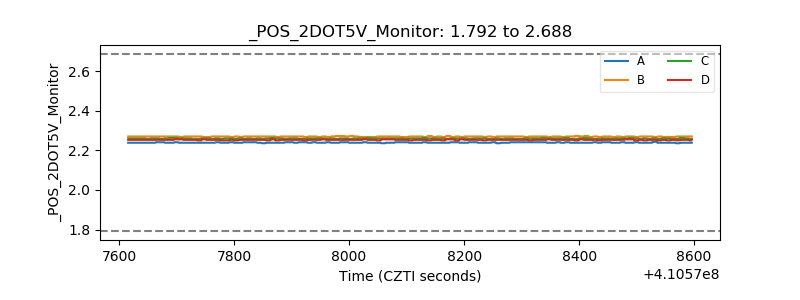 |
| +5 Volts monitor | 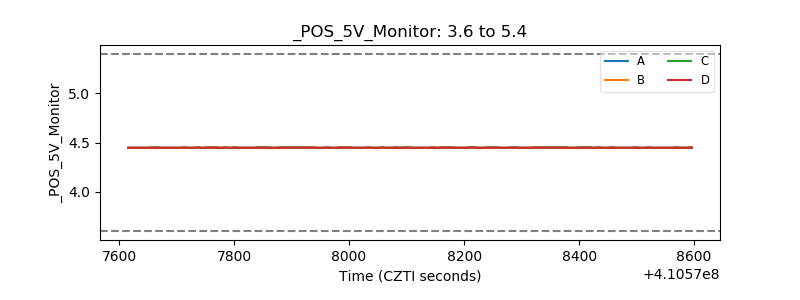 |
| _ROLL_ROT | 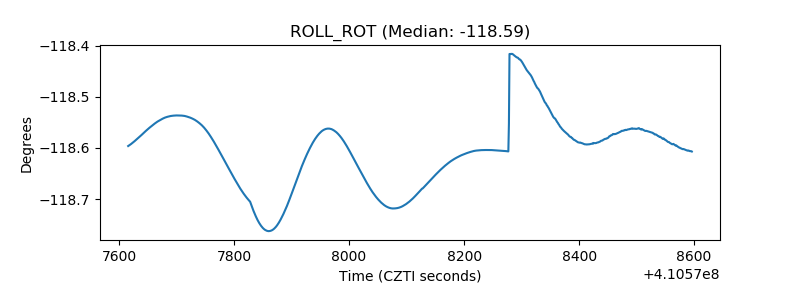 |
| _Roll_DEC | 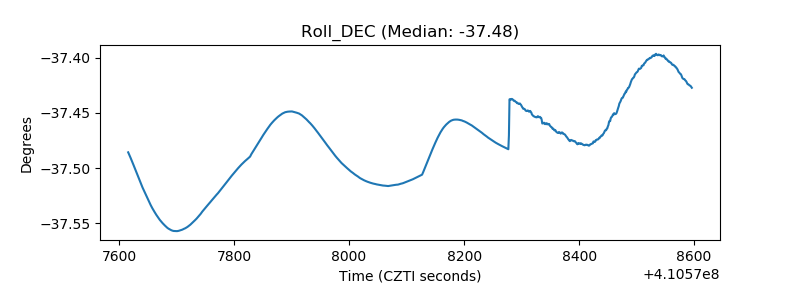 |
| _Roll_RA | 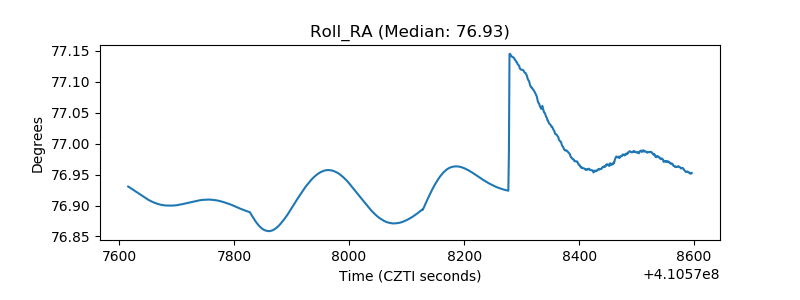 |
| Veto Counter | 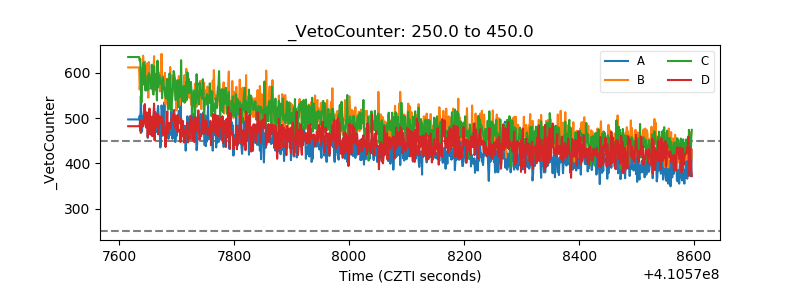 |