| Param | Original file | Final file |
|---|---|---|
| Filename | modeM0/AS1A12_061T07_9000005468_39315cztM0_level2.fits | modeM0/AS1A12_061T07_9000005468_39315cztM0_level2_quad_clean.evt |
| Size (bytes) | 459,089,280 | 89,737,920 |
| Size | 437.8 MB | 85.6 MB |
| Events in quadrant A | 2,933,372 | 647,742 |
| Events in quadrant B | 2,492,131 | 674,352 |
| Events in quadrant C | 2,743,950 | 625,820 |
| Events in quadrant D | 8,426,468 | 410,421 |
| Mode M9 | |||
|---|---|---|---|
| Quadrant | BADHDUFLAG | Total packets | Discarded packets |
| A | 0 | 20 | 0 |
| B | 0 | 20 | 0 |
| C | 0 | 20 | 0 |
| D | 0 | 20 | 0 |
| Mode SS | |||
|---|---|---|---|
| Quadrant | BADHDUFLAG | Total packets | Discarded packets |
| A | 0 | 106 | 0 |
| B | 0 | 106 | 0 |
| C | 0 | 106 | 0 |
| D | 0 | 106 | 0 |
| Mode M0 | |||
|---|---|---|---|
| Quadrant | BADHDUFLAG | Total packets | Discarded packets |
| A | 0 | 11650 | 3 |
| B | 0 | 10486 | 2 |
| C | 0 | 11016 | 2 |
| D | 0 | 28625 | 2 |
| Quadrant | Total seconds | Saturated seconds | Saturation percentage |
|---|---|---|---|
| A | 5119 | 46 | 0.898613% |
| B | 5119 | 12 | 0.234421% |
| C | 5119 | 23 | 0.449307% |
| D | 5119 | 1783 | 34.831022% |
Noise dominated data is calculated using 1-second bins in cleaned event files. If a bin has >2000 counts, and if more than 50% of those come from <1% of pixels, then it is considered to be noise-dominated and hence unusable.
| Quadrant | # 1 sec bins | Bins with >0 counts | Bins with >2000 counts | High rate bins dominated by noise | Noise dominated (total time) | Noise dominated (detector-on time) | Marked lightcurve |
|---|---|---|---|---|---|---|---|
| A | 7091 | 5120 | 28 | 28 | 0.39% | 0.55% | 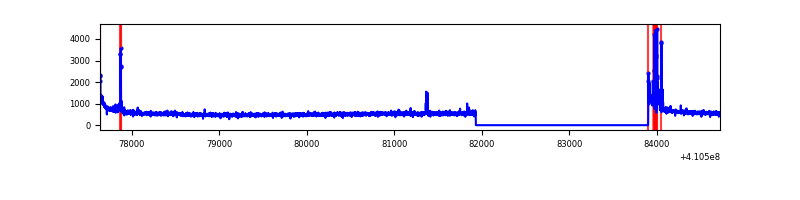 |
| B | 7091 | 5120 | 3 | 3 | 0.04% | 0.06% | 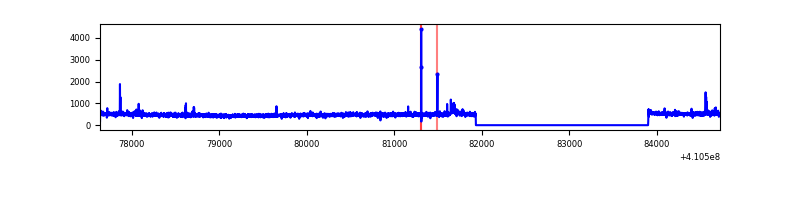 |
| C | 7091 | 5120 | 12 | 12 | 0.17% | 0.23% | 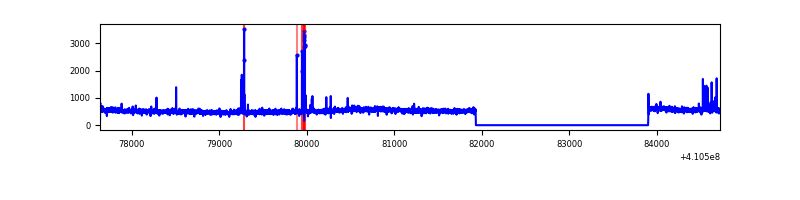 |
| D | 7091 | 5120 | 1629 | 1629 | 22.97% | 31.82% | 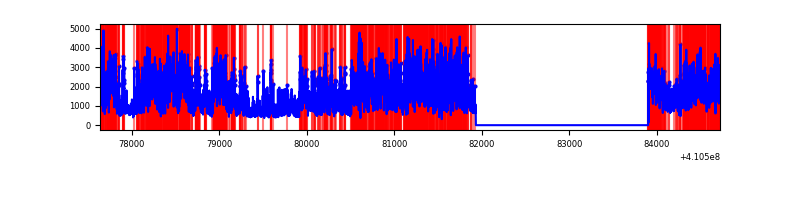 |
Top three noisy pixels from each quadrant. If the there are fewer than three noisy pixels in the level2.evt file, extra rows are filled as -1
| Pixel properties | Quadrant properties | ||||||
|---|---|---|---|---|---|---|---|
| Quadrant | DetID | PixID | Counts | Sigma | Mean | Median | Sigma |
| A | 10 | 83 | 392866 | 3166.05 | 613 | 603 | 123.9 |
| A | 13 | 248 | 143772 | 1155.55 | 613 | 603 | 123.9 |
| A | 15 | 222 | 28395 | 224.32 | 613 | 603 | 123.9 |
| B | 5 | 172 | 48436 | 413.3 | 614 | 599 | 115.7 |
| B | 0 | 183 | 18466 | 154.37 | 614 | 599 | 115.7 |
| B | 12 | 111 | 14500 | 120.1 | 614 | 599 | 115.7 |
| C | 15 | 214 | 232669 | 1657.77 | 602 | 607 | 140.0 |
| C | 9 | 187 | 110024 | 781.64 | 602 | 607 | 140.0 |
| C | 14 | 254 | 46651 | 328.92 | 602 | 607 | 140.0 |
| D | 12 | 235 | 5842526 | 45415.81 | 527 | 514 | 128.6 |
| D | 13 | 249 | 322623 | 2504.08 | 527 | 514 | 128.6 |
| D | 12 | 227 | 96004 | 742.34 | 527 | 514 | 128.6 |
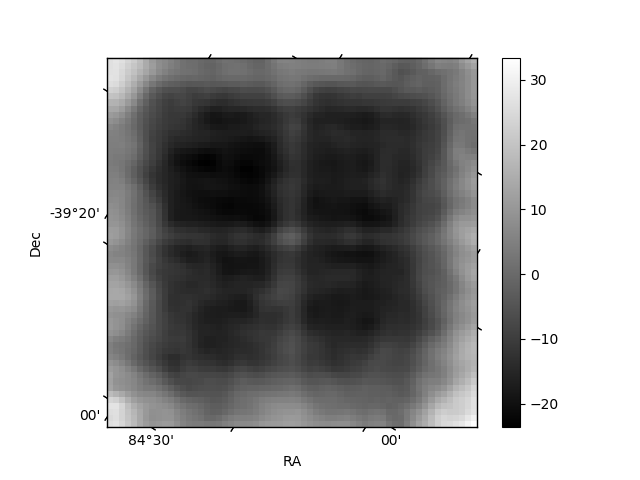
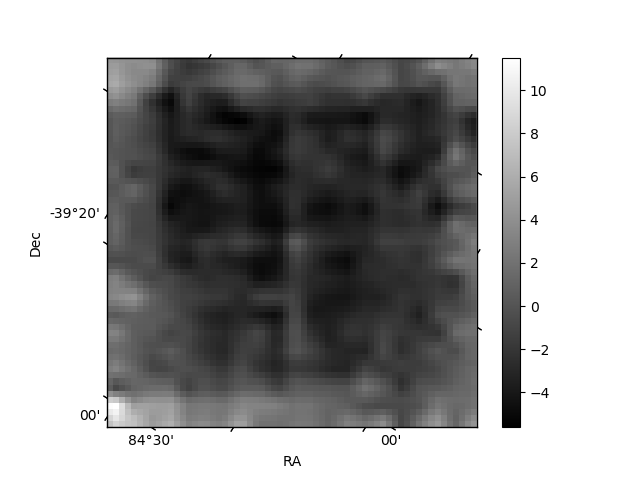
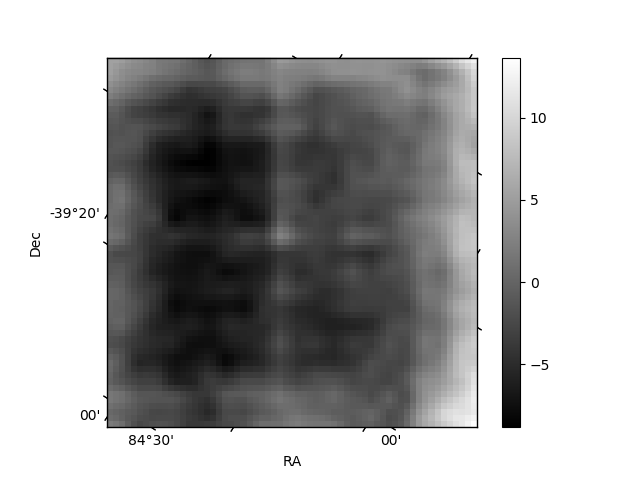
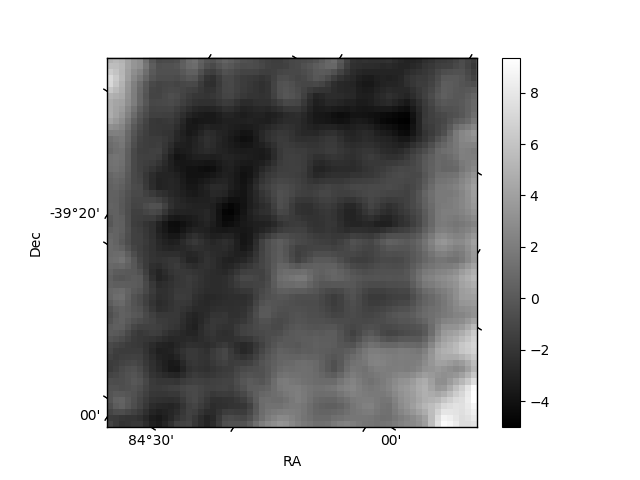
Histogram calculated using DETX and DETY for each event in the final _common_clean file
| Quadrant A | 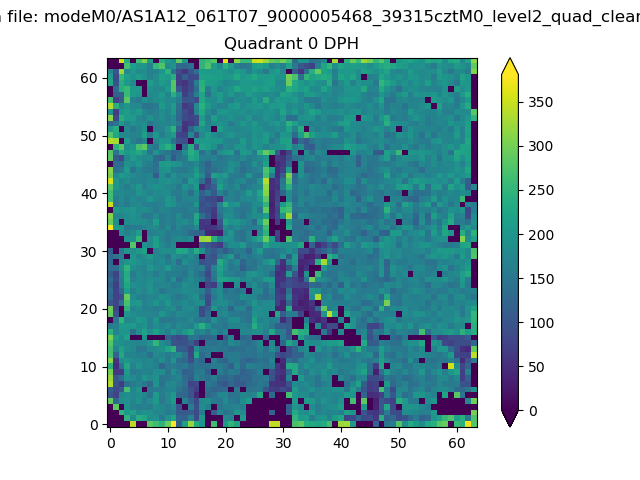 |
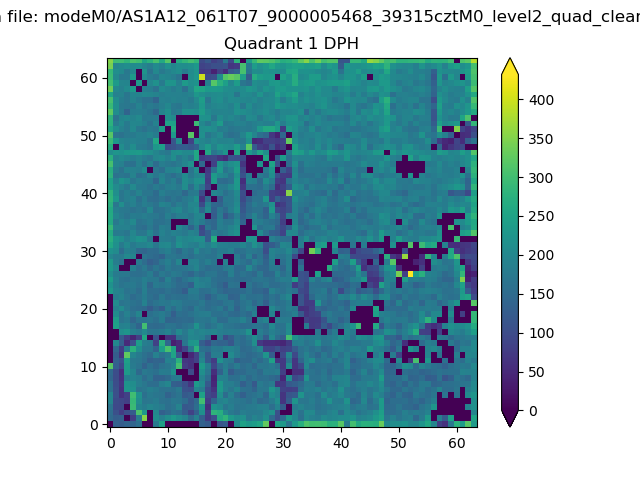 |
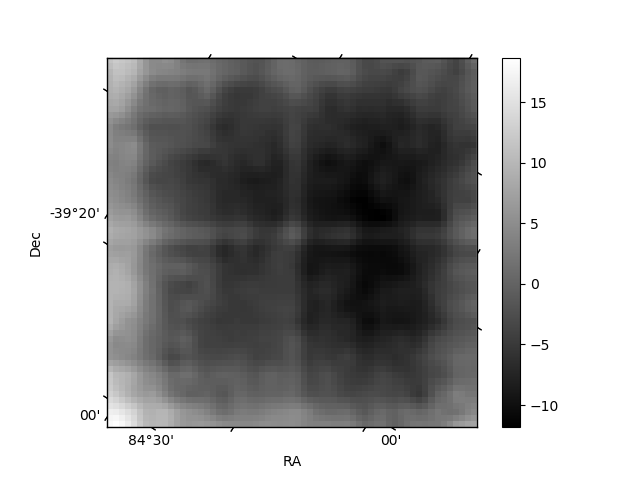
Quadrant B |
|---|---|---|---|
| Quadrant D | 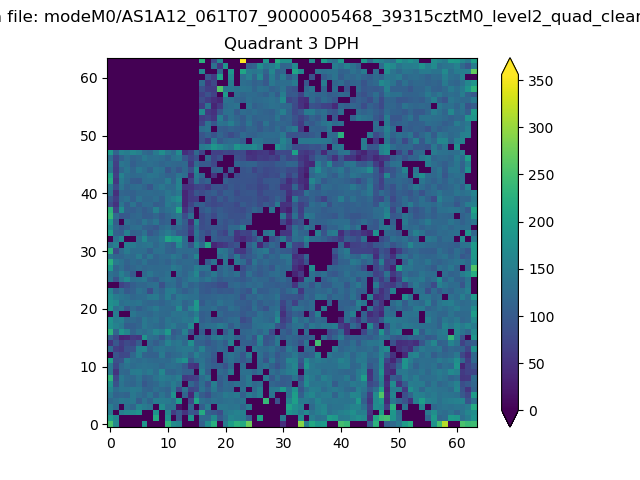 |
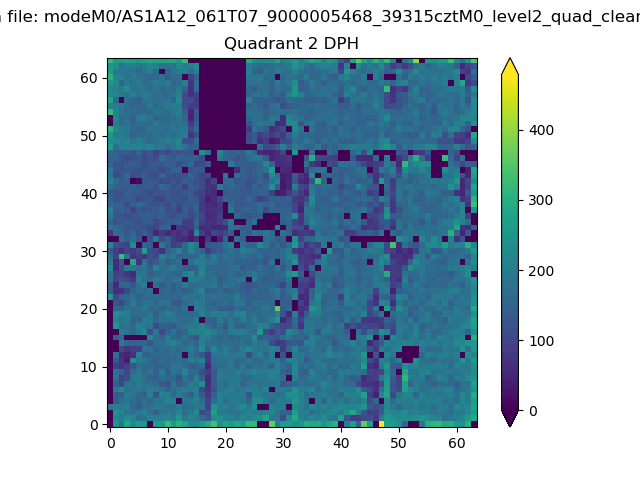 |
Quadrant C |
| Plot type | Count rate plots | Images |
|---|---|---|
| Comparison with Poisson distribution Blue bars denote a histogram of data divided into 1 sec bins. Red curve is a Poisson curve with rate = median count rate of data. |
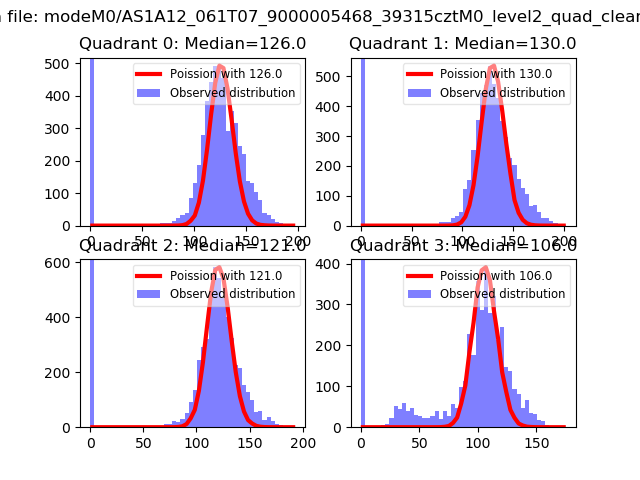 |
 |
| Quadrant-wise count rates Data is divided into 100 sec bins |
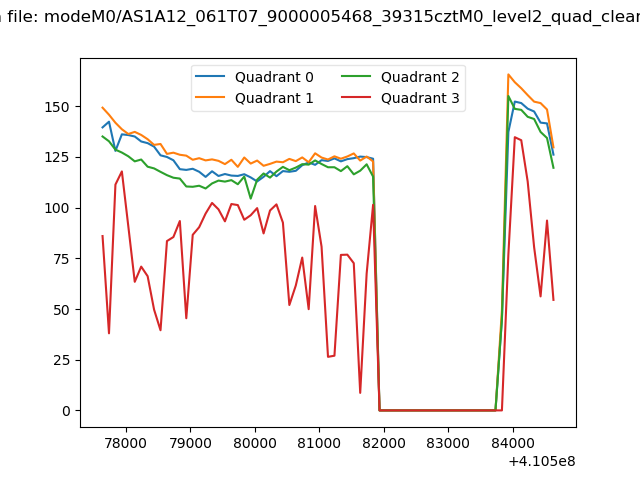 |
|
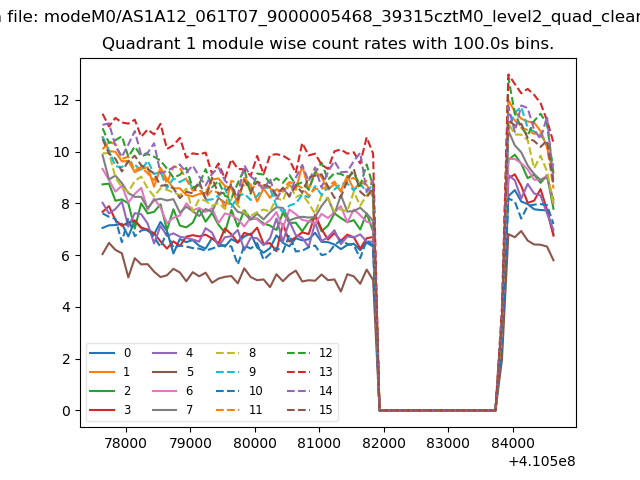
| Module-wise count rates for Quadrant A Data is divided into 100 sec bins |
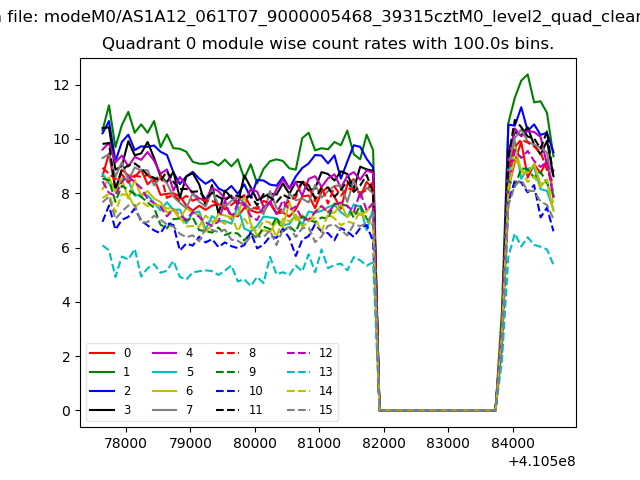 |
 |
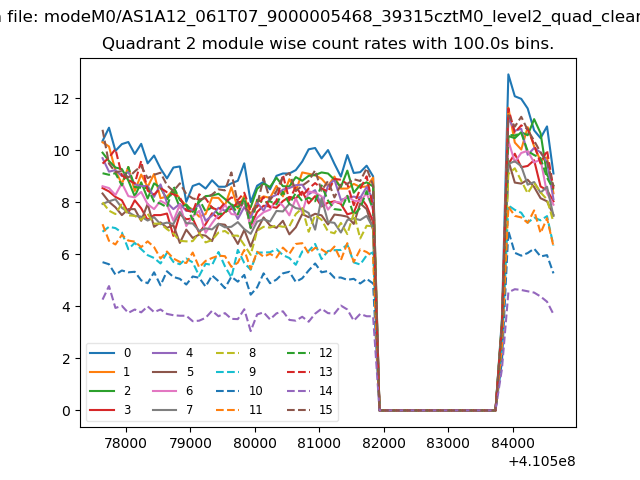
| Module-wise count rates for Quadrant B Data is divided into 100 sec bins |
 |
 |
| Module-wise count rates for Quadrant C Data is divided into 100 sec bins |
 |
 |
| Module-wise count rates for Quadrant D Data is divided into 100 sec bins |
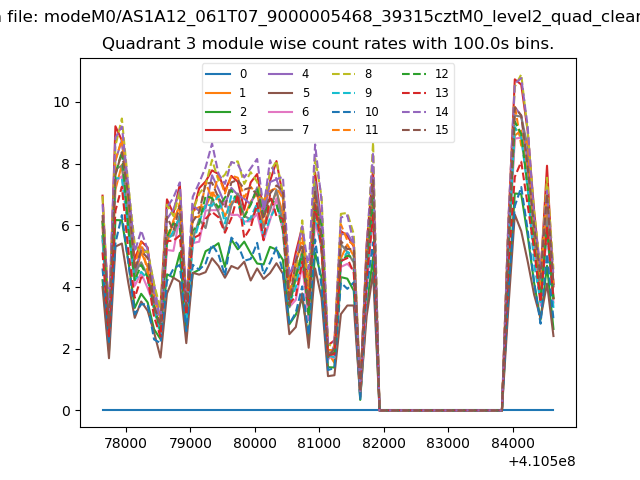 |
 |
| Parameter | Plot |
|---|---|
| CZT HV Monitor | 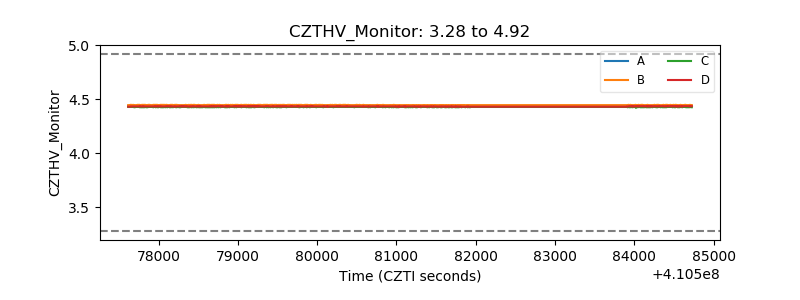 |
| D_VDD | 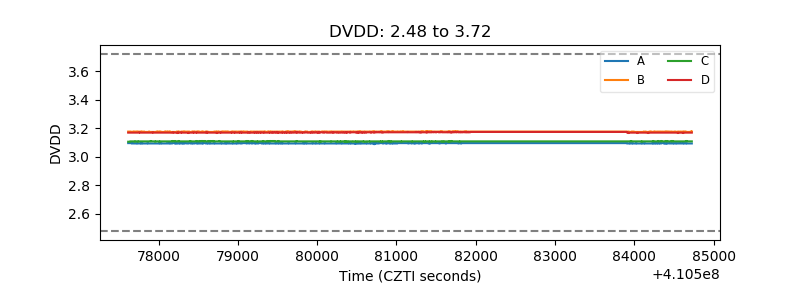 |
| Temperature 1 | 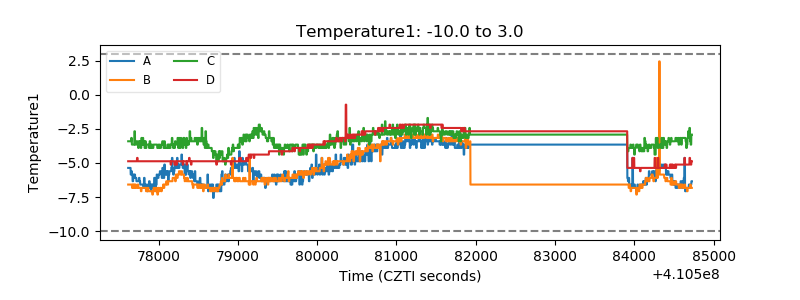 |
| Veto HV Monitor | 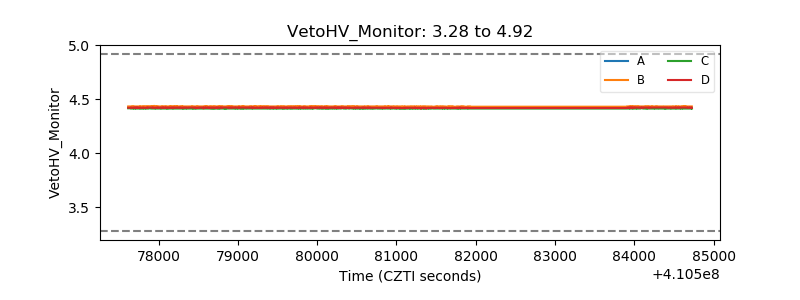 |
| Veto LLD | 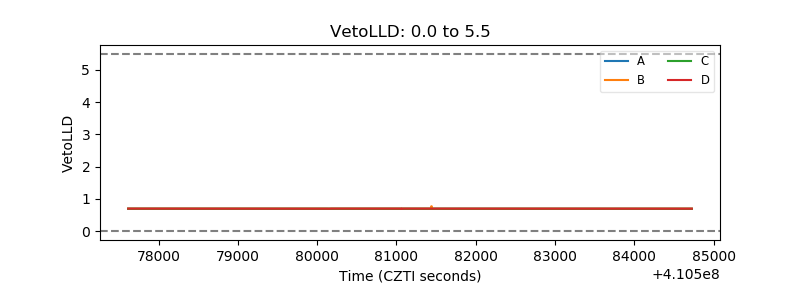 |
| Alpha Counter | 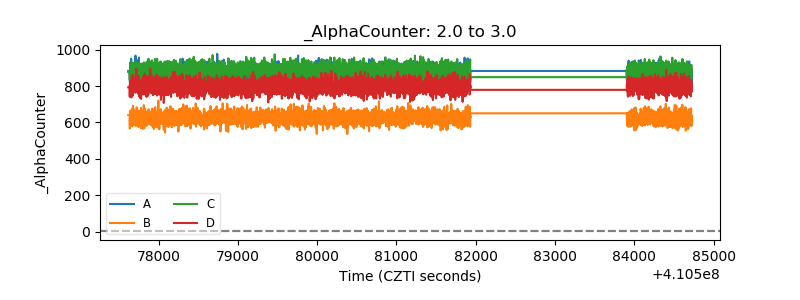 |
| _CPM_Rate | 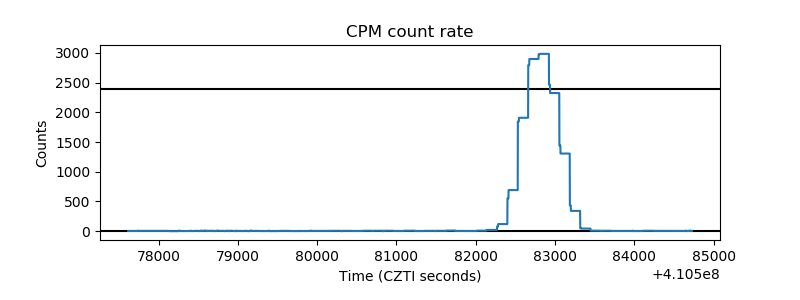 |
| CZT Counter | 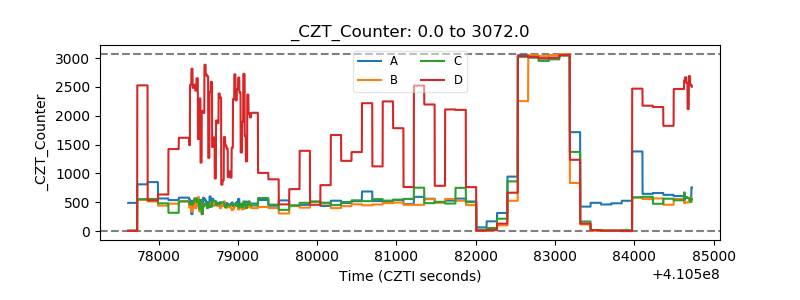 |
| +2.5 Volts monitor | 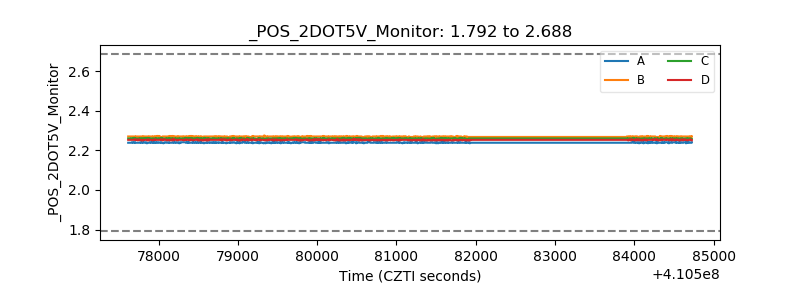 |
| +5 Volts monitor | 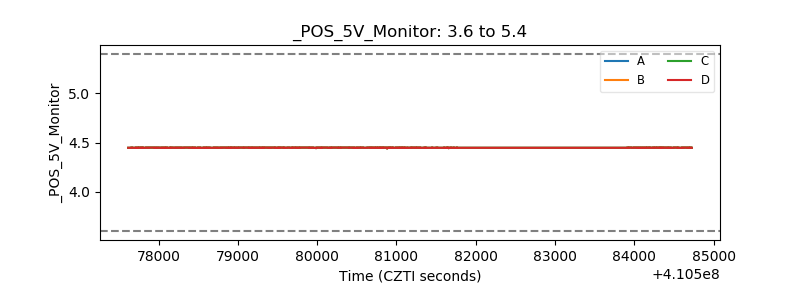 |
| _ROLL_ROT | 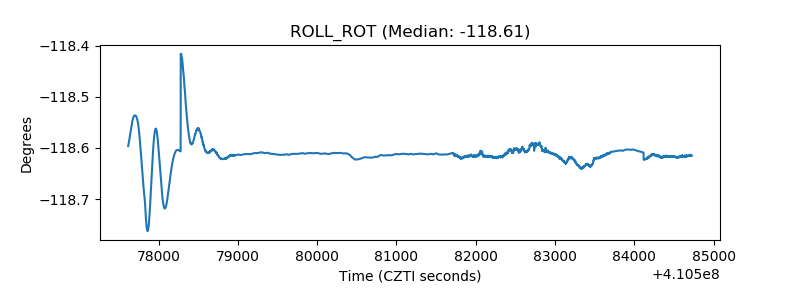 |
| _Roll_DEC | 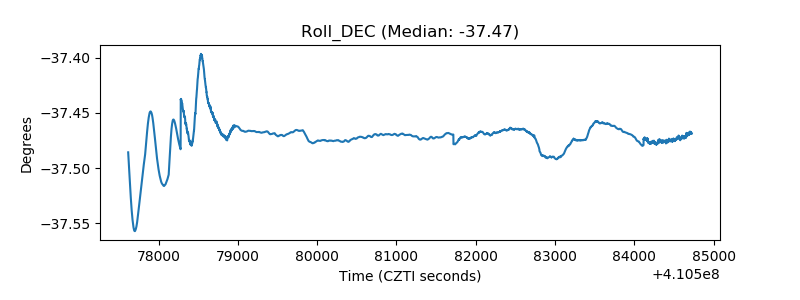 |
| _Roll_RA | 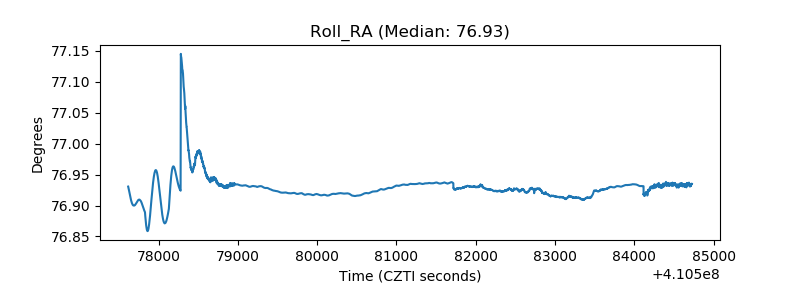 |
| Veto Counter | 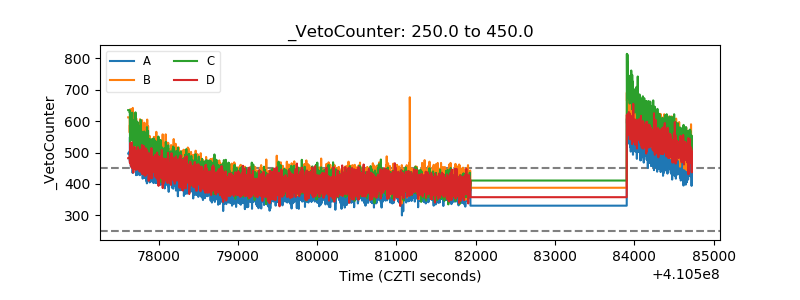 |