| Param | Original file | Final file |
|---|---|---|
| Filename | modeM0/AS1A12_061T07_9000005468_39316cztM0_level2.fits | modeM0/AS1A12_061T07_9000005468_39316cztM0_level2_quad_clean.evt |
| Size (bytes) | 490,968,000 | 88,534,080 |
| Size | 468.2 MB | 84.4 MB |
| Events in quadrant A | 2,957,225 | 659,456 |
| Events in quadrant B | 2,521,105 | 692,762 |
| Events in quadrant C | 2,809,608 | 651,002 |
| Events in quadrant D | 9,499,097 | 328,766 |
| Mode M9 | |||
|---|---|---|---|
| Quadrant | BADHDUFLAG | Total packets | Discarded packets |
| A | 0 | 28 | 0 |
| B | 0 | 28 | 0 |
| C | 0 | 28 | 0 |
| D | 0 | 29 | 0 |
| Mode SS | |||
|---|---|---|---|
| Quadrant | BADHDUFLAG | Total packets | Discarded packets |
| A | 0 | 102 | 0 |
| B | 0 | 102 | 0 |
| C | 0 | 102 | 0 |
| D | 0 | 102 | 0 |
| Mode M0 | |||
|---|---|---|---|
| Quadrant | BADHDUFLAG | Total packets | Discarded packets |
| A | 0 | 11586 | 3 |
| B | 0 | 10276 | 2 |
| C | 0 | 11117 | 2 |
| D | 0 | 31702 | 2 |
| Quadrant | Total seconds | Saturated seconds | Saturation percentage |
|---|---|---|---|
| A | 4974 | 35 | 0.703659% |
| B | 4974 | 5 | 0.100523% |
| C | 4974 | 32 | 0.643345% |
| D | 4974 | 2657 | 53.417772% |
Noise dominated data is calculated using 1-second bins in cleaned event files. If a bin has >2000 counts, and if more than 50% of those come from <1% of pixels, then it is considered to be noise-dominated and hence unusable.
| Quadrant | # 1 sec bins | Bins with >0 counts | Bins with >2000 counts | High rate bins dominated by noise | Noise dominated (total time) | Noise dominated (detector-on time) | Marked lightcurve |
|---|---|---|---|---|---|---|---|
| A | 7037 | 4975 | 23 | 23 | 0.33% | 0.46% | 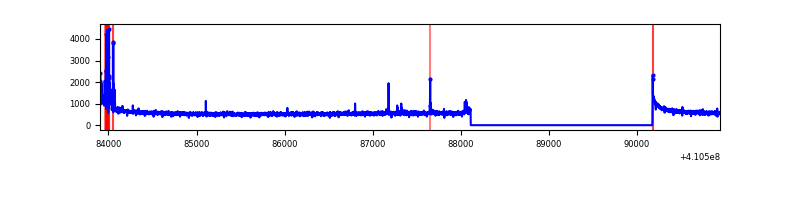 |
| B | 7037 | 4975 | 0 | 0 | 0.00% | 0.00% | 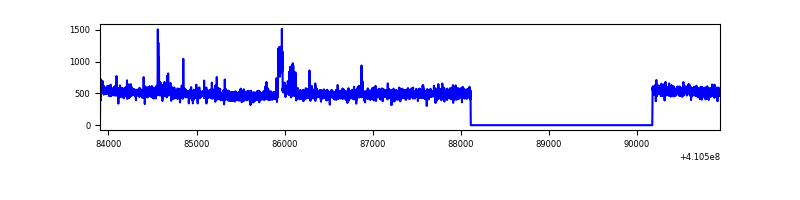 |
| C | 7037 | 4975 | 20 | 20 | 0.28% | 0.40% | 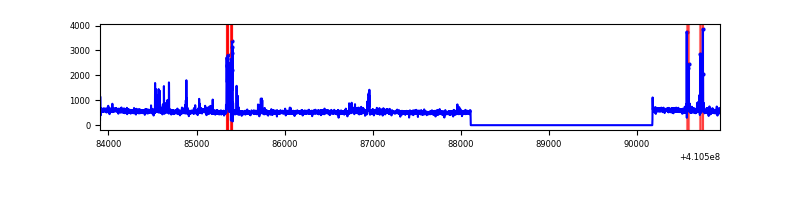 |
| D | 7037 | 4975 | 2255 | 2255 | 32.04% | 45.33% | 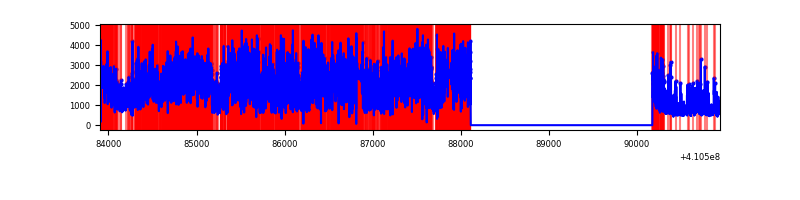 |
Top three noisy pixels from each quadrant. If the there are fewer than three noisy pixels in the level2.evt file, extra rows are filled as -1
| Pixel properties | Quadrant properties | ||||||
|---|---|---|---|---|---|---|---|
| Quadrant | DetID | PixID | Counts | Sigma | Mean | Median | Sigma |
| A | 10 | 83 | 391261 | 3157.38 | 618 | 608 | 123.7 |
| A | 13 | 248 | 126431 | 1016.94 | 618 | 608 | 123.7 |
| A | 15 | 222 | 48416 | 386.4 | 618 | 608 | 123.7 |
| B | 5 | 255 | 59300 | 502.5 | 621 | 607 | 116.8 |
| B | 12 | 111 | 14154 | 115.98 | 621 | 607 | 116.8 |
| B | 11 | 111 | 13186 | 107.7 | 621 | 607 | 116.8 |
| C | 15 | 214 | 226305 | 1576.13 | 614 | 621 | 143.2 |
| C | 14 | 254 | 118287 | 821.76 | 614 | 621 | 143.2 |
| C | 9 | 187 | 64313 | 444.81 | 614 | 621 | 143.2 |
| D | 12 | 235 | 7244117 | 62057.77 | 476 | 463 | 116.7 |
| D | 12 | 227 | 221541 | 1894.02 | 476 | 463 | 116.7 |
| D | 13 | 249 | 162224 | 1385.84 | 476 | 463 | 116.7 |
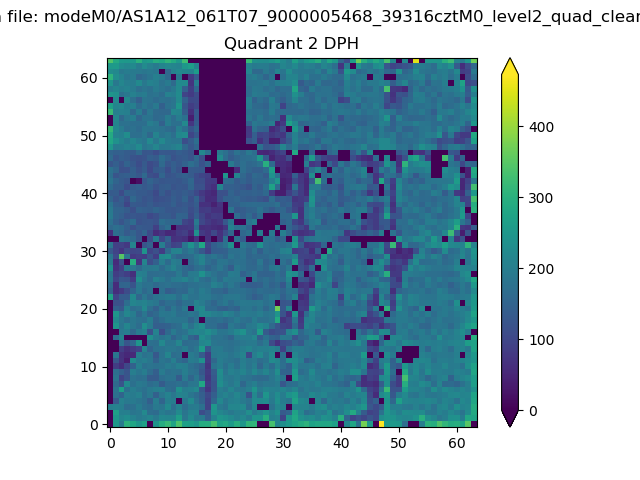
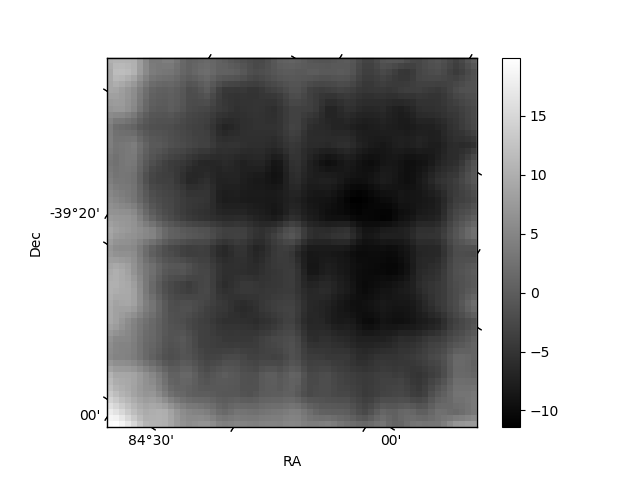
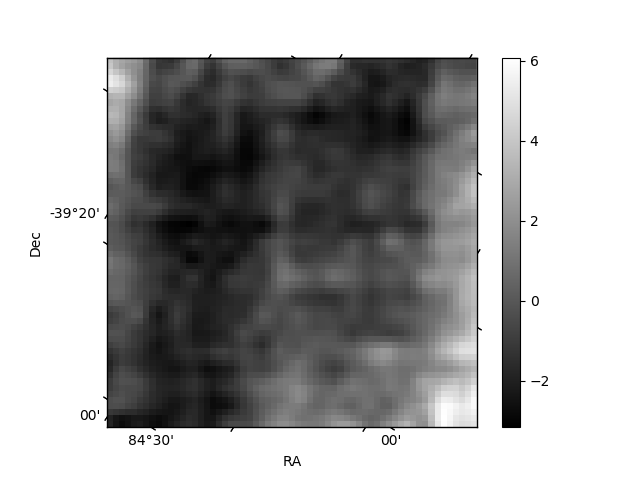
Histogram calculated using DETX and DETY for each event in the final _common_clean file
| Quadrant A | 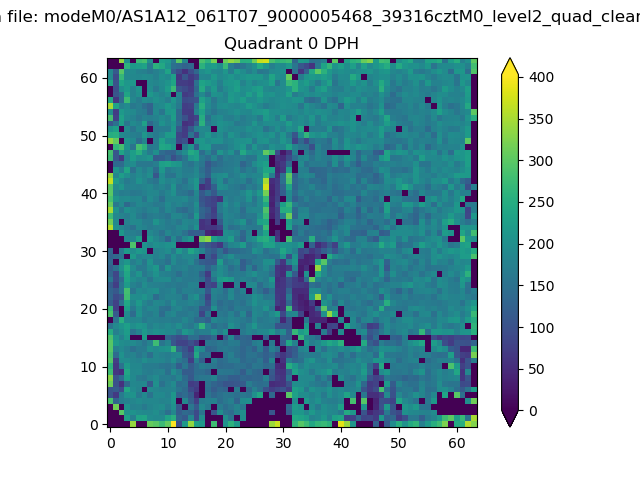 |
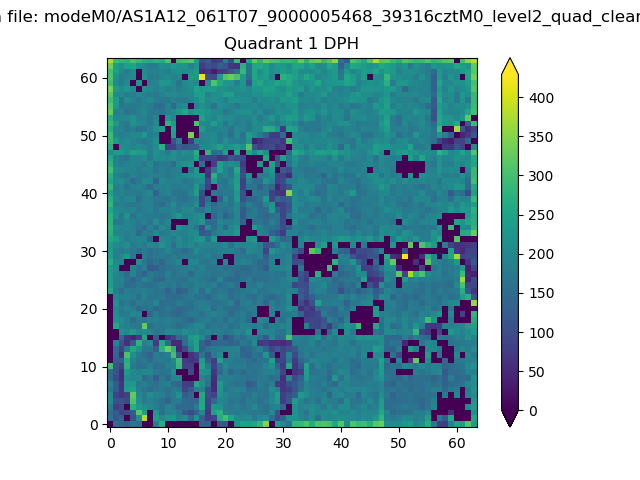 |
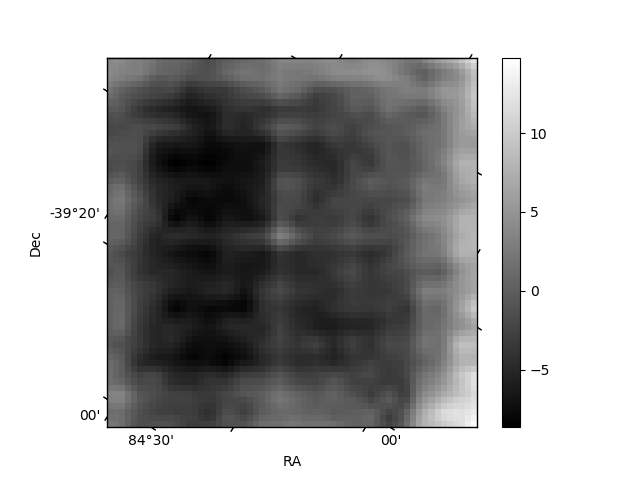
Quadrant B |
|---|---|---|---|
| Quadrant D | 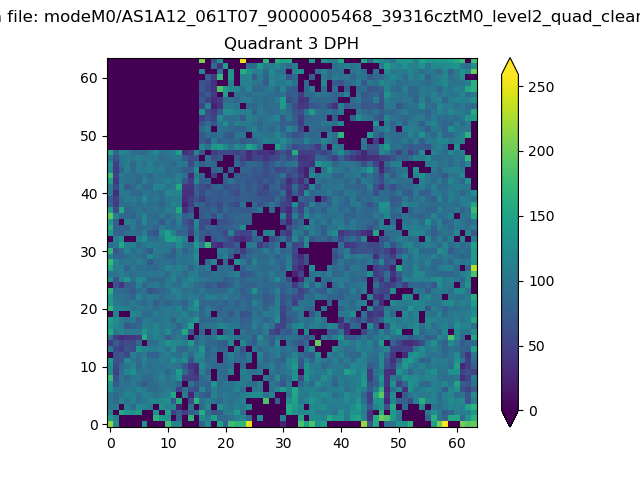 |
 |
Quadrant C |
| Plot type | Count rate plots | Images |
|---|---|---|
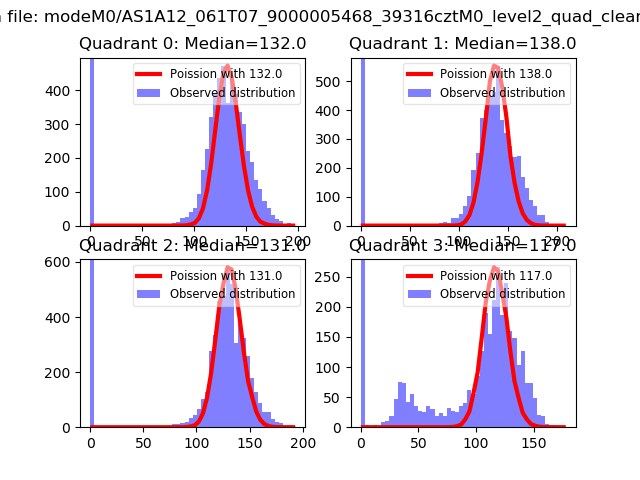
| Comparison with Poisson distribution Blue bars denote a histogram of data divided into 1 sec bins. Red curve is a Poisson curve with rate = median count rate of data. |
 |
 |
| Quadrant-wise count rates Data is divided into 100 sec bins |
 |
|
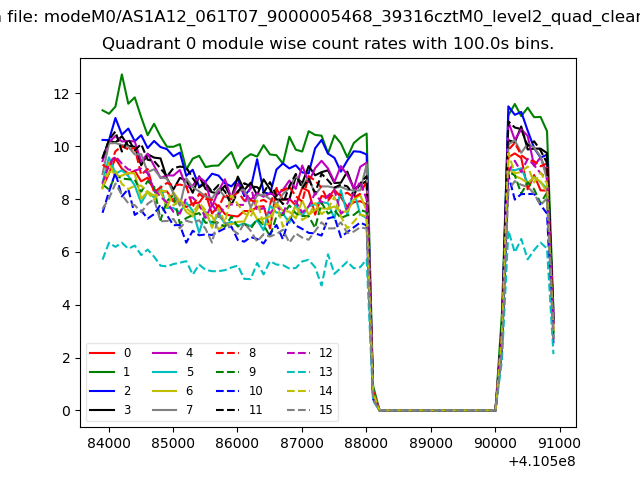
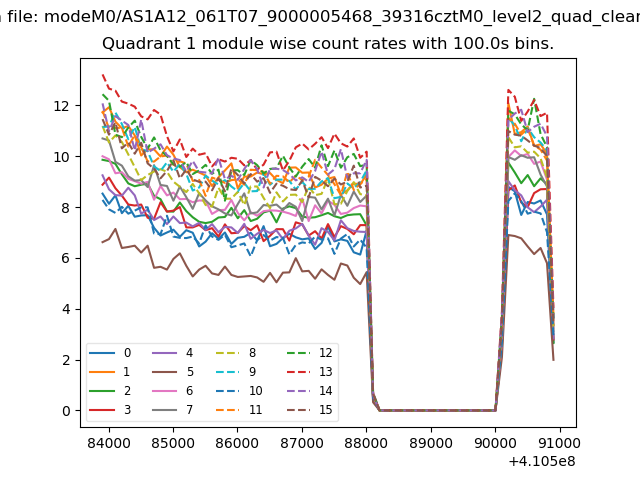
| Module-wise count rates for Quadrant A Data is divided into 100 sec bins |
 |
 |
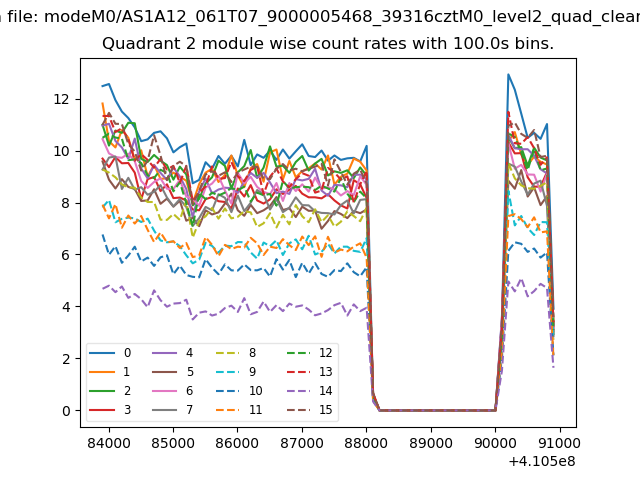
| Module-wise count rates for Quadrant B Data is divided into 100 sec bins |
 |
 |
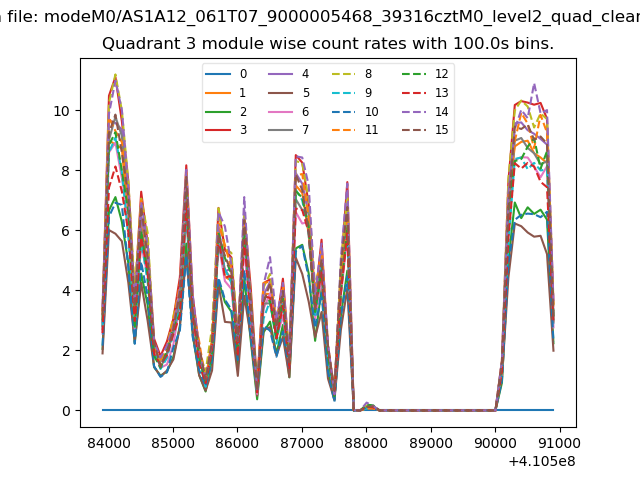
| Module-wise count rates for Quadrant C Data is divided into 100 sec bins |
 |
 |
| Module-wise count rates for Quadrant D Data is divided into 100 sec bins |
 |
 |
| Parameter | Plot |
|---|---|
| CZT HV Monitor | 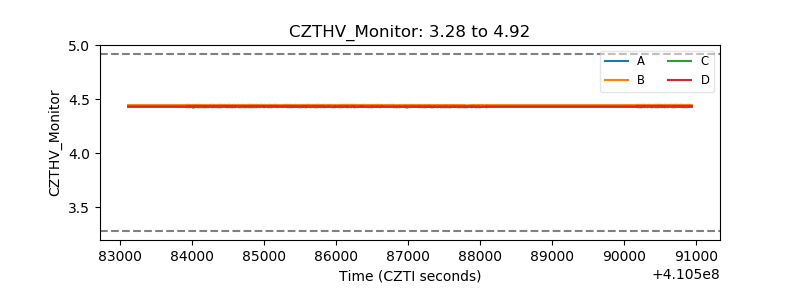 |
| D_VDD | 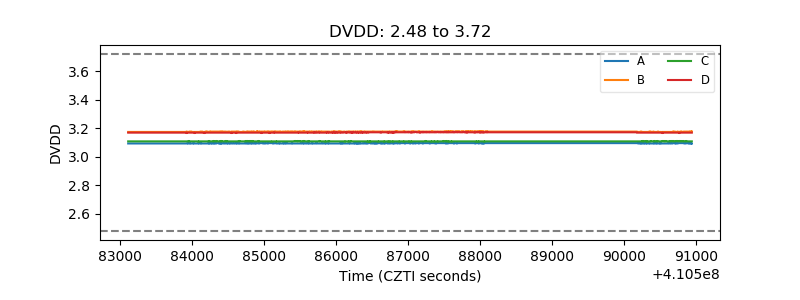 |
| Temperature 1 | 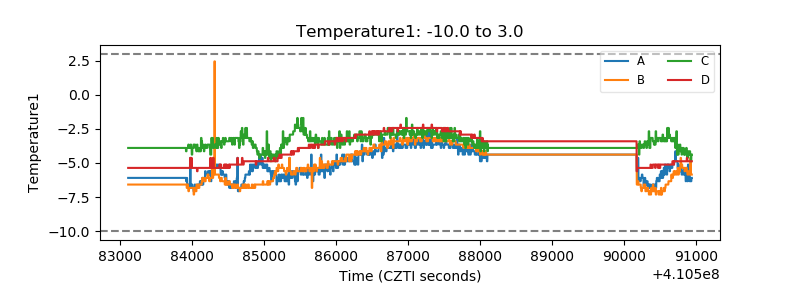 |
| Veto HV Monitor | 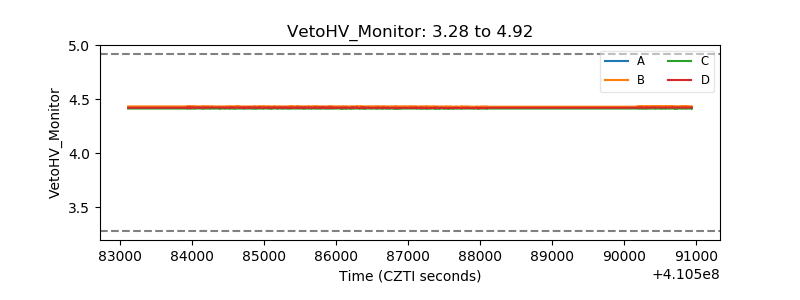 |
| Veto LLD | 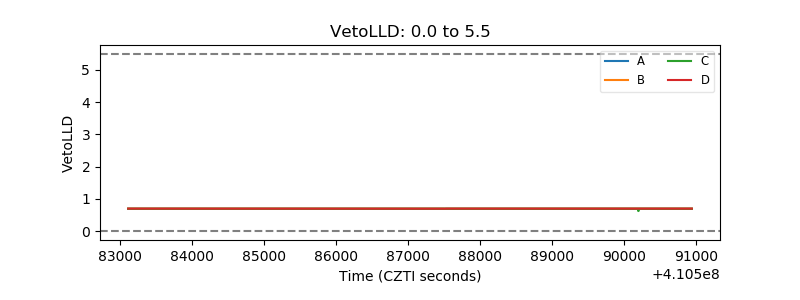 |
| Alpha Counter | 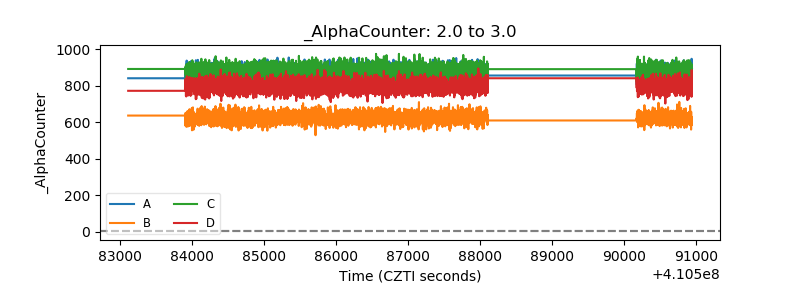 |
| _CPM_Rate | 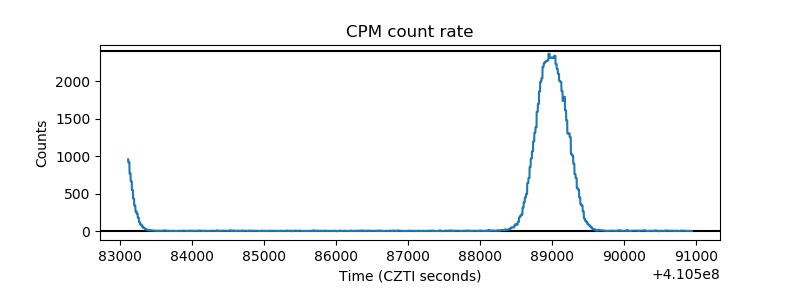 |
| CZT Counter | 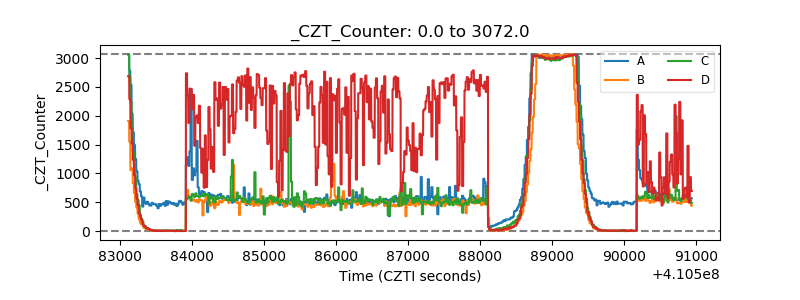 |
| +2.5 Volts monitor |  |
| +5 Volts monitor |  |
| _ROLL_ROT | 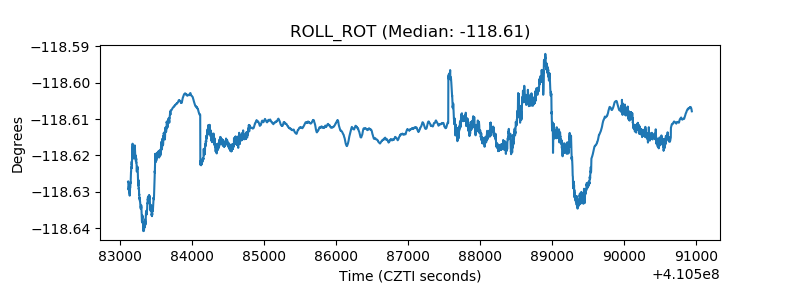 |
| _Roll_DEC | 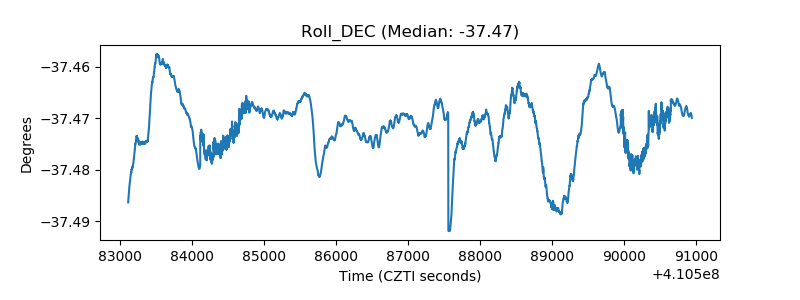 |
| _Roll_RA |  |
| Veto Counter | 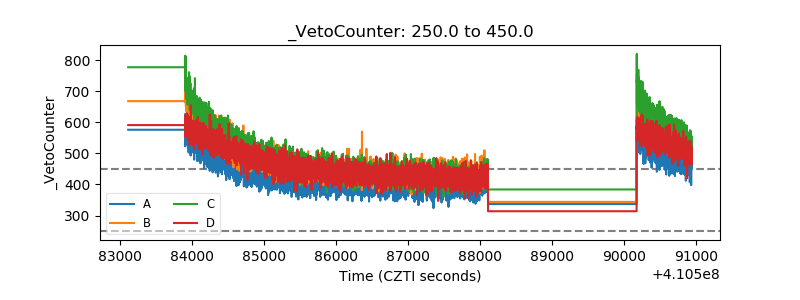 |