| Param | Original file | Final file |
|---|---|---|
| Filename | modeM0/AS1A12_061T07_9000005468_39317cztM0_level2.fits | modeM0/AS1A12_061T07_9000005468_39317cztM0_level2_quad_clean.evt |
| Size (bytes) | 1,224,501,120 | 235,702,080 |
| Size | 1.1 GB | 224.8 MB |
| Events in quadrant A | 7,563,900 | 1,718,946 |
| Events in quadrant B | 6,591,208 | 1,792,902 |
| Events in quadrant C | 7,381,461 | 1,684,001 |
| Events in quadrant D | 22,754,229 | 1,015,558 |
| Mode M9 | |||
|---|---|---|---|
| Quadrant | BADHDUFLAG | Total packets | Discarded packets |
| A | 0 | 62 | 0 |
| B | 0 | 62 | 0 |
| C | 0 | 62 | 0 |
| D | 0 | 62 | 0 |
| Mode SS | |||
|---|---|---|---|
| Quadrant | BADHDUFLAG | Total packets | Discarded packets |
| A | 0 | 274 | 0 |
| B | 0 | 274 | 0 |
| C | 0 | 274 | 0 |
| D | 0 | 274 | 0 |
| Mode M0 | |||
|---|---|---|---|
| Quadrant | BADHDUFLAG | Total packets | Discarded packets |
| A | 0 | 29908 | 5 |
| B | 0 | 27418 | 4 |
| C | 0 | 29315 | 4 |
| D | 0 | 76988 | 4 |
| Quadrant | Total seconds | Saturated seconds | Saturation percentage |
|---|---|---|---|
| A | 13404 | 63 | 0.470009% |
| B | 13404 | 24 | 0.179051% |
| C | 13404 | 67 | 0.499851% |
| D | 13404 | 5404 | 40.316323% |
Noise dominated data is calculated using 1-second bins in cleaned event files. If a bin has >2000 counts, and if more than 50% of those come from <1% of pixels, then it is considered to be noise-dominated and hence unusable.
| Quadrant | # 1 sec bins | Bins with >0 counts | Bins with >2000 counts | High rate bins dominated by noise | Noise dominated (total time) | Noise dominated (detector-on time) | Marked lightcurve |
|---|---|---|---|---|---|---|---|
| A | 19562 | 13407 | 35 | 35 | 0.18% | 0.26% | 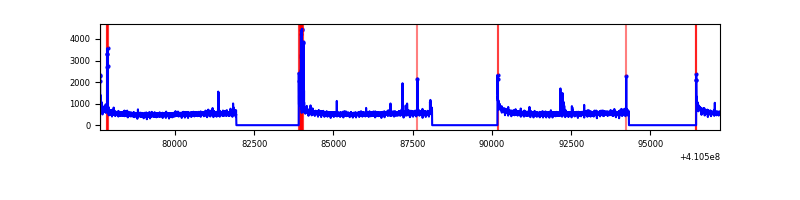 |
| B | 19562 | 13407 | 3 | 3 | 0.02% | 0.02% | 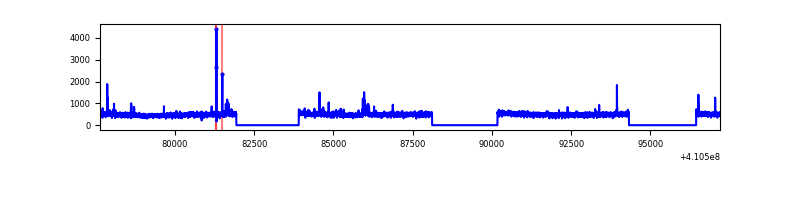 |
| C | 19562 | 13407 | 40 | 40 | 0.20% | 0.30% | 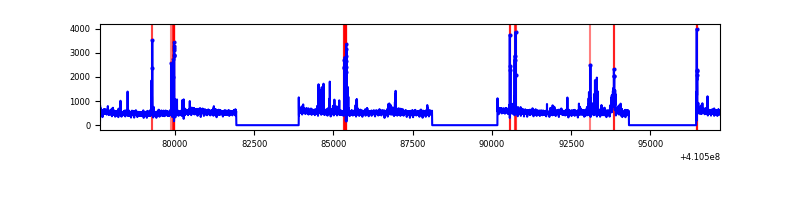 |
| D | 19562 | 13407 | 4713 | 4713 | 24.09% | 35.15% |  |
Top three noisy pixels from each quadrant. If the there are fewer than three noisy pixels in the level2.evt file, extra rows are filled as -1
| Pixel properties | Quadrant properties | ||||||
|---|---|---|---|---|---|---|---|
| Quadrant | DetID | PixID | Counts | Sigma | Mean | Median | Sigma |
| A | 10 | 83 | 937754 | 2894.07 | 1631 | 1607 | 323.5 |
| A | 13 | 248 | 219101 | 672.37 | 1631 | 1607 | 323.5 |
| A | 15 | 222 | 101320 | 308.26 | 1631 | 1607 | 323.5 |
| B | 5 | 255 | 64385 | 206.06 | 1632 | 1591 | 304.7 |
| B | 5 | 172 | 59684 | 190.63 | 1632 | 1591 | 304.7 |
| B | 0 | 230 | 39766 | 125.27 | 1632 | 1591 | 304.7 |
| C | 15 | 214 | 602003 | 1629.35 | 1604 | 1617 | 368.5 |
| C | 9 | 187 | 332026 | 896.68 | 1604 | 1617 | 368.5 |
| C | 14 | 254 | 169467 | 455.52 | 1604 | 1617 | 368.5 |
| D | 12 | 235 | 16273643 | 50465.08 | 1349 | 1317 | 322.4 |
| D | 13 | 249 | 642196 | 1987.55 | 1349 | 1317 | 322.4 |
| D | 12 | 227 | 340107 | 1050.68 | 1349 | 1317 | 322.4 |
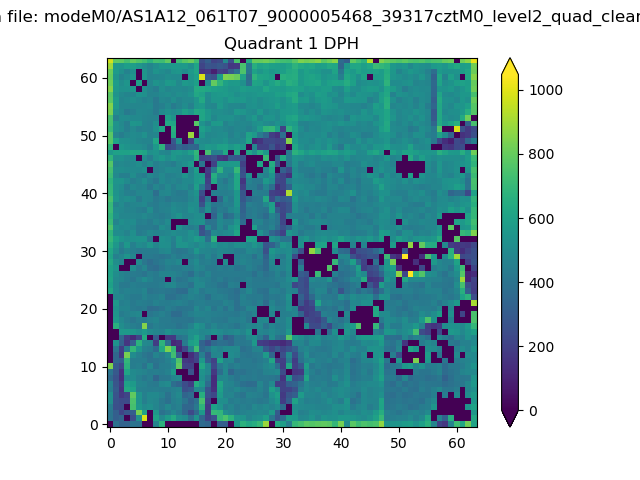
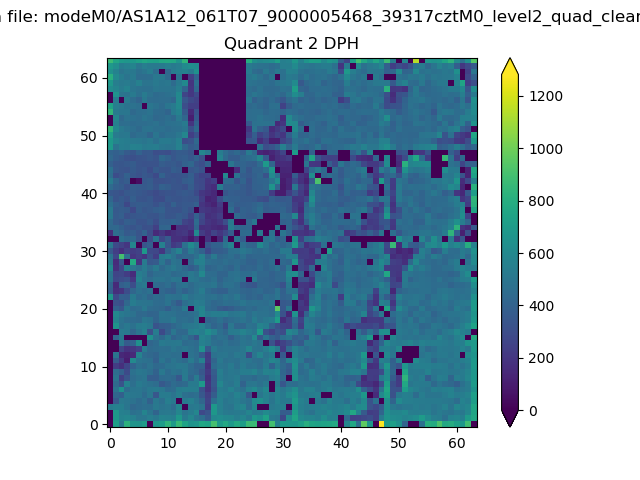
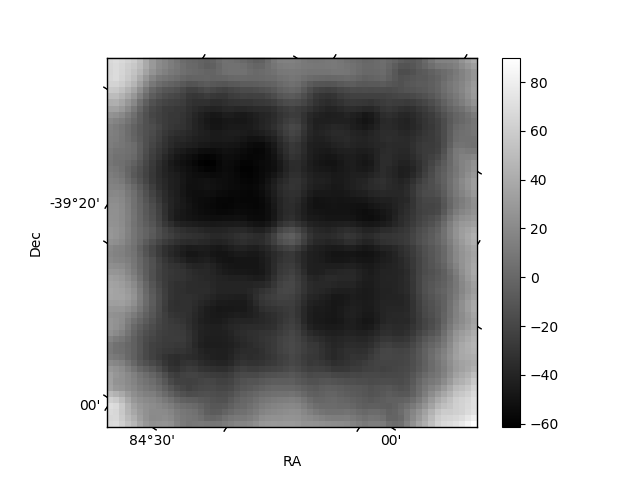
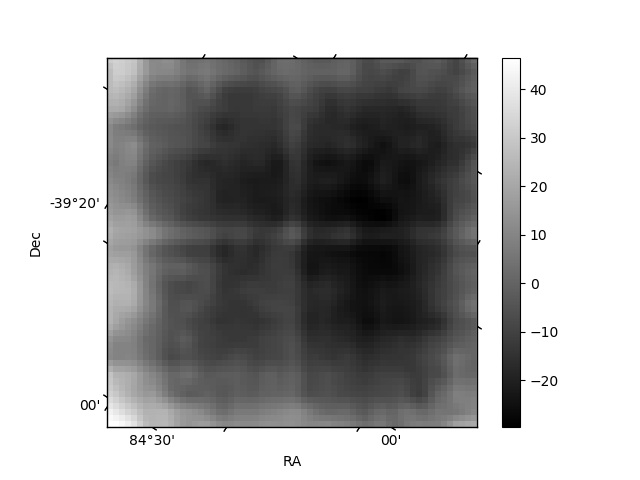
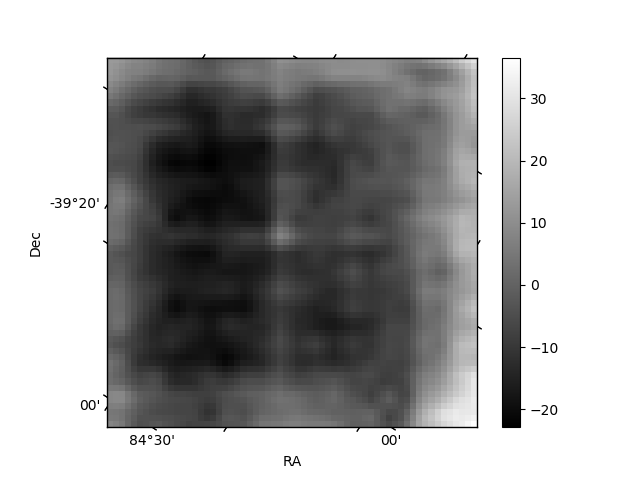
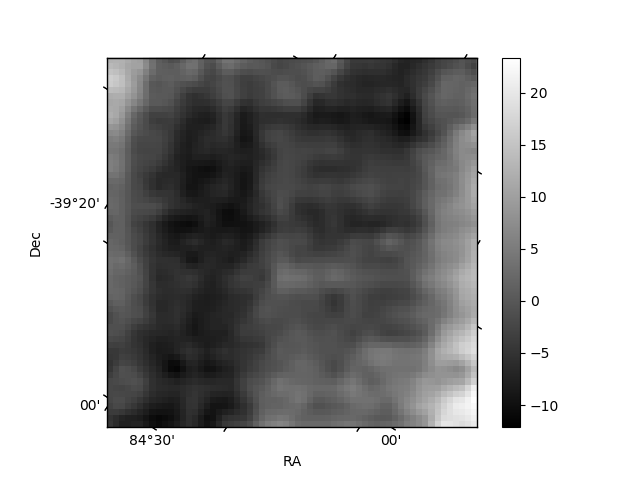
Histogram calculated using DETX and DETY for each event in the final _common_clean file
| Quadrant A | 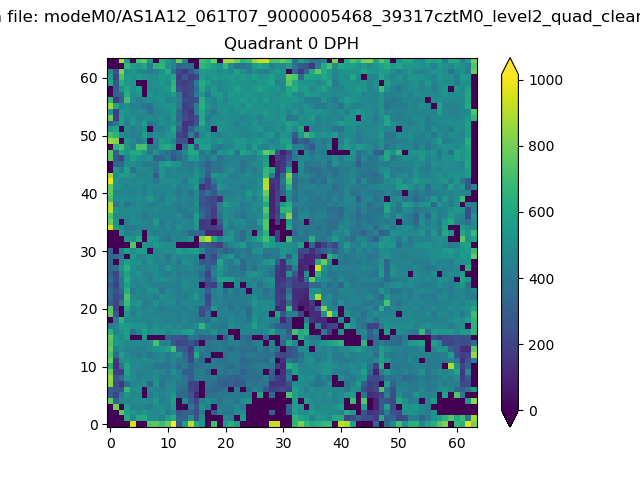 |
 |
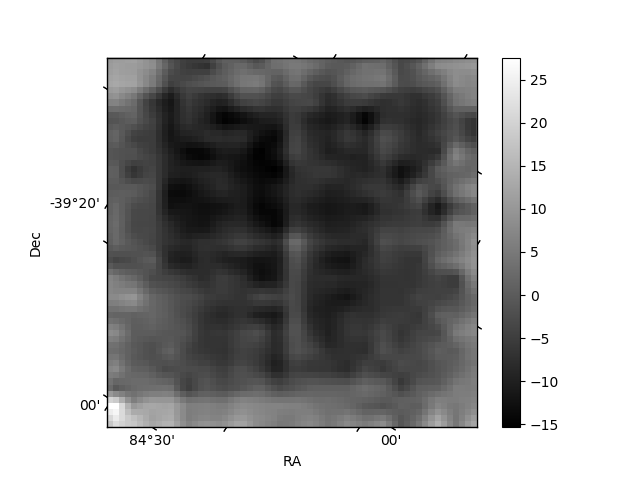
Quadrant B |
|---|---|---|---|
| Quadrant D | 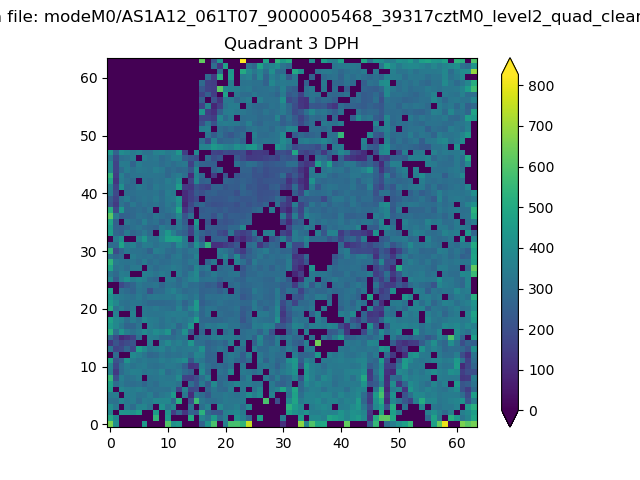 |
 |
Quadrant C |
| Plot type | Count rate plots | Images |
|---|---|---|
| Comparison with Poisson distribution Blue bars denote a histogram of data divided into 1 sec bins. Red curve is a Poisson curve with rate = median count rate of data. |
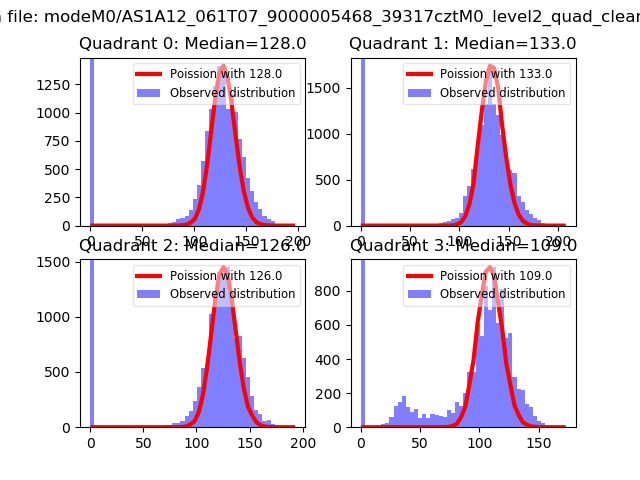 |
 |
| Quadrant-wise count rates Data is divided into 100 sec bins |
 |
|
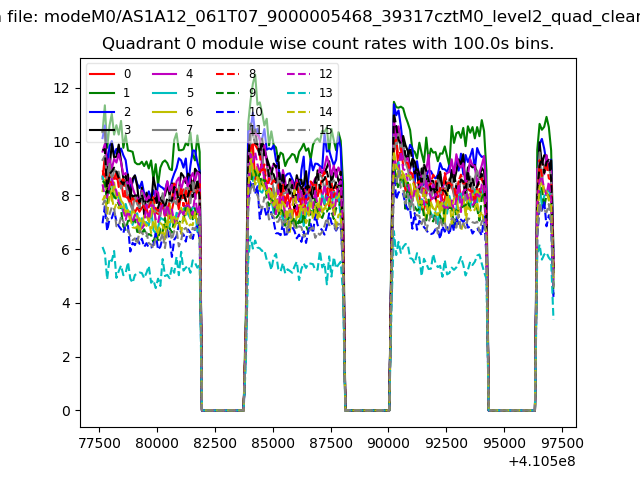
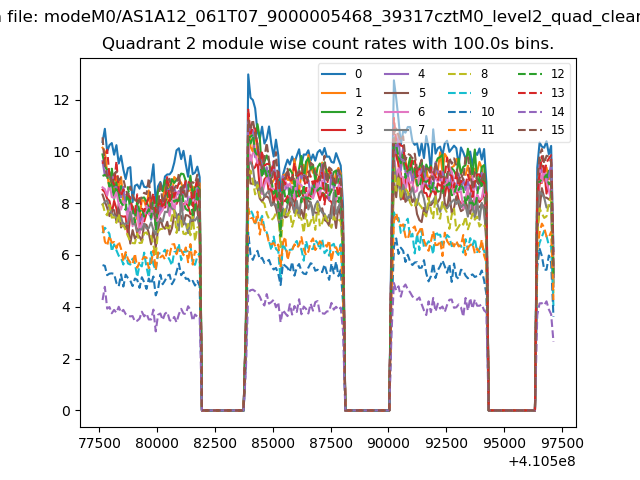
| Module-wise count rates for Quadrant A Data is divided into 100 sec bins |
 |
 |
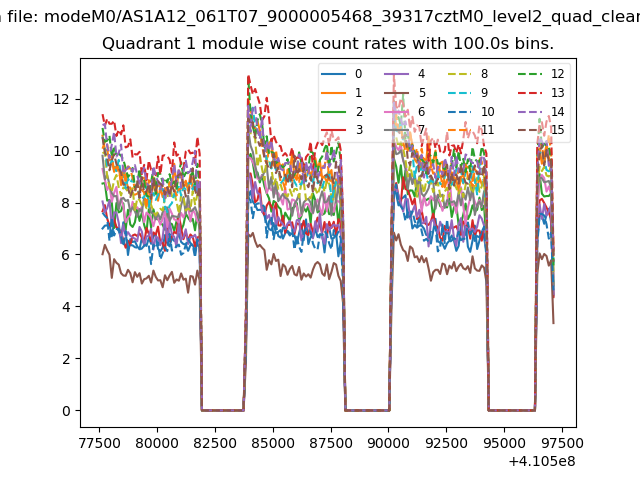
| Module-wise count rates for Quadrant B Data is divided into 100 sec bins |
 |
 |
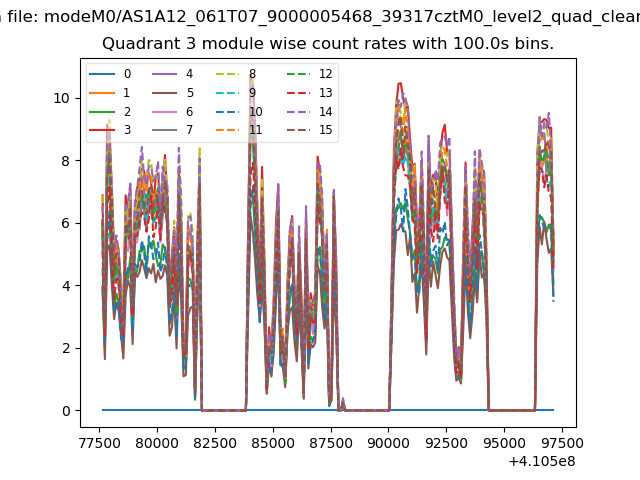
| Module-wise count rates for Quadrant C Data is divided into 100 sec bins |
 |
 |
| Module-wise count rates for Quadrant D Data is divided into 100 sec bins |
 |
 |
| Parameter | Plot |
|---|---|
| CZT HV Monitor | 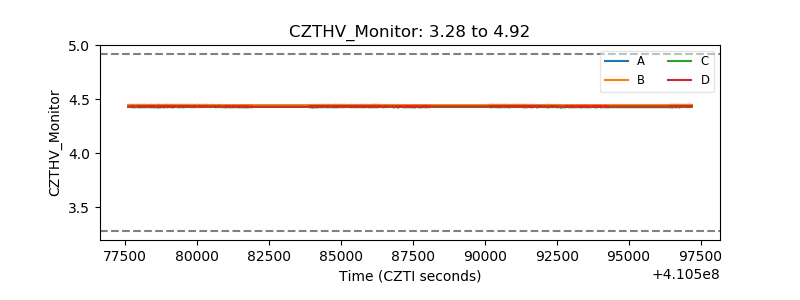 |
| D_VDD | 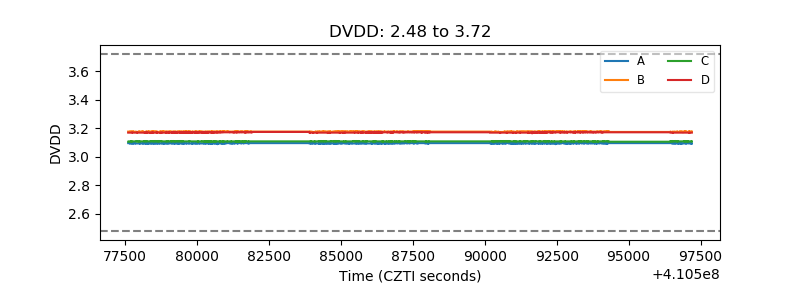 |
| Temperature 1 | 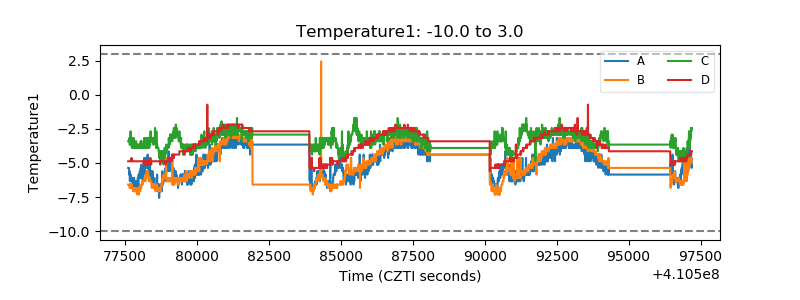 |
| Veto HV Monitor | 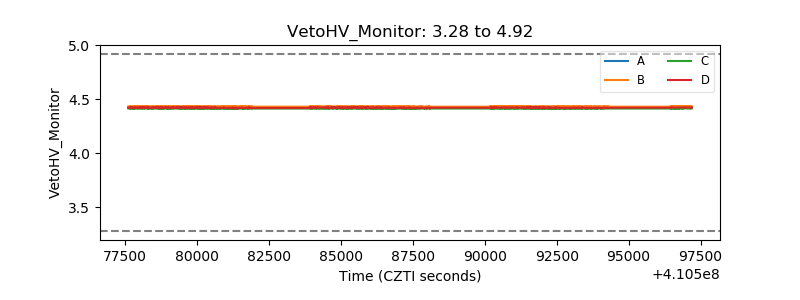 |
| Veto LLD | 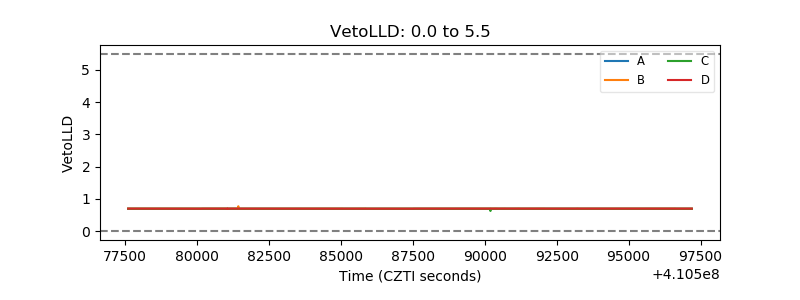 |
| Alpha Counter | 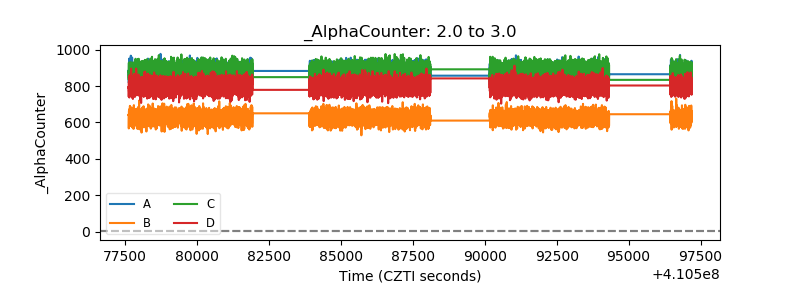 |
| _CPM_Rate | 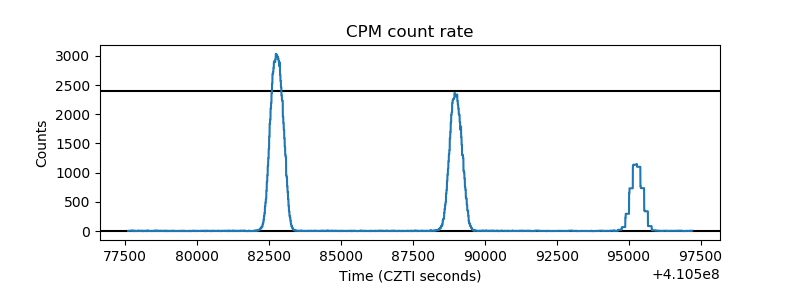 |
| CZT Counter | 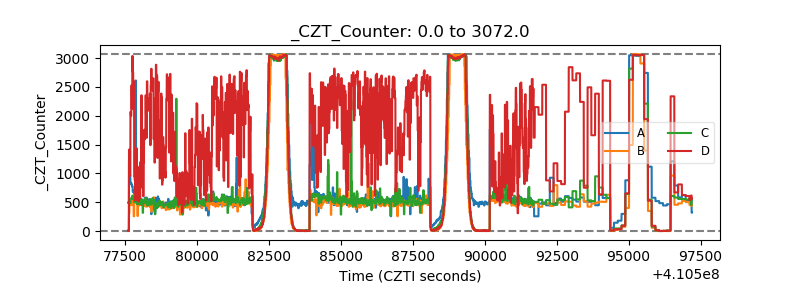 |
| +2.5 Volts monitor | 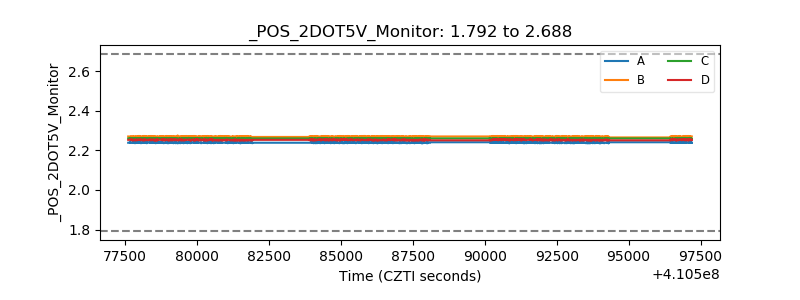 |
| +5 Volts monitor | 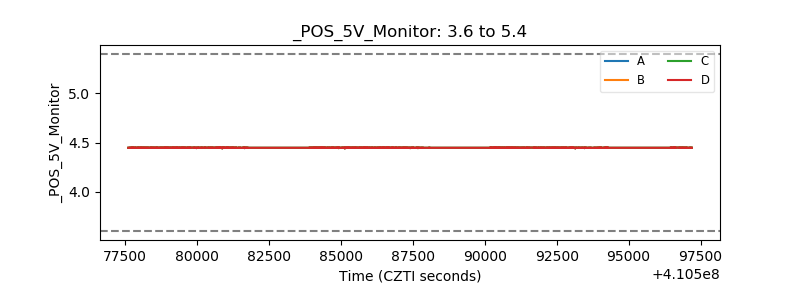 |
| _ROLL_ROT | 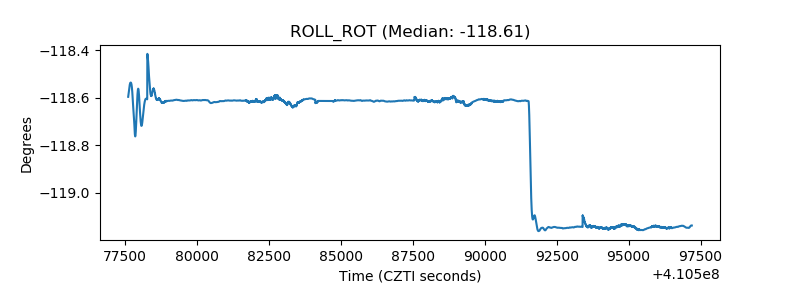 |
| _Roll_DEC | 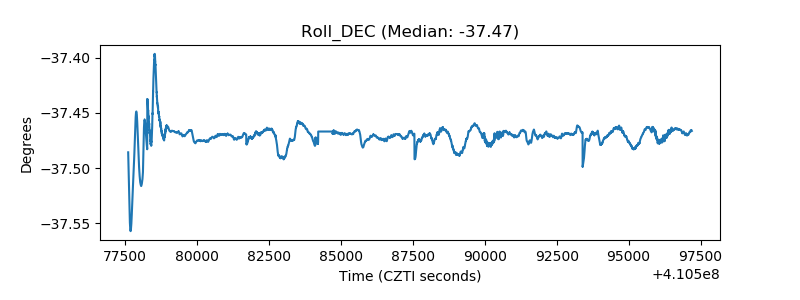 |
| _Roll_RA | 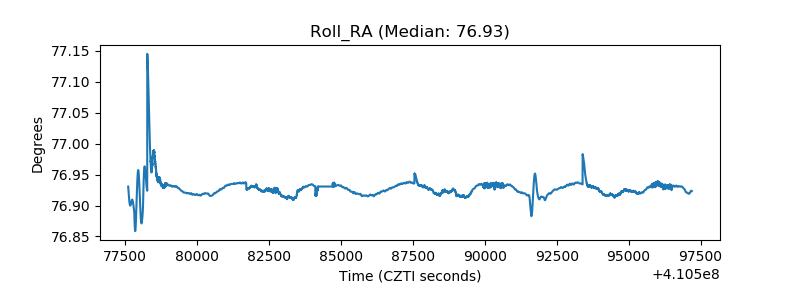 |
| Veto Counter | 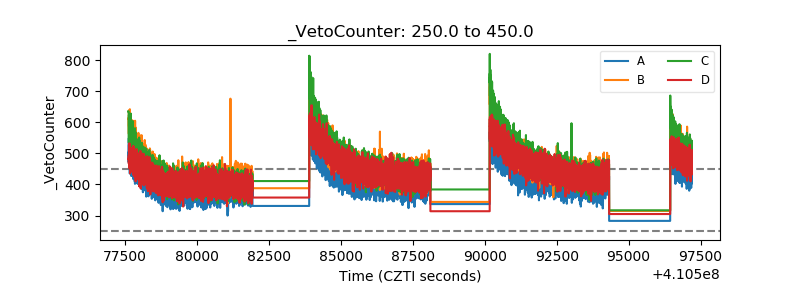 |