| Param | Original file | Final file |
|---|---|---|
| Filename | modeM0/AS1A12_061T07_9000005468_39318cztM0_level2.fits | modeM0/AS1A12_061T07_9000005468_39318cztM0_level2_quad_clean.evt |
| Size (bytes) | 337,080,960 | 91,880,640 |
| Size | 321.5 MB | 87.6 MB |
| Events in quadrant A | 2,832,085 | 622,839 |
| Events in quadrant B | 2,418,634 | 645,827 |
| Events in quadrant C | 2,663,984 | 616,109 |
| Events in quadrant D | 4,174,251 | 547,441 |
| Mode M9 | |||
|---|---|---|---|
| Quadrant | BADHDUFLAG | Total packets | Discarded packets |
| A | 0 | 32 | 0 |
| B | 0 | 32 | 0 |
| C | 0 | 32 | 0 |
| D | 0 | 33 | 0 |
| Mode SS | |||
|---|---|---|---|
| Quadrant | BADHDUFLAG | Total packets | Discarded packets |
| A | 0 | 102 | 0 |
| B | 0 | 102 | 0 |
| C | 0 | 102 | 0 |
| D | 0 | 102 | 0 |
| Mode M0 | |||
|---|---|---|---|
| Quadrant | BADHDUFLAG | Total packets | Discarded packets |
| A | 0 | 11221 | 2 |
| B | 0 | 10193 | 1 |
| C | 0 | 10696 | 1 |
| D | 0 | 15761 | 1 |
| Quadrant | Total seconds | Saturated seconds | Saturation percentage |
|---|---|---|---|
| A | 4994 | 21 | 0.420505% |
| B | 4994 | 13 | 0.260312% |
| C | 4994 | 22 | 0.440529% |
| D | 4994 | 248 | 4.965959% |
Noise dominated data is calculated using 1-second bins in cleaned event files. If a bin has >2000 counts, and if more than 50% of those come from <1% of pixels, then it is considered to be noise-dominated and hence unusable.
| Quadrant | # 1 sec bins | Bins with >0 counts | Bins with >2000 counts | High rate bins dominated by noise | Noise dominated (total time) | Noise dominated (detector-on time) | Marked lightcurve |
|---|---|---|---|---|---|---|---|
| A | 7086 | 4995 | 10 | 10 | 0.14% | 0.20% | 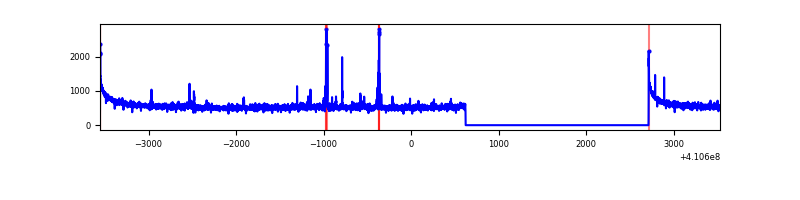 |
| B | 7086 | 4995 | 3 | 3 | 0.04% | 0.06% | 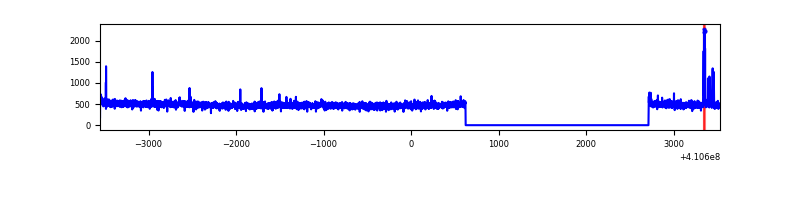 |
| C | 7086 | 4995 | 10 | 10 | 0.14% | 0.20% | 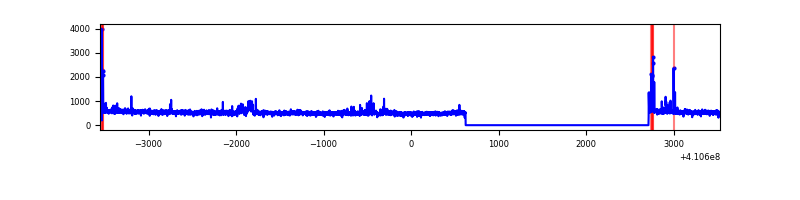 |
| D | 7086 | 4995 | 240 | 240 | 3.39% | 4.80% | 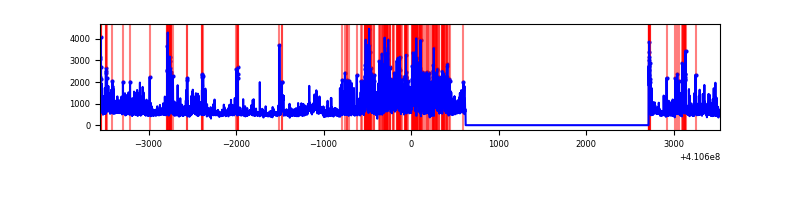 |
Top three noisy pixels from each quadrant. If the there are fewer than three noisy pixels in the level2.evt file, extra rows are filled as -1
| Pixel properties | Quadrant properties | ||||||
|---|---|---|---|---|---|---|---|
| Quadrant | DetID | PixID | Counts | Sigma | Mean | Median | Sigma |
| A | 10 | 83 | 411079 | 3441.91 | 596 | 585 | 119.3 |
| A | 13 | 248 | 68571 | 570.05 | 596 | 585 | 119.3 |
| A | 15 | 222 | 42175 | 348.72 | 596 | 585 | 119.3 |
| B | 0 | 190 | 33190 | 290.14 | 593 | 578 | 112.4 |
| B | 5 | 172 | 31063 | 271.22 | 593 | 578 | 112.4 |
| B | 5 | 184 | 17065 | 146.68 | 593 | 578 | 112.4 |
| C | 15 | 214 | 228284 | 1682.52 | 586 | 590 | 135.3 |
| C | 9 | 187 | 74136 | 543.46 | 586 | 590 | 135.3 |
| C | 14 | 254 | 72666 | 532.6 | 586 | 590 | 135.3 |
| D | 12 | 235 | 1613172 | 11449.59 | 575 | 558 | 140.8 |
| D | 2 | 249 | 188186 | 1332.16 | 575 | 558 | 140.8 |
| D | 12 | 227 | 51912 | 364.61 | 575 | 558 | 140.8 |
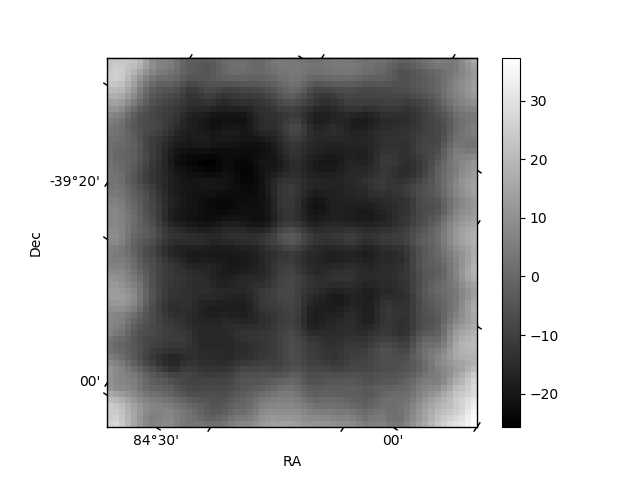
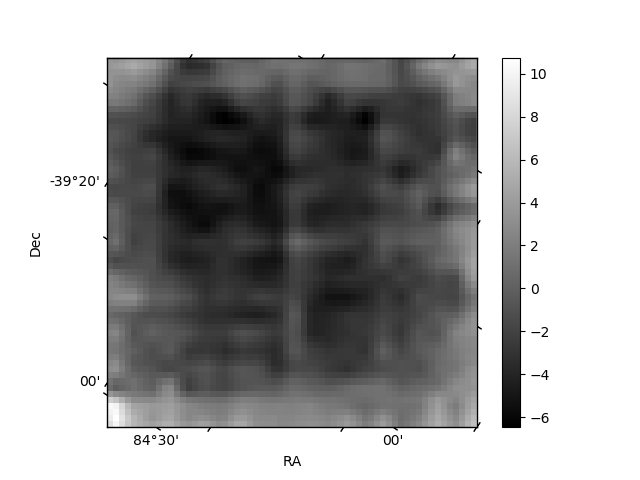
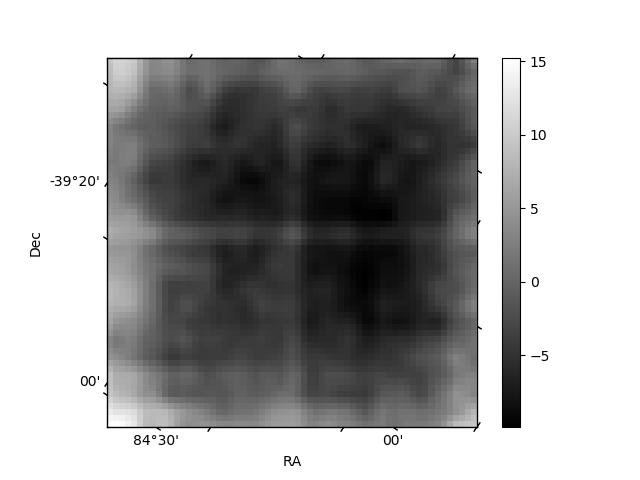
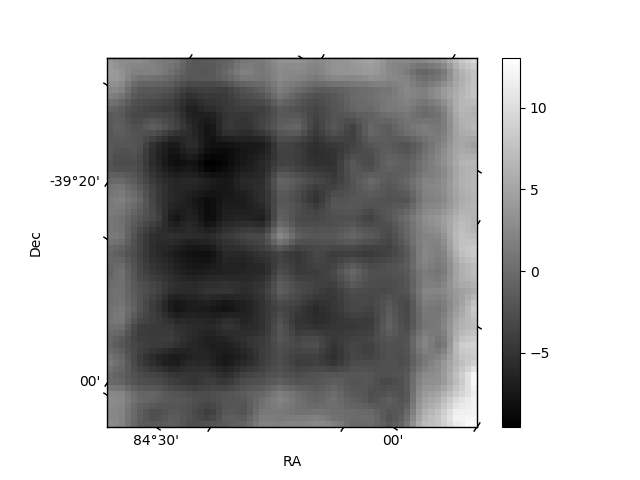
Histogram calculated using DETX and DETY for each event in the final _common_clean file
| Quadrant A | 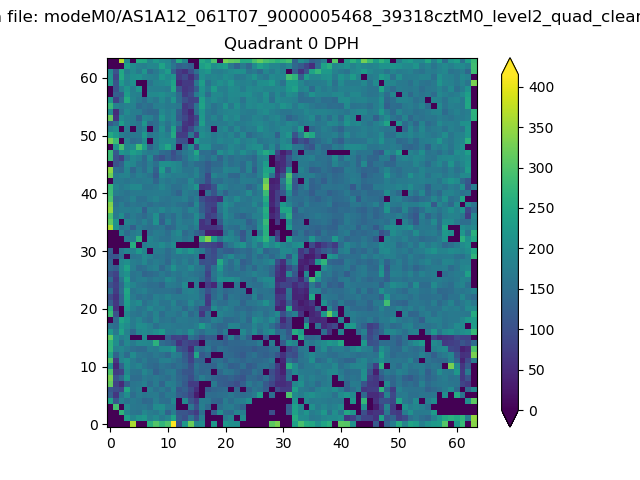 |
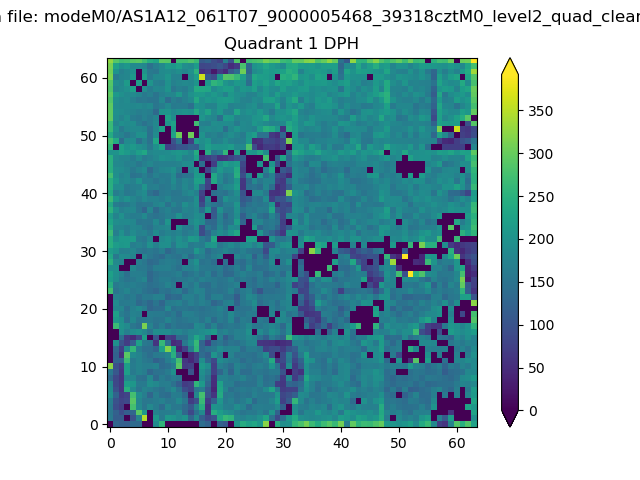 |
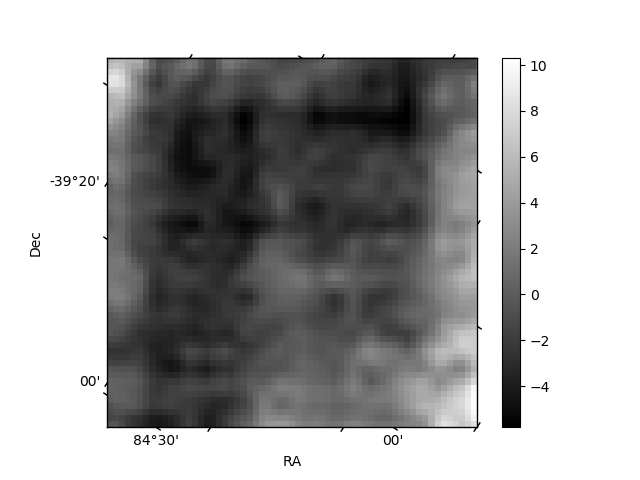
Quadrant B |
|---|---|---|---|
| Quadrant D | 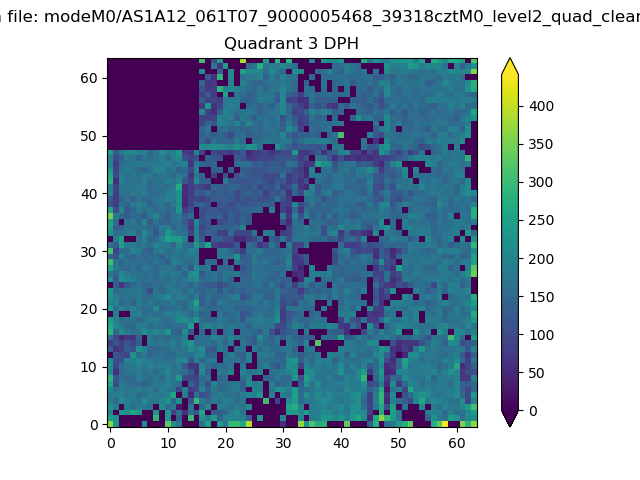 |
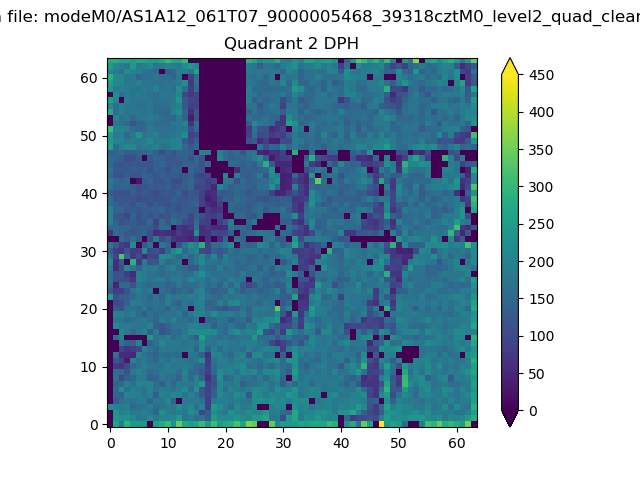 |
Quadrant C |
| Plot type | Count rate plots | Images |
|---|---|---|
| Comparison with Poisson distribution Blue bars denote a histogram of data divided into 1 sec bins. Red curve is a Poisson curve with rate = median count rate of data. |
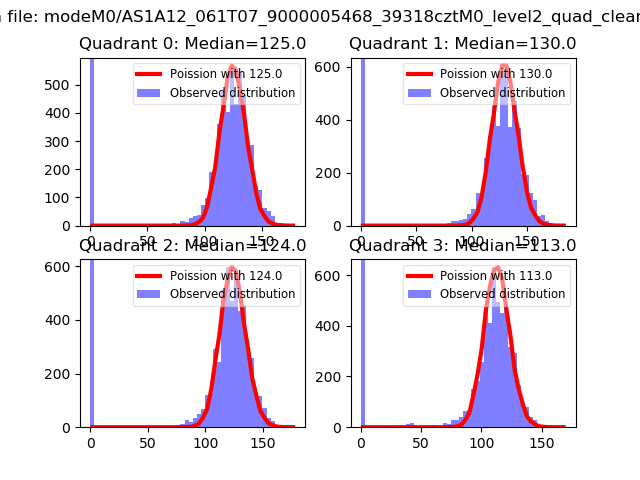 |
 |
| Quadrant-wise count rates Data is divided into 100 sec bins |
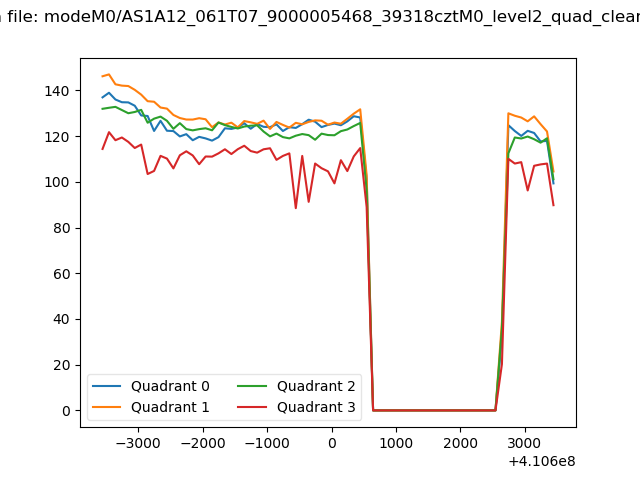 |
|
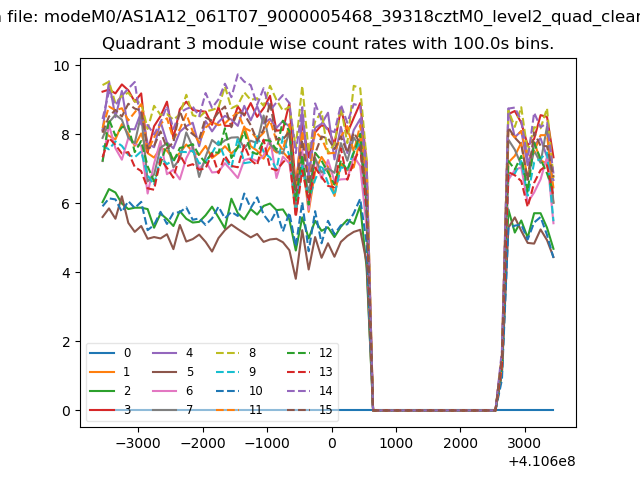
| Module-wise count rates for Quadrant A Data is divided into 100 sec bins |
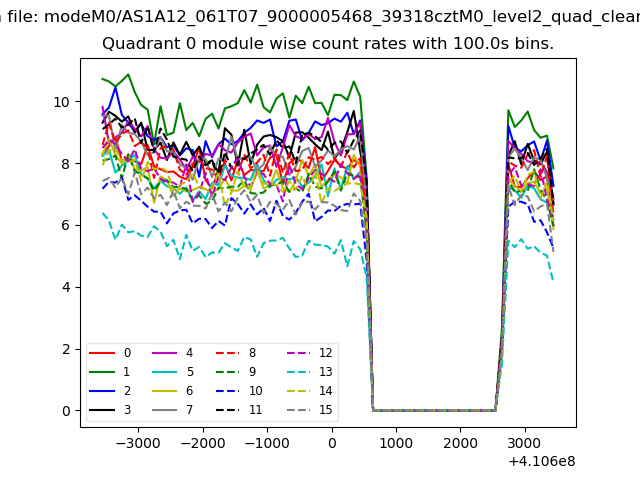 |
 |
| Module-wise count rates for Quadrant B Data is divided into 100 sec bins |
 |
 |
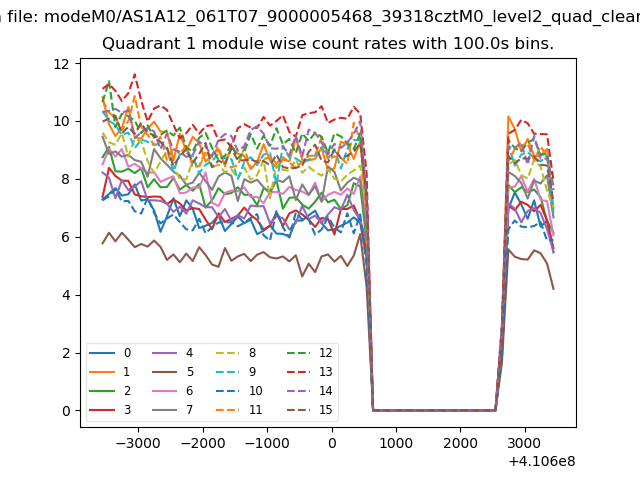
| Module-wise count rates for Quadrant C Data is divided into 100 sec bins |
 |
 |
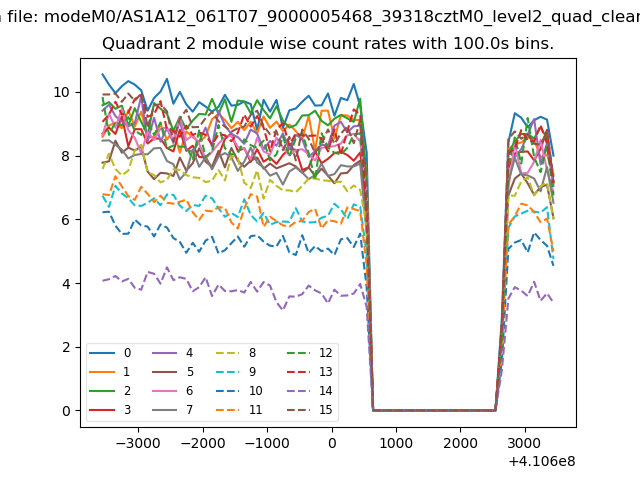
| Module-wise count rates for Quadrant D Data is divided into 100 sec bins |
 |
 |
| Parameter | Plot |
|---|---|
| CZT HV Monitor | 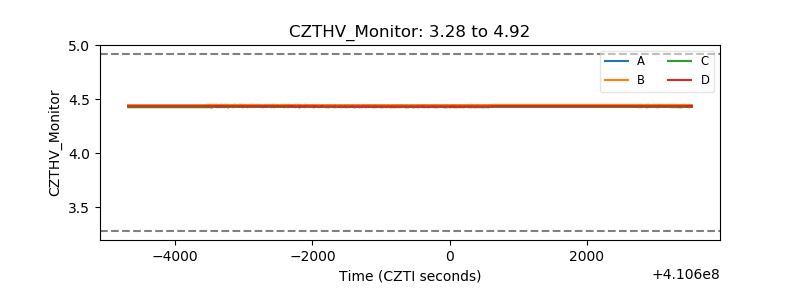 |
| D_VDD | 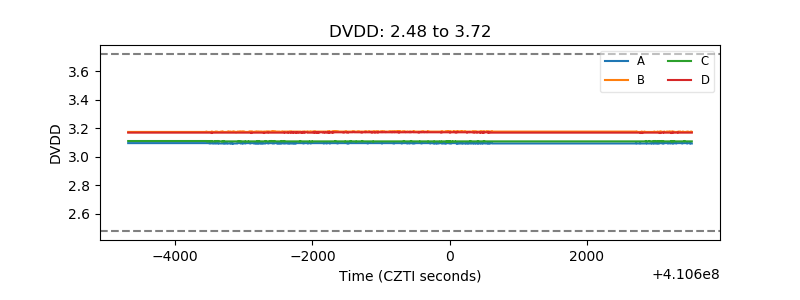 |
| Temperature 1 | 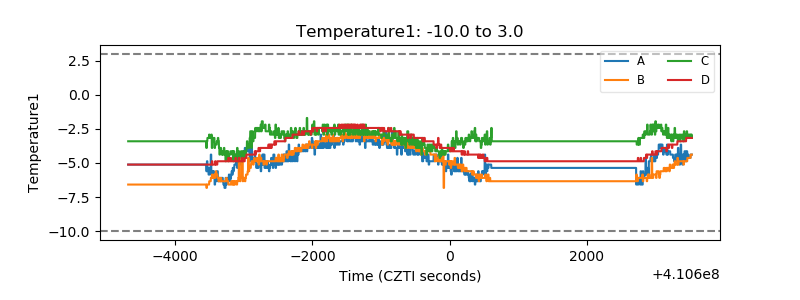 |
| Veto HV Monitor | 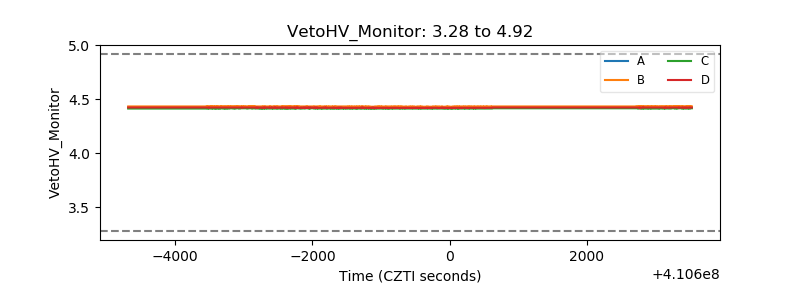 |
| Veto LLD | 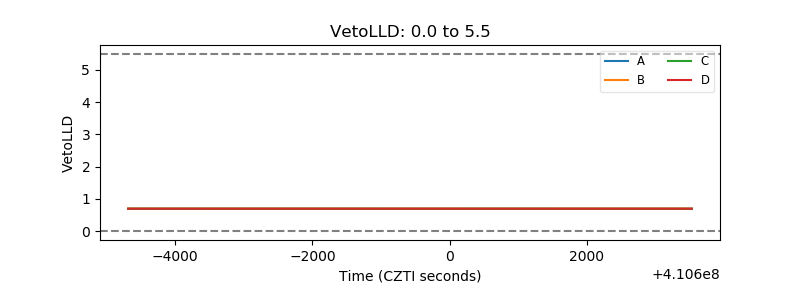 |
| Alpha Counter | 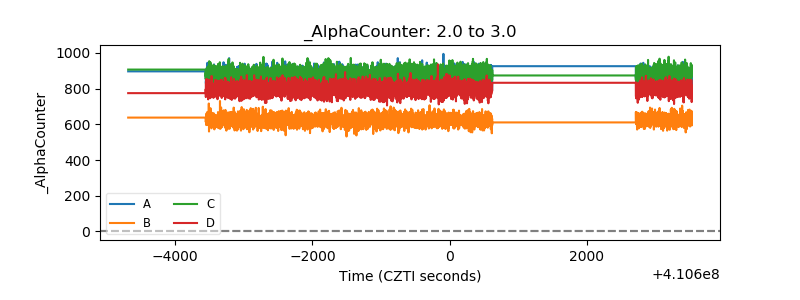 |
| _CPM_Rate | 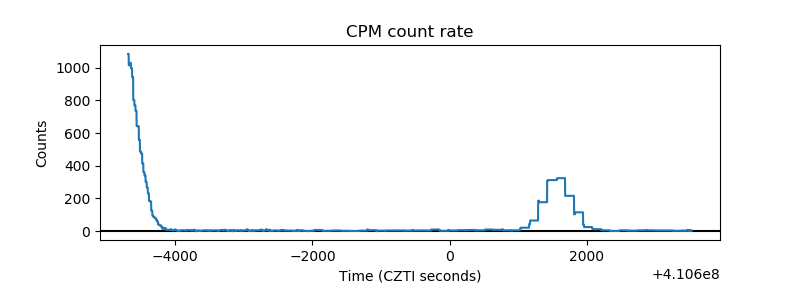 |
| CZT Counter | 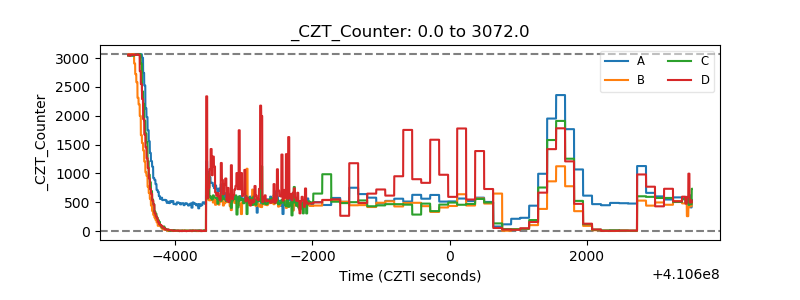 |
| +2.5 Volts monitor | 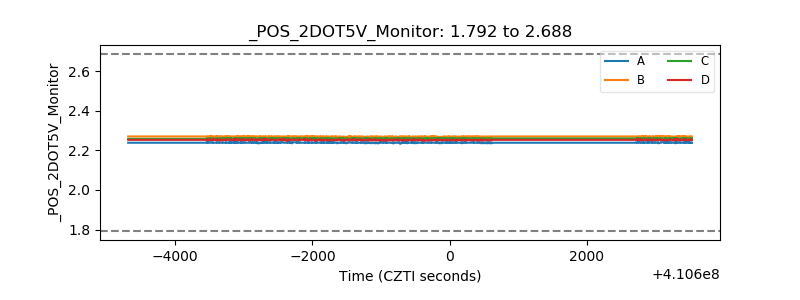 |
| +5 Volts monitor |  |
| _ROLL_ROT | 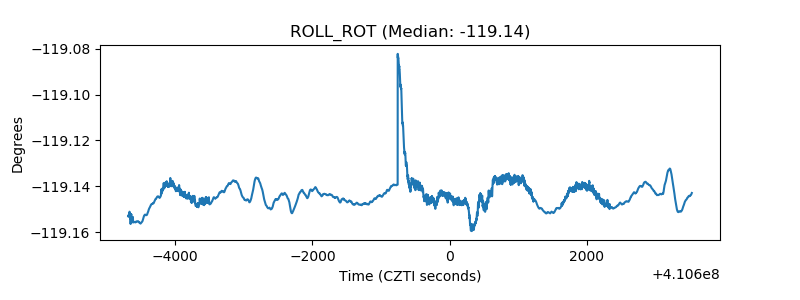 |
| _Roll_DEC | 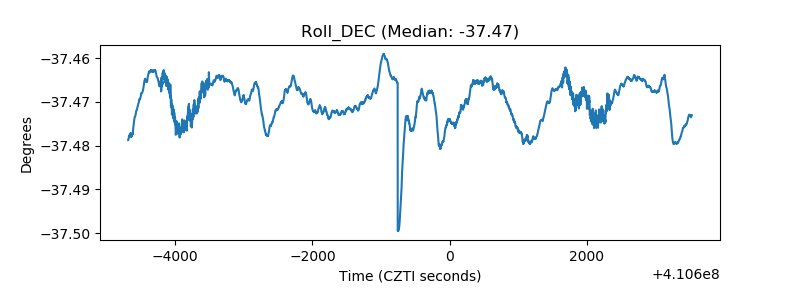 |
| _Roll_RA | 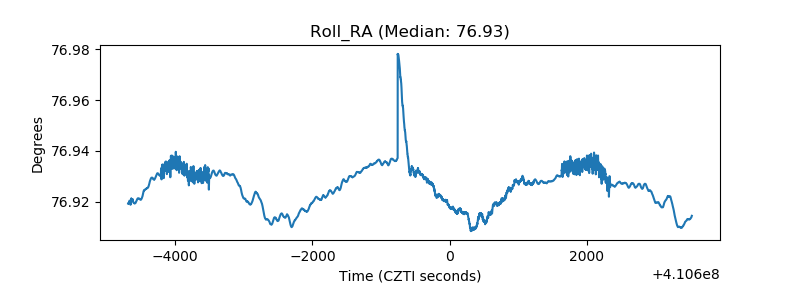 |
| Veto Counter | 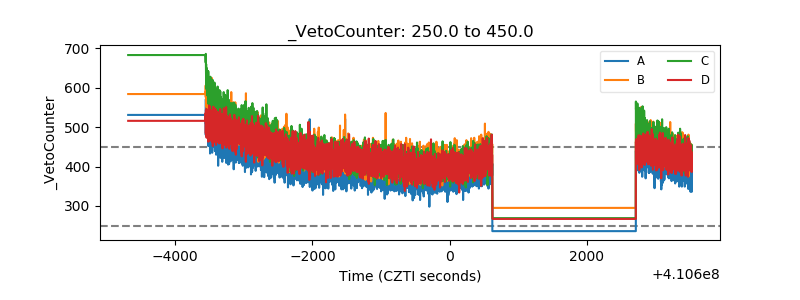 |