| Param | Original file | Final file |
|---|---|---|
| Filename | modeM0/AS1A12_061T07_9000005468_39320cztM0_level2.fits | modeM0/AS1A12_061T07_9000005468_39320cztM0_level2_quad_clean.evt |
| Size (bytes) | 477,239,040 | 88,686,720 |
| Size | 455.1 MB | 84.6 MB |
| Events in quadrant A | 2,925,744 | 628,091 |
| Events in quadrant B | 2,909,396 | 633,006 |
| Events in quadrant C | 2,779,503 | 618,774 |
| Events in quadrant D | 8,623,141 | 420,015 |
| Mode M9 | |||
|---|---|---|---|
| Quadrant | BADHDUFLAG | Total packets | Discarded packets |
| A | 0 | 32 | 0 |
| B | 0 | 32 | 0 |
| C | 0 | 32 | 0 |
| D | 0 | 33 | 0 |
| Mode SS | |||
|---|---|---|---|
| Quadrant | BADHDUFLAG | Total packets | Discarded packets |
| A | 0 | 112 | 0 |
| B | 0 | 112 | 0 |
| C | 0 | 112 | 0 |
| D | 0 | 112 | 0 |
| Mode M0 | |||
|---|---|---|---|
| Quadrant | BADHDUFLAG | Total packets | Discarded packets |
| A | 0 | 11999 | 3 |
| B | 0 | 12330 | 2 |
| C | 0 | 11590 | 2 |
| D | 0 | 29533 | 2 |
| Quadrant | Total seconds | Saturated seconds | Saturation percentage |
|---|---|---|---|
| A | 5509 | 25 | 0.453803% |
| B | 5509 | 112 | 2.033037% |
| C | 5509 | 28 | 0.508259% |
| D | 5509 | 1801 | 32.691959% |
Noise dominated data is calculated using 1-second bins in cleaned event files. If a bin has >2000 counts, and if more than 50% of those come from <1% of pixels, then it is considered to be noise-dominated and hence unusable.
| Quadrant | # 1 sec bins | Bins with >0 counts | Bins with >2000 counts | High rate bins dominated by noise | Noise dominated (total time) | Noise dominated (detector-on time) | Marked lightcurve |
|---|---|---|---|---|---|---|---|
| A | 7091 | 5510 | 12 | 12 | 0.17% | 0.22% | 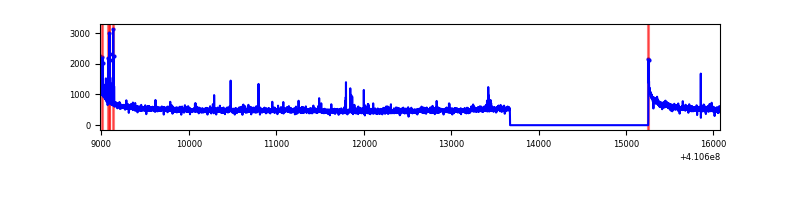 |
| B | 7091 | 5510 | 66 | 66 | 0.93% | 1.20% | 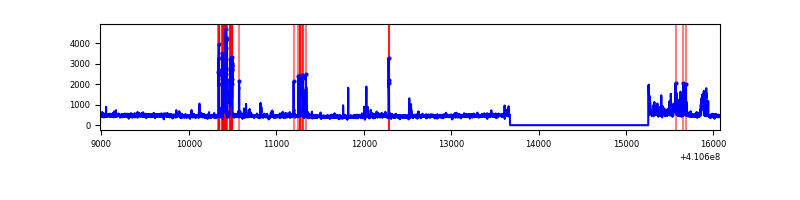 |
| C | 7091 | 5510 | 24 | 24 | 0.34% | 0.44% | 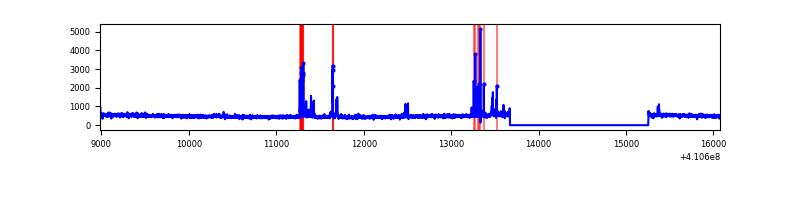 |
| D | 7091 | 5510 | 1606 | 1606 | 22.65% | 29.15% | 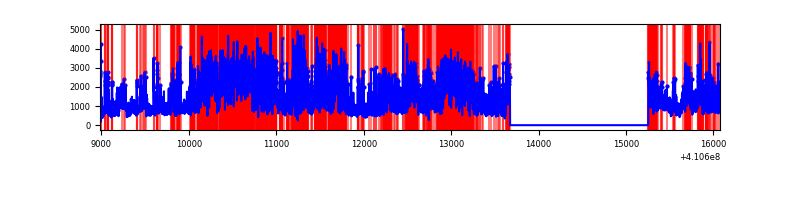 |
Top three noisy pixels from each quadrant. If the there are fewer than three noisy pixels in the level2.evt file, extra rows are filled as -1
| Pixel properties | Quadrant properties | ||||||
|---|---|---|---|---|---|---|---|
| Quadrant | DetID | PixID | Counts | Sigma | Mean | Median | Sigma |
| A | 10 | 83 | 434414 | 3431.11 | 620 | 609 | 126.4 |
| A | 13 | 248 | 56017 | 438.24 | 620 | 609 | 126.4 |
| A | 15 | 222 | 16573 | 126.26 | 620 | 609 | 126.4 |
| B | 0 | 183 | 234389 | 1983.67 | 610 | 594 | 117.9 |
| B | 5 | 184 | 186585 | 1578.07 | 610 | 594 | 117.9 |
| B | 5 | 255 | 41677 | 348.58 | 610 | 594 | 117.9 |
| C | 15 | 214 | 253053 | 1784.78 | 603 | 607 | 141.4 |
| C | 14 | 254 | 119524 | 840.74 | 603 | 607 | 141.4 |
| C | 9 | 187 | 38796 | 269.99 | 603 | 607 | 141.4 |
| D | 12 | 235 | 4845058 | 37396.01 | 529 | 514 | 129.5 |
| D | 12 | 227 | 1044062 | 8055.36 | 529 | 514 | 129.5 |
| D | 5 | 222 | 422457 | 3257.06 | 529 | 514 | 129.5 |
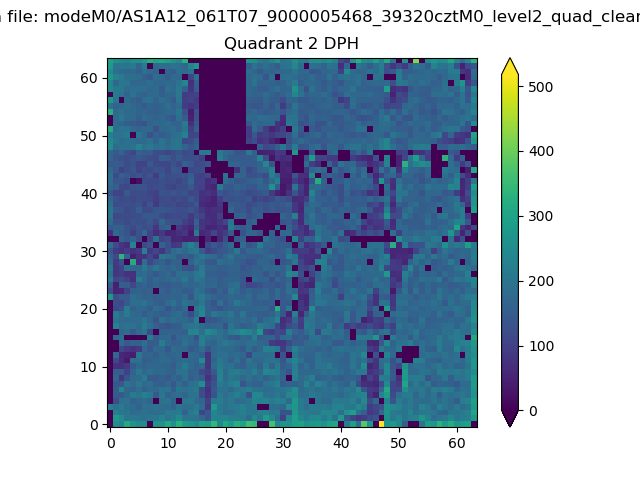
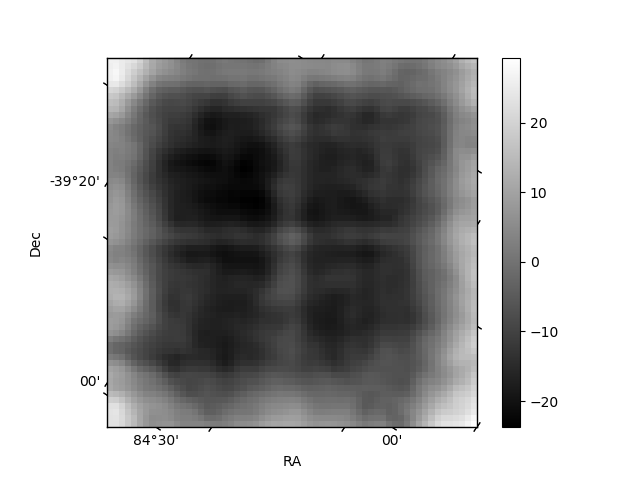
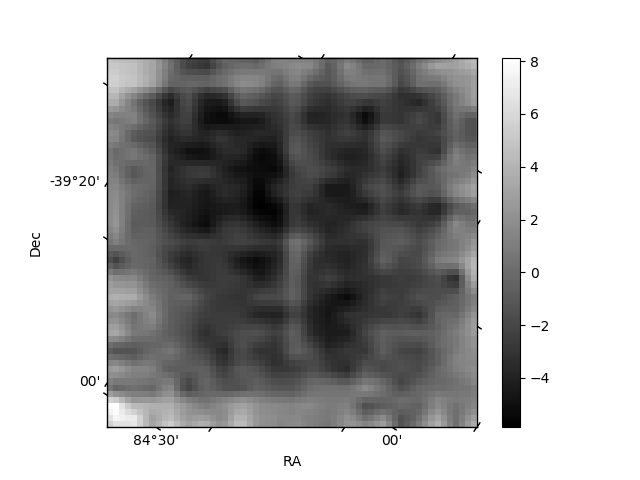
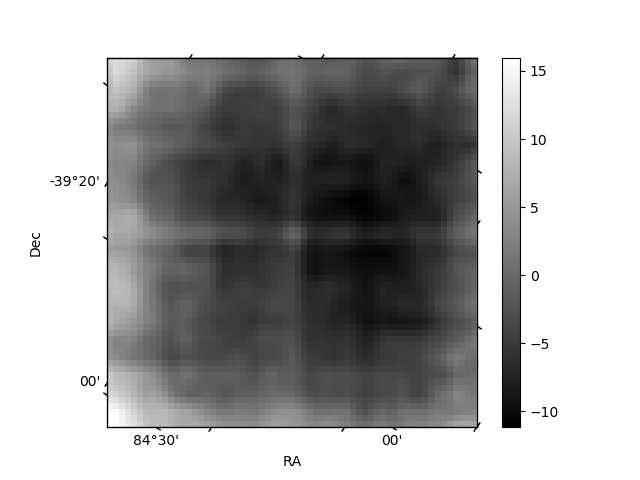
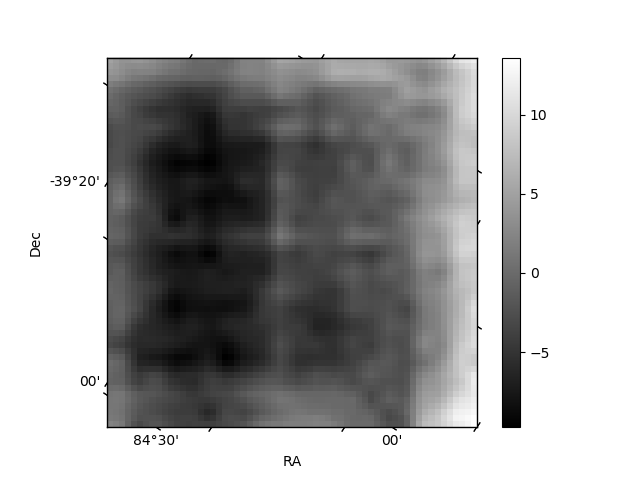
Histogram calculated using DETX and DETY for each event in the final _common_clean file
| Quadrant A | 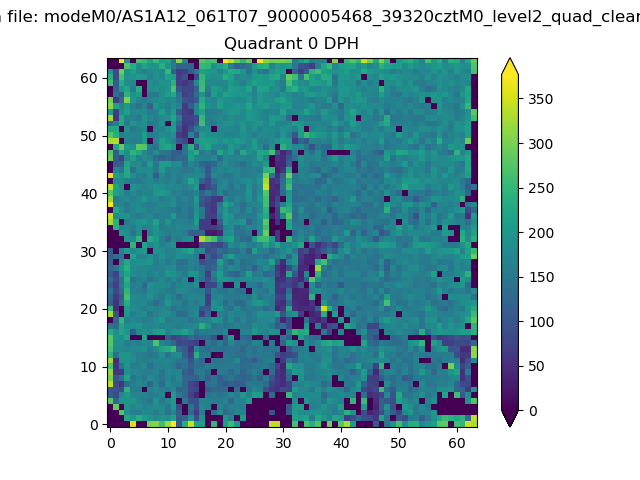 |
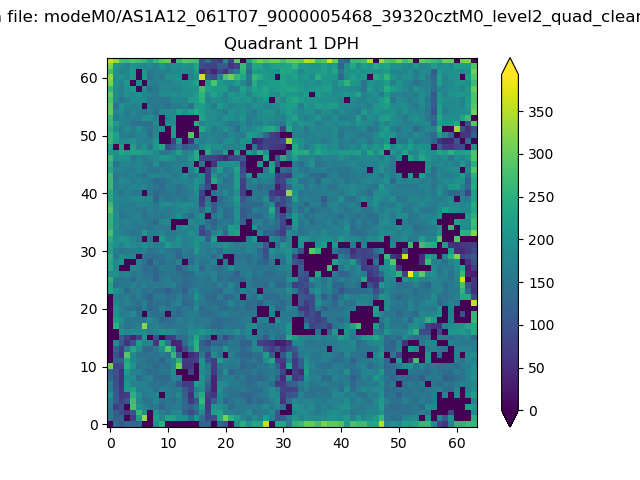 |
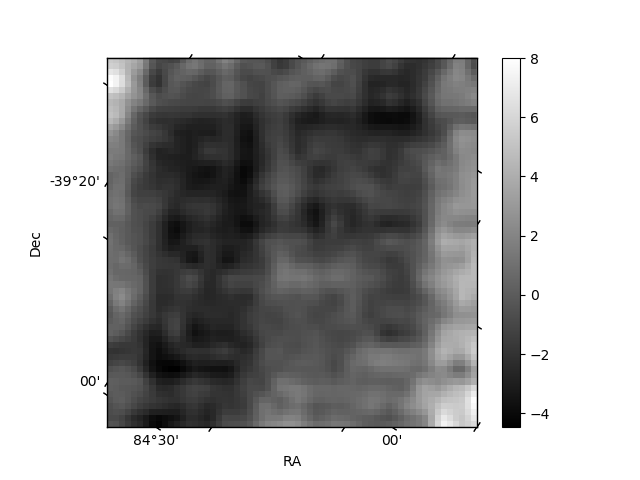
Quadrant B |
|---|---|---|---|
| Quadrant D | 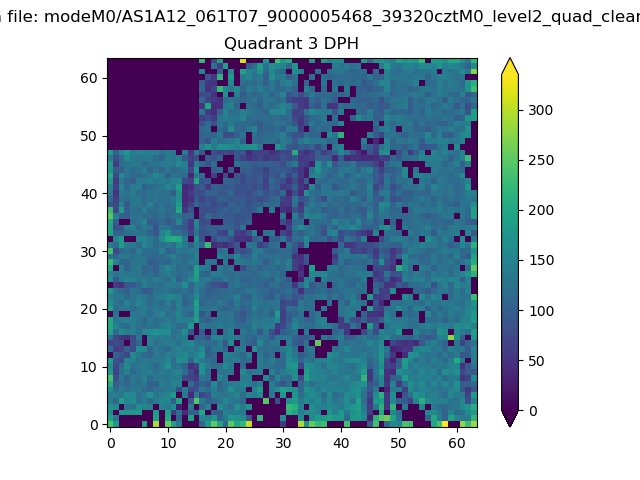 |
 |
Quadrant C |
| Plot type | Count rate plots | Images |
|---|---|---|
| Comparison with Poisson distribution Blue bars denote a histogram of data divided into 1 sec bins. Red curve is a Poisson curve with rate = median count rate of data. |
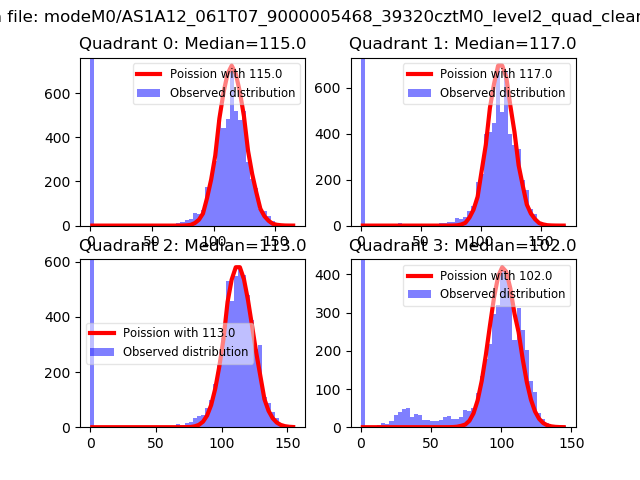 |
 |
| Quadrant-wise count rates Data is divided into 100 sec bins |
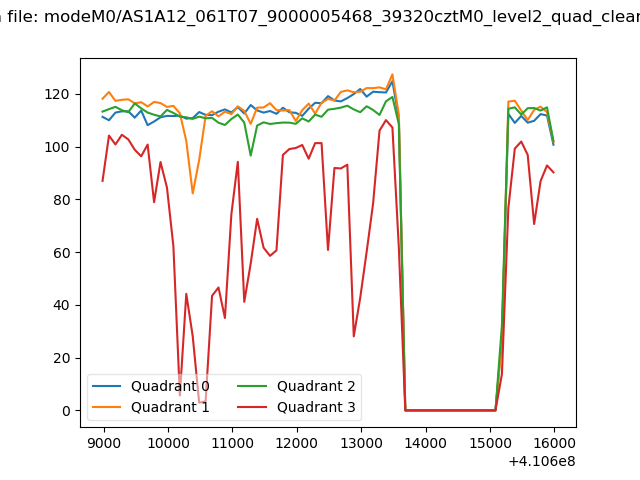 |
|
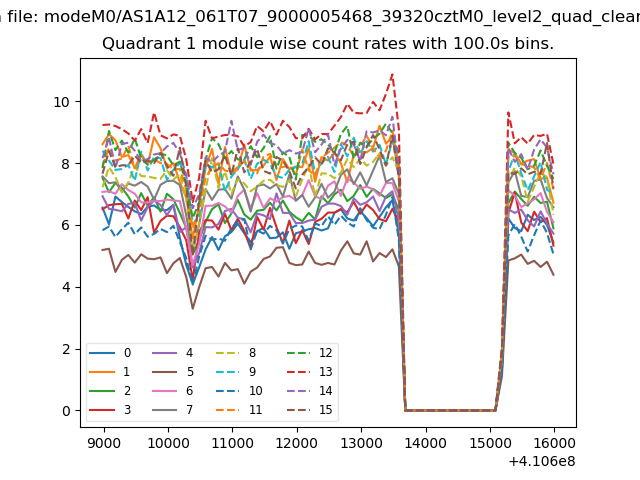
| Module-wise count rates for Quadrant A Data is divided into 100 sec bins |
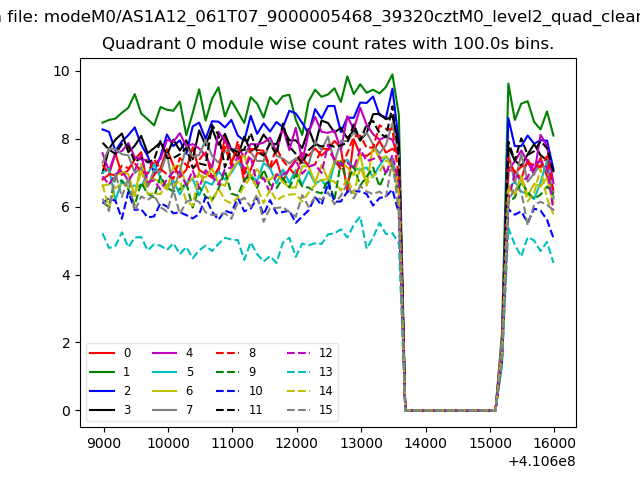 |
 |
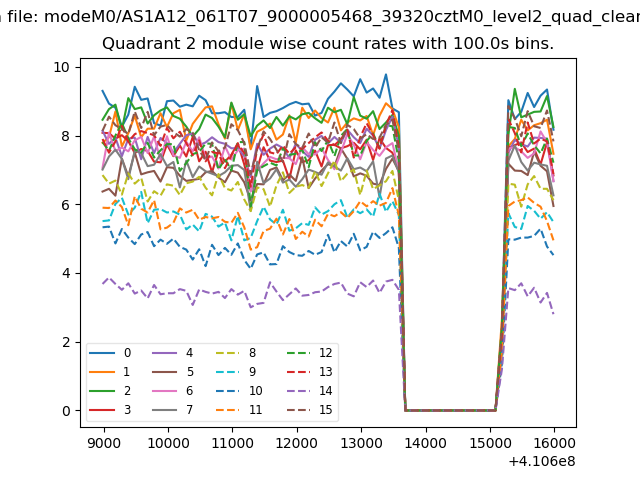
| Module-wise count rates for Quadrant B Data is divided into 100 sec bins |
 |
 |
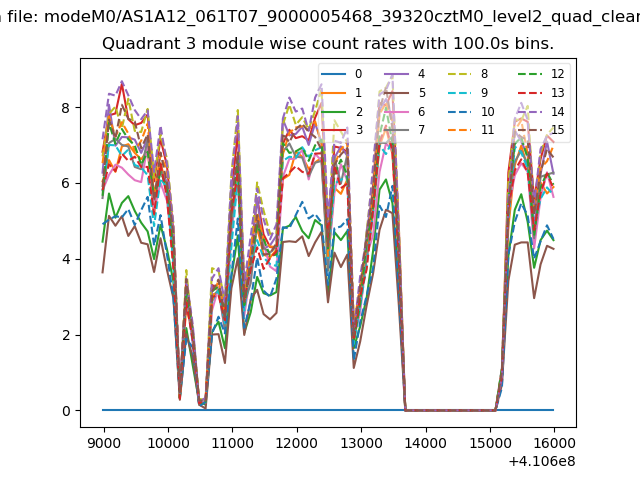
| Module-wise count rates for Quadrant C Data is divided into 100 sec bins |
 |
 |
| Module-wise count rates for Quadrant D Data is divided into 100 sec bins |
 |
 |
| Parameter | Plot |
|---|---|
| CZT HV Monitor | 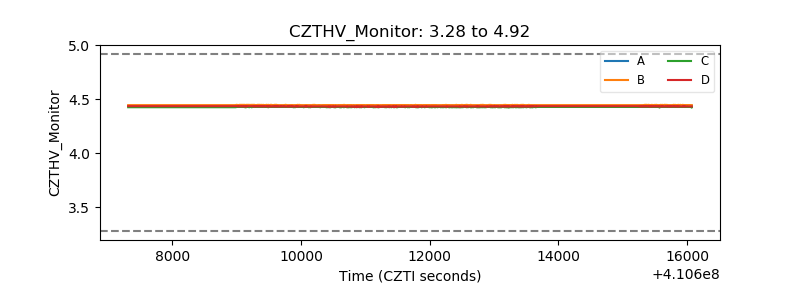 |
| D_VDD | 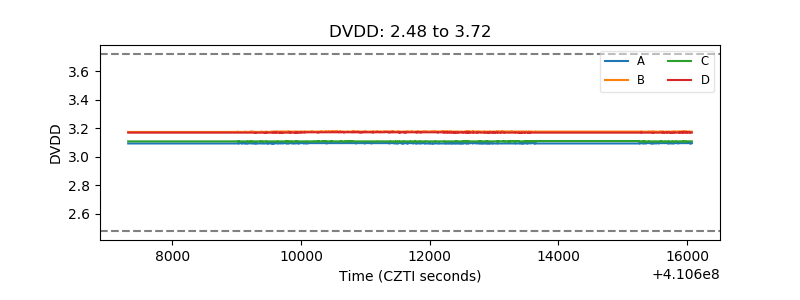 |
| Temperature 1 | 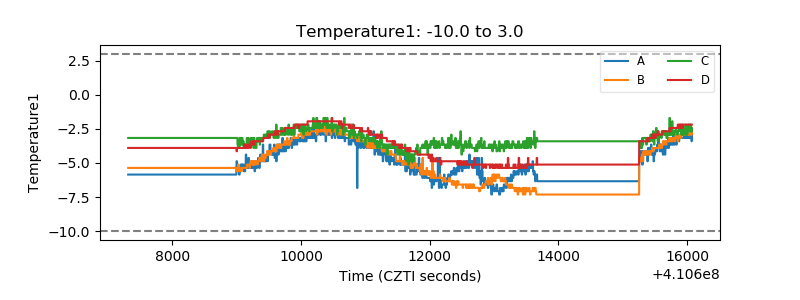 |
| Veto HV Monitor | 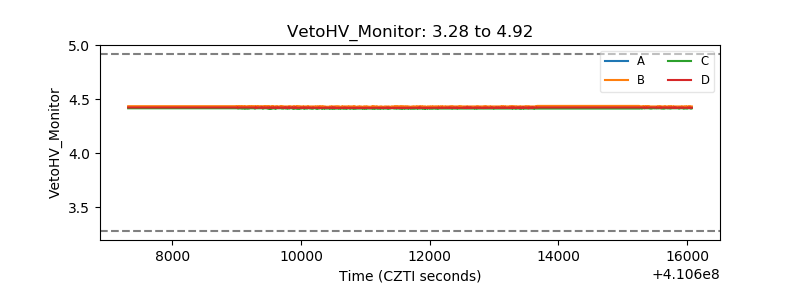 |
| Veto LLD | 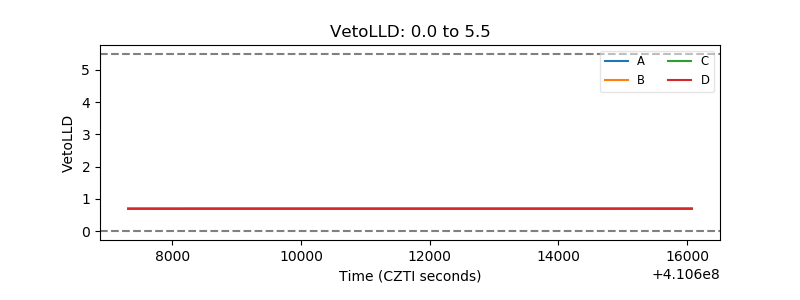 |
| Alpha Counter | 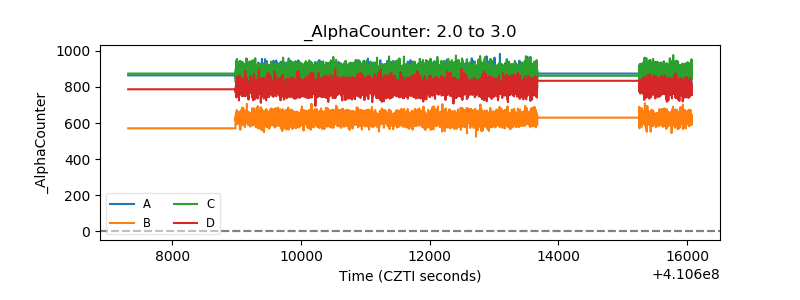 |
| _CPM_Rate | 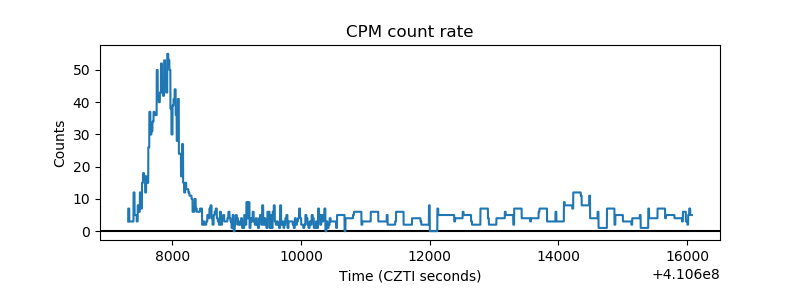 |
| CZT Counter | 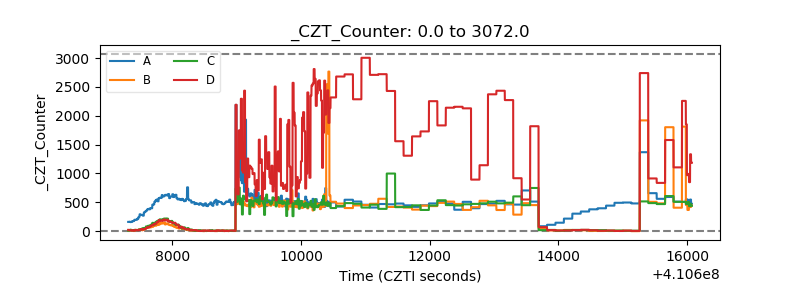 |
| +2.5 Volts monitor | 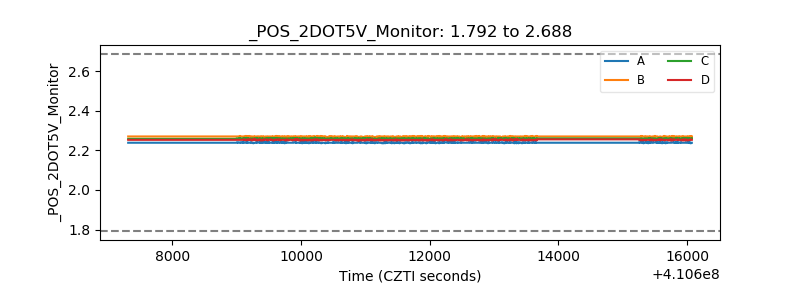 |
| +5 Volts monitor | 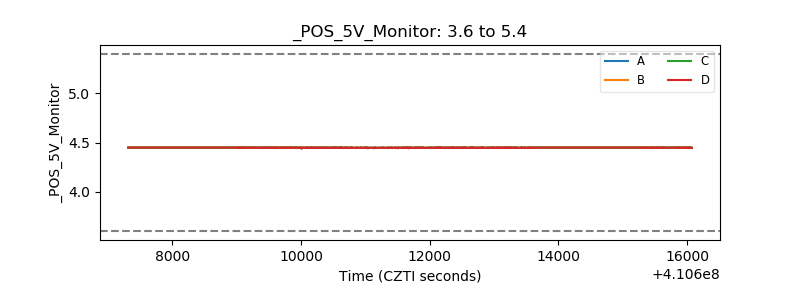 |
| _ROLL_ROT | 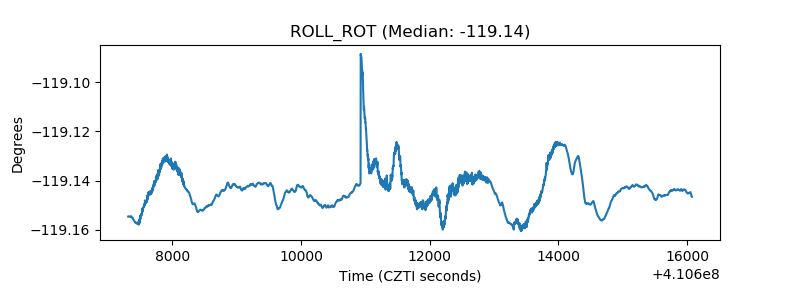 |
| _Roll_DEC | 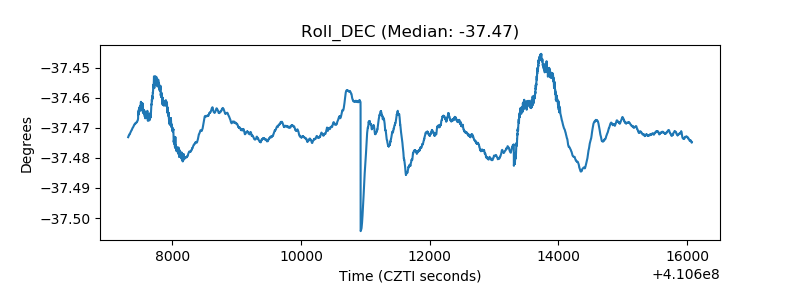 |
| _Roll_RA | 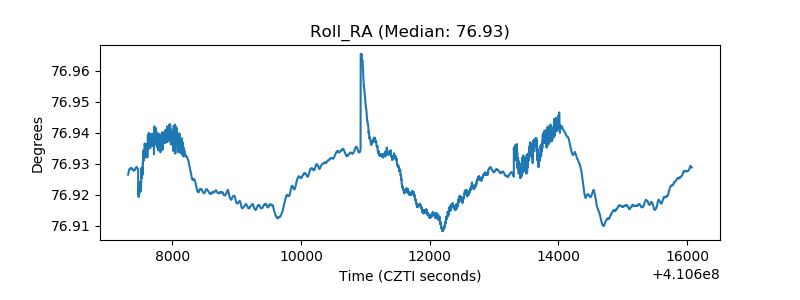 |
| Veto Counter | 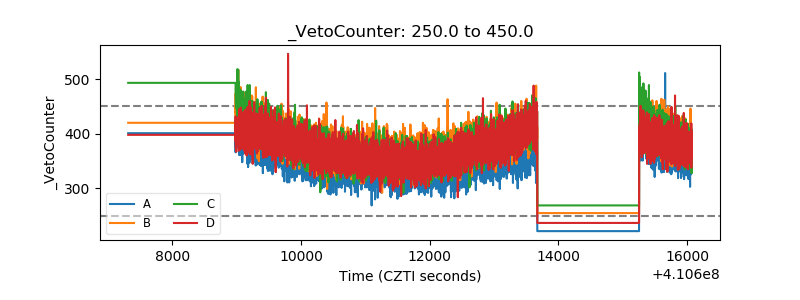 |