| Param | Original file | Final file |
|---|---|---|
| Filename | modeM0/AS1A12_061T07_9000005468_39321cztM0_level2.fits | modeM0/AS1A12_061T07_9000005468_39321cztM0_level2_quad_clean.evt |
| Size (bytes) | 525,870,720 | 92,502,720 |
| Size | 501.5 MB | 88.2 MB |
| Events in quadrant A | 3,102,445 | 662,397 |
| Events in quadrant B | 2,974,106 | 673,697 |
| Events in quadrant C | 2,914,523 | 649,306 |
| Events in quadrant D | 10,021,142 | 407,400 |
| Mode M9 | |||
|---|---|---|---|
| Quadrant | BADHDUFLAG | Total packets | Discarded packets |
| A | 0 | 28 | 0 |
| B | 0 | 28 | 0 |
| C | 0 | 28 | 0 |
| D | 0 | 29 | 0 |
| Mode SS | |||
|---|---|---|---|
| Quadrant | BADHDUFLAG | Total packets | Discarded packets |
| A | 0 | 118 | 0 |
| B | 0 | 118 | 0 |
| C | 0 | 118 | 0 |
| D | 0 | 118 | 0 |
| Mode M0 | |||
|---|---|---|---|
| Quadrant | BADHDUFLAG | Total packets | Discarded packets |
| A | 0 | 12790 | 3 |
| B | 0 | 12756 | 2 |
| C | 0 | 12175 | 2 |
| D | 0 | 33839 | 2 |
| Quadrant | Total seconds | Saturated seconds | Saturation percentage |
|---|---|---|---|
| A | 5841 | 23 | 0.393768% |
| B | 5841 | 56 | 0.958740% |
| C | 5841 | 8 | 0.136963% |
| D | 5841 | 2261 | 38.709125% |
Noise dominated data is calculated using 1-second bins in cleaned event files. If a bin has >2000 counts, and if more than 50% of those come from <1% of pixels, then it is considered to be noise-dominated and hence unusable.
| Quadrant | # 1 sec bins | Bins with >0 counts | Bins with >2000 counts | High rate bins dominated by noise | Noise dominated (total time) | Noise dominated (detector-on time) | Marked lightcurve |
|---|---|---|---|---|---|---|---|
| A | 7214 | 5842 | 9 | 9 | 0.12% | 0.15% | 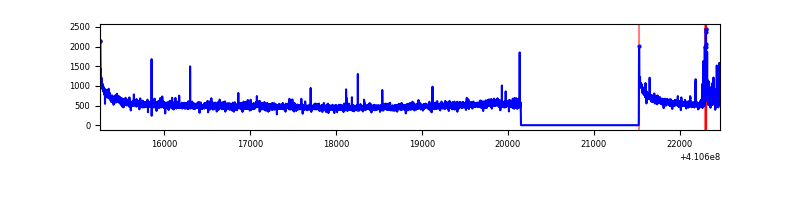 |
| B | 7214 | 5842 | 13 | 13 | 0.18% | 0.22% | 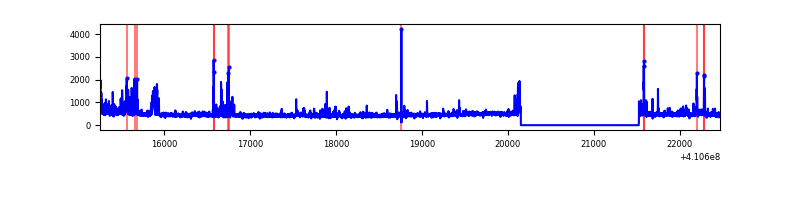 |
| C | 7214 | 5842 | 4 | 4 | 0.06% | 0.07% | 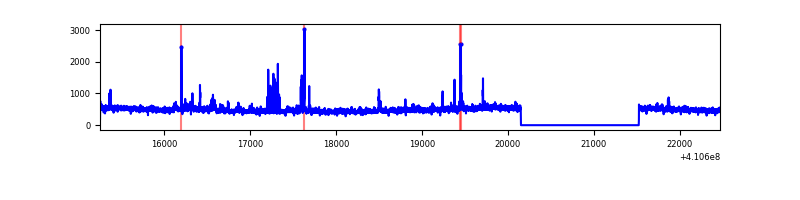 |
| D | 7214 | 5842 | 1998 | 1998 | 27.70% | 34.20% |  |
Top three noisy pixels from each quadrant. If the there are fewer than three noisy pixels in the level2.evt file, extra rows are filled as -1
| Pixel properties | Quadrant properties | ||||||
|---|---|---|---|---|---|---|---|
| Quadrant | DetID | PixID | Counts | Sigma | Mean | Median | Sigma |
| A | 10 | 83 | 455810 | 3382.92 | 657 | 643 | 134.5 |
| A | 13 | 248 | 75843 | 558.91 | 657 | 643 | 134.5 |
| A | 15 | 222 | 22805 | 164.71 | 657 | 643 | 134.5 |
| B | 5 | 184 | 319969 | 2500.8 | 648 | 631 | 127.7 |
| B | 5 | 172 | 46113 | 356.18 | 648 | 631 | 127.7 |
| B | 0 | 197 | 25356 | 193.63 | 648 | 631 | 127.7 |
| C | 15 | 214 | 265962 | 1767.36 | 637 | 642 | 150.1 |
| C | 14 | 254 | 117410 | 777.82 | 637 | 642 | 150.1 |
| C | 9 | 187 | 47884 | 314.69 | 637 | 642 | 150.1 |
| D | 12 | 235 | 6200045 | 46911.52 | 534 | 519 | 132.2 |
| D | 5 | 222 | 1054085 | 7972.28 | 534 | 519 | 132.2 |
| D | 12 | 227 | 490339 | 3706.44 | 534 | 519 | 132.2 |
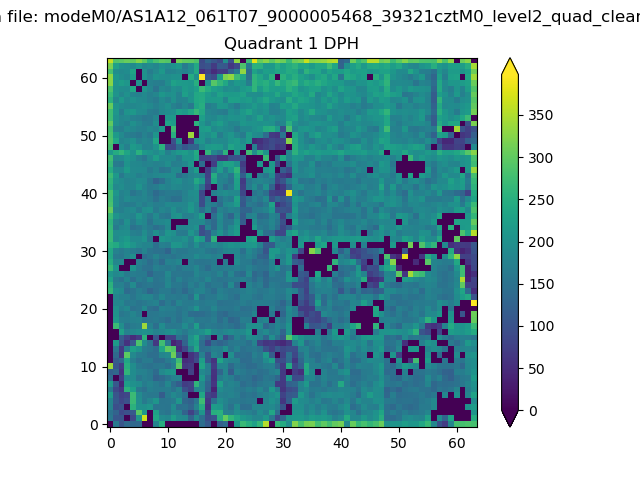
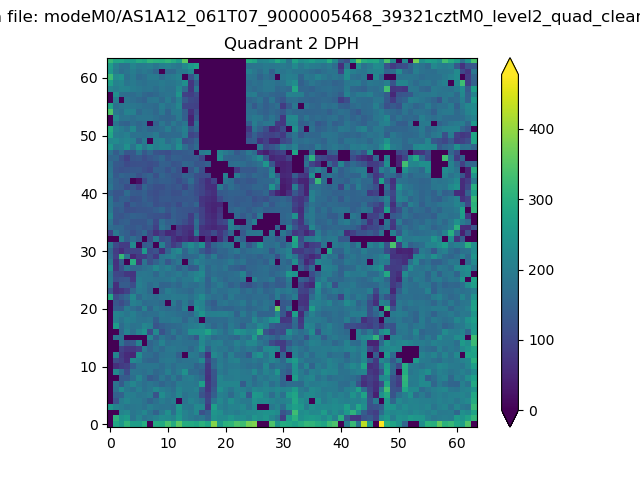
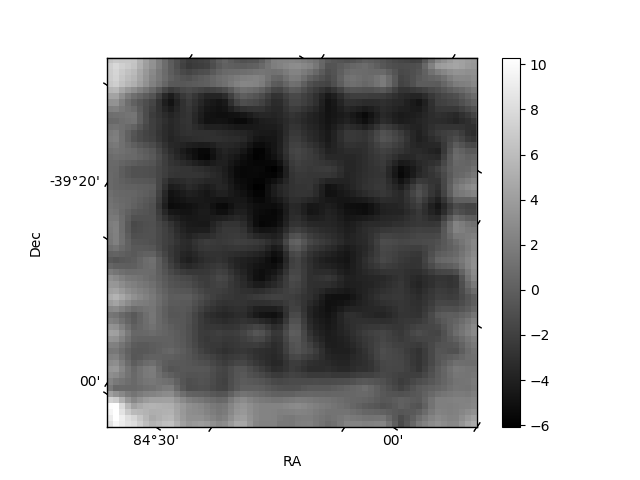
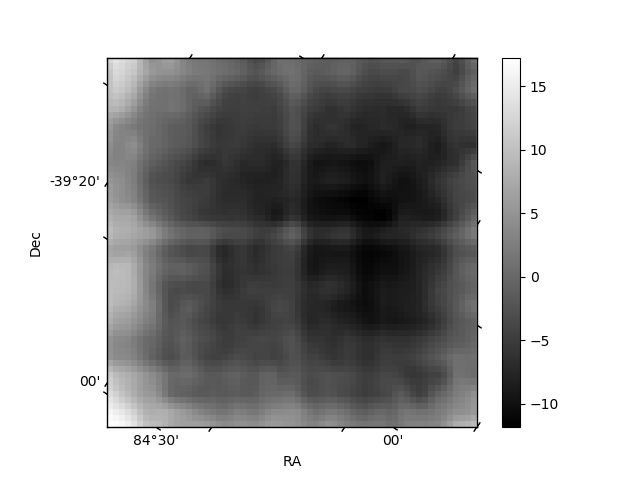
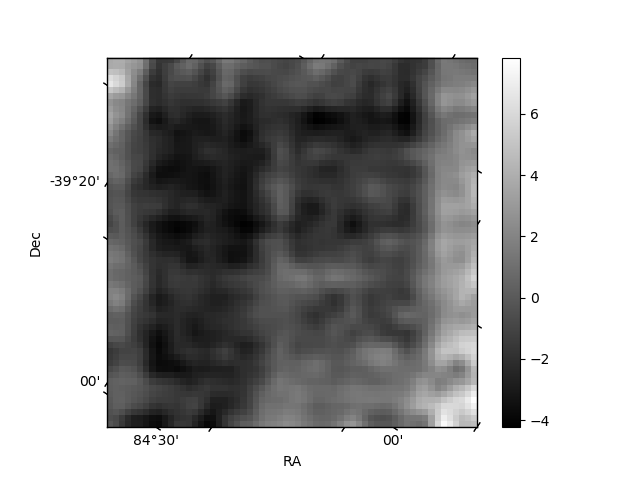
Histogram calculated using DETX and DETY for each event in the final _common_clean file
| Quadrant A | 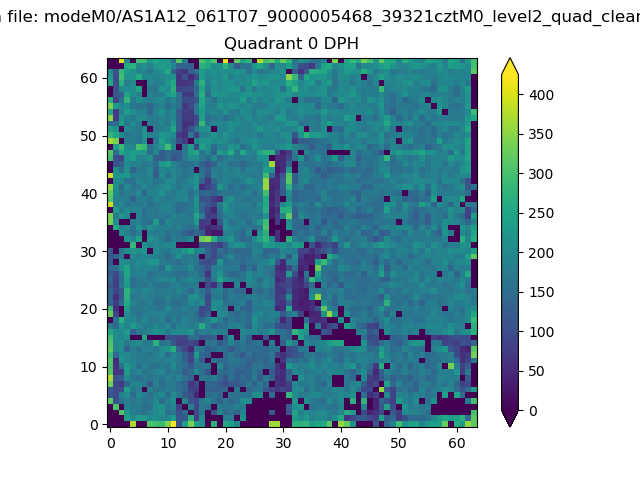 |
 |
Quadrant B |
|---|---|---|---|
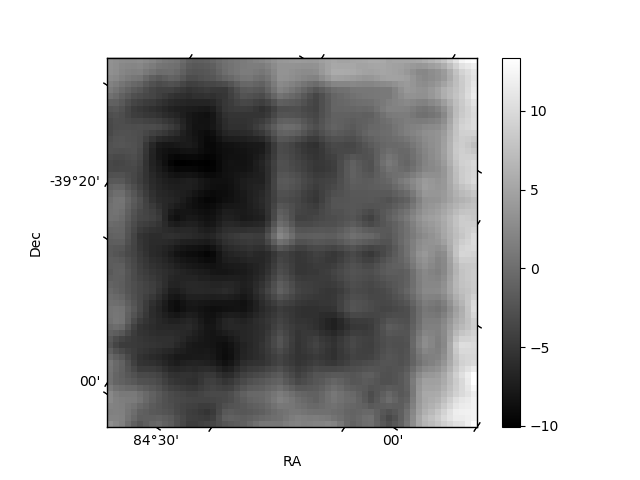
| Quadrant D | 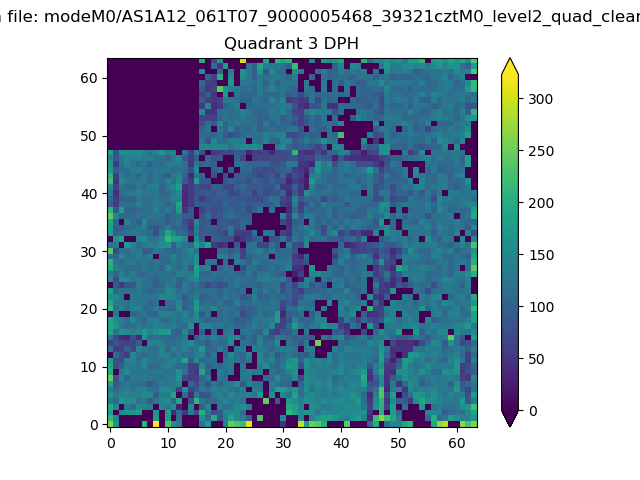 |
 |
Quadrant C |
| Plot type | Count rate plots | Images |
|---|---|---|
| Comparison with Poisson distribution Blue bars denote a histogram of data divided into 1 sec bins. Red curve is a Poisson curve with rate = median count rate of data. |
 |
 |
| Quadrant-wise count rates Data is divided into 100 sec bins |
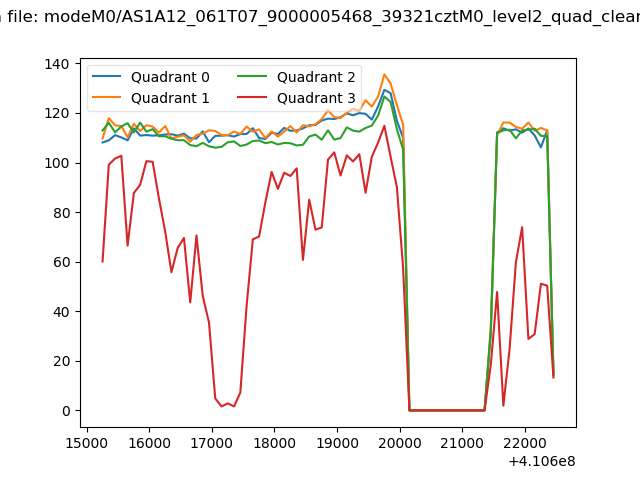 |
|
| Module-wise count rates for Quadrant A Data is divided into 100 sec bins |
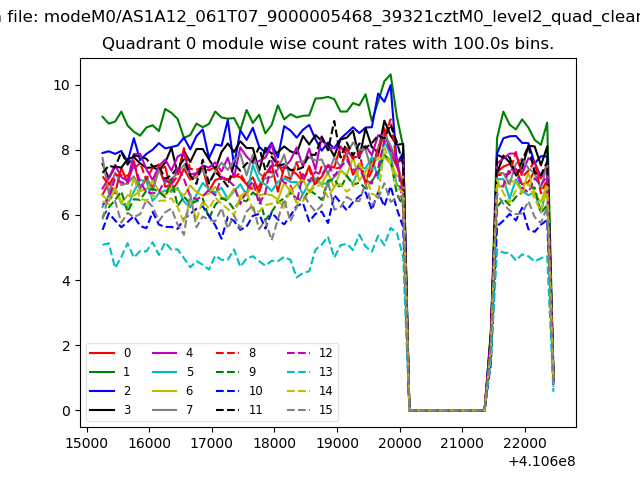 |
 |
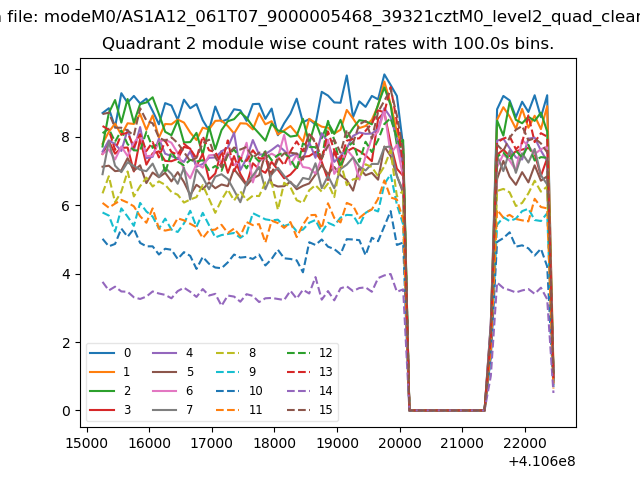
| Module-wise count rates for Quadrant B Data is divided into 100 sec bins |
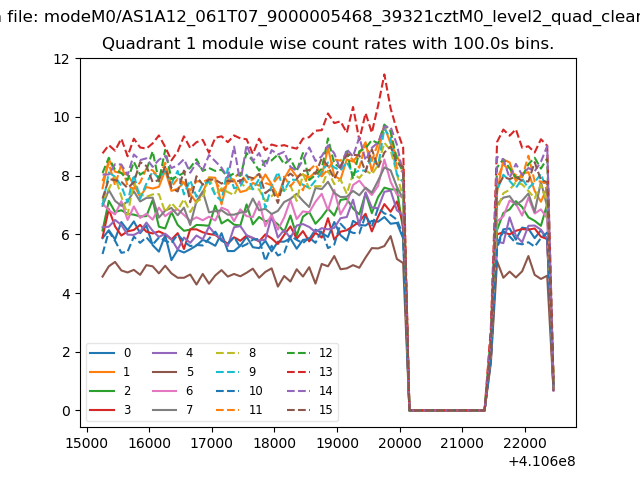 |
 |
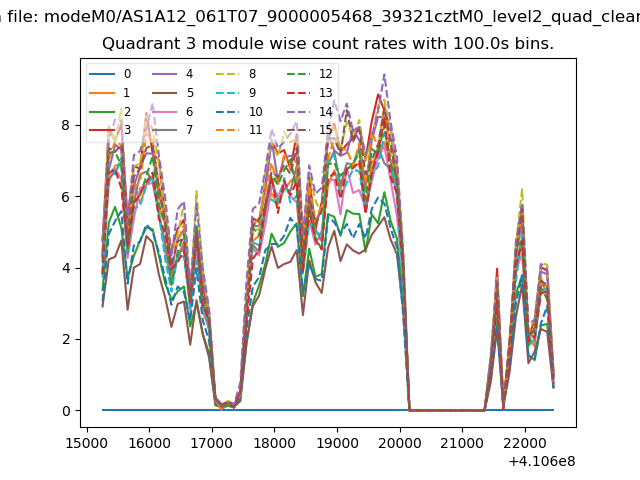
| Module-wise count rates for Quadrant C Data is divided into 100 sec bins |
 |
 |
| Module-wise count rates for Quadrant D Data is divided into 100 sec bins |
 |
 |
| Parameter | Plot |
|---|---|
| CZT HV Monitor | 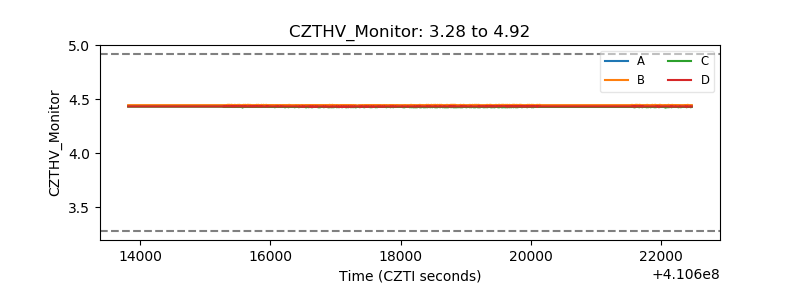 |
| D_VDD | 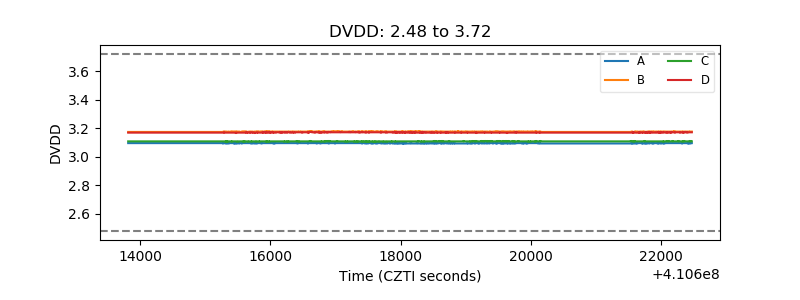 |
| Temperature 1 | 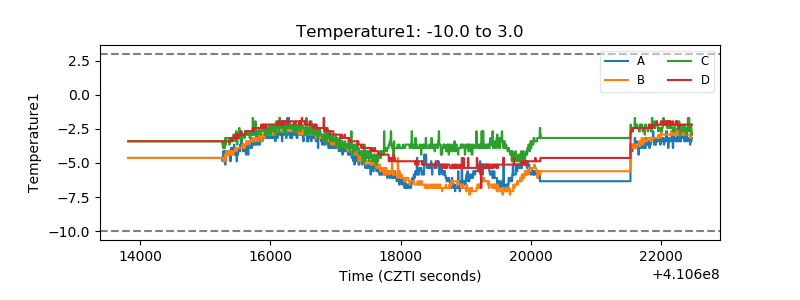 |
| Veto HV Monitor | 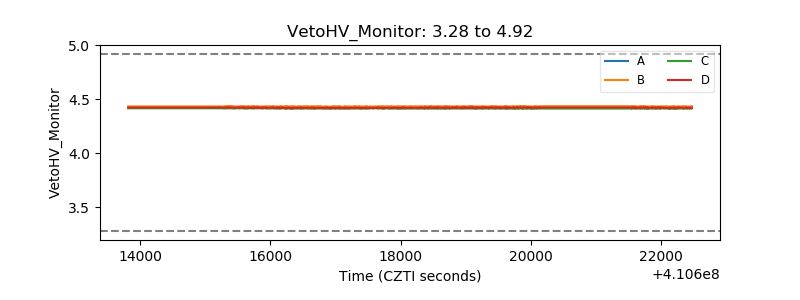 |
| Veto LLD | 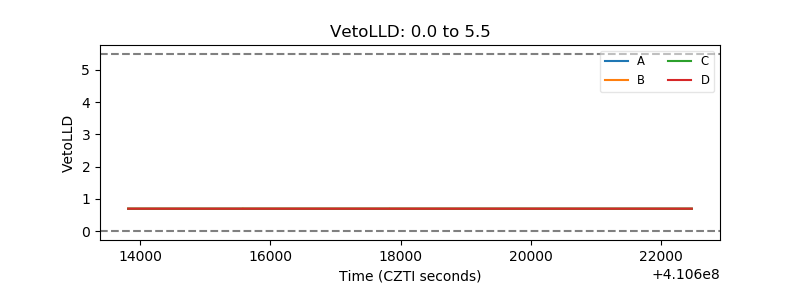 |
| Alpha Counter | 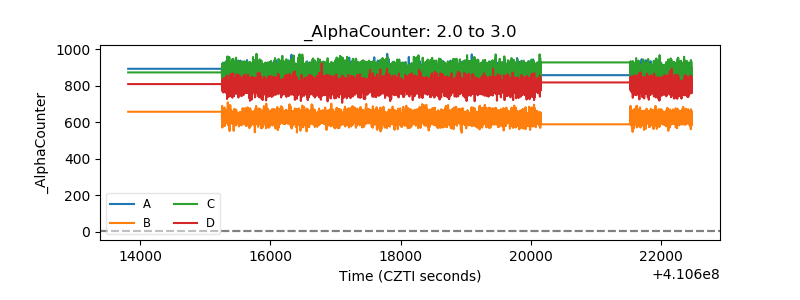 |
| _CPM_Rate | 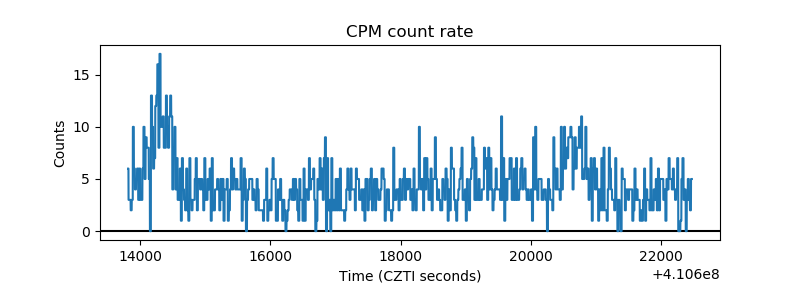 |
| CZT Counter | 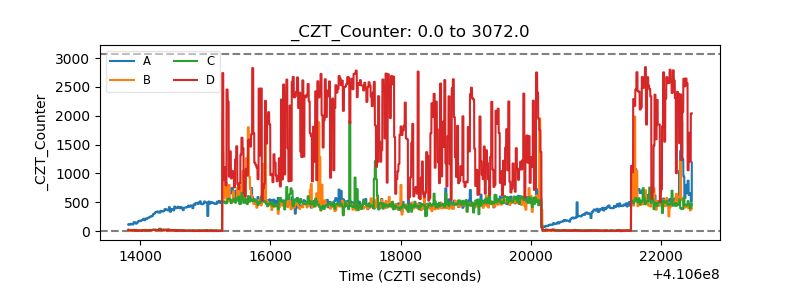 |
| +2.5 Volts monitor | 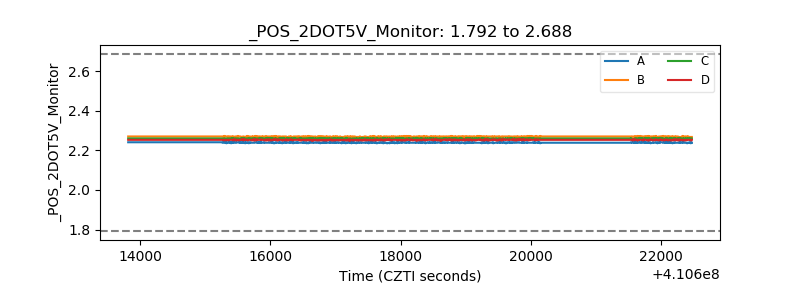 |
| +5 Volts monitor | 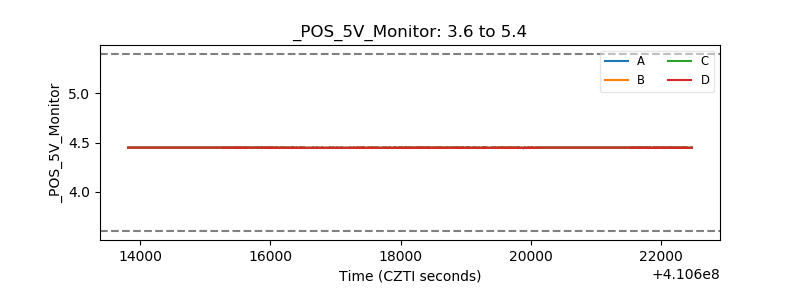 |
| _ROLL_ROT | 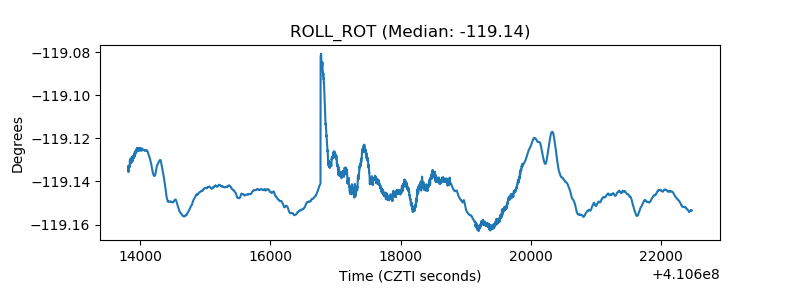 |
| _Roll_DEC | 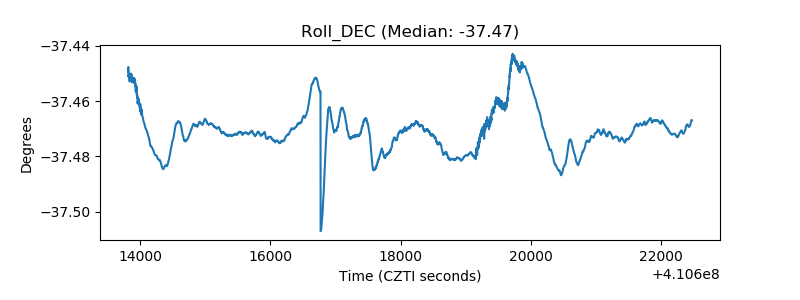 |
| _Roll_RA | 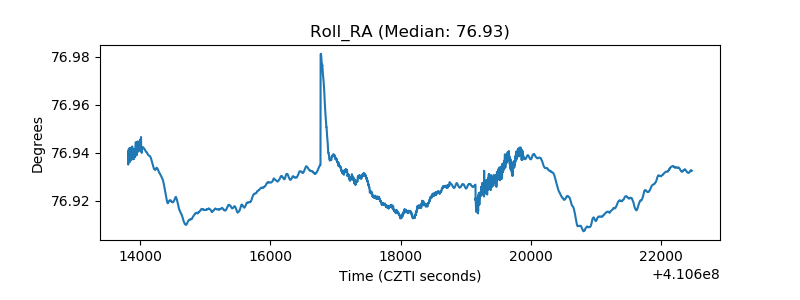 |
| Veto Counter | 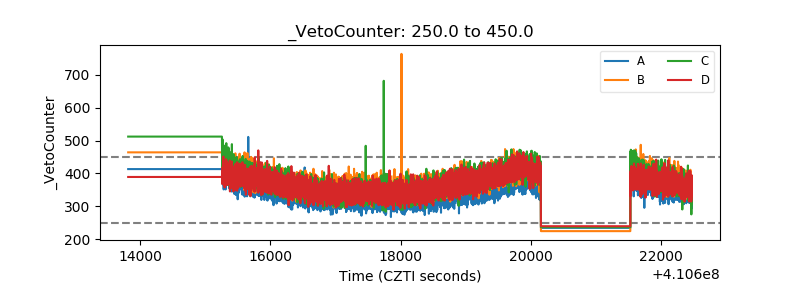 |