| Param | Original file | Final file |
|---|---|---|
| Filename | modeM0/AS1A12_061T07_9000005468_39322cztM0_level2.fits | modeM0/AS1A12_061T07_9000005468_39322cztM0_level2_quad_clean.evt |
| Size (bytes) | 515,888,640 | 95,598,720 |
| Size | 492.0 MB | 91.2 MB |
| Events in quadrant A | 3,327,966 | 679,943 |
| Events in quadrant B | 2,758,047 | 691,365 |
| Events in quadrant C | 3,005,505 | 659,571 |
| Events in quadrant D | 9,536,114 | 442,107 |
| Mode M9 | |||
|---|---|---|---|
| Quadrant | BADHDUFLAG | Total packets | Discarded packets |
| A | 0 | 23 | 0 |
| B | 0 | 23 | 0 |
| C | 0 | 23 | 0 |
| D | 0 | 24 | 0 |
| Mode SS | |||
|---|---|---|---|
| Quadrant | BADHDUFLAG | Total packets | Discarded packets |
| A | 0 | 122 | 0 |
| B | 0 | 122 | 0 |
| C | 0 | 122 | 0 |
| D | 0 | 122 | 0 |
| Mode M0 | |||
|---|---|---|---|
| Quadrant | BADHDUFLAG | Total packets | Discarded packets |
| A | 0 | 13620 | 3 |
| B | 0 | 12386 | 2 |
| C | 0 | 12695 | 2 |
| D | 0 | 32578 | 2 |
| Quadrant | Total seconds | Saturated seconds | Saturation percentage |
|---|---|---|---|
| A | 6036 | 25 | 0.414182% |
| B | 6036 | 22 | 0.364480% |
| C | 6036 | 21 | 0.347913% |
| D | 6036 | 2053 | 34.012591% |
Noise dominated data is calculated using 1-second bins in cleaned event files. If a bin has >2000 counts, and if more than 50% of those come from <1% of pixels, then it is considered to be noise-dominated and hence unusable.
| Quadrant | # 1 sec bins | Bins with >0 counts | Bins with >2000 counts | High rate bins dominated by noise | Noise dominated (total time) | Noise dominated (detector-on time) | Marked lightcurve |
|---|---|---|---|---|---|---|---|
| A | 7349 | 6037 | 23 | 23 | 0.31% | 0.38% |  |
| B | 7349 | 6037 | 5 | 5 | 0.07% | 0.08% |  |
| C | 7349 | 6037 | 15 | 15 | 0.20% | 0.25% | 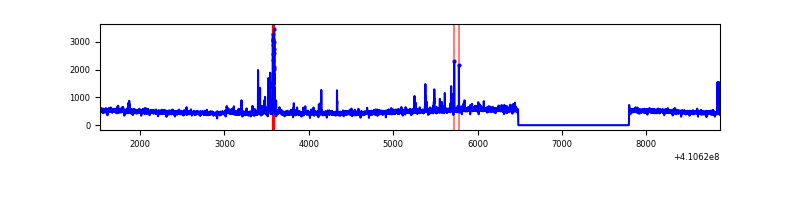 |
| D | 7349 | 6037 | 1783 | 1783 | 24.26% | 29.53% | 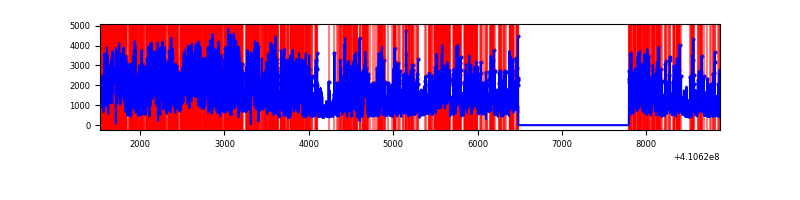 |
Top three noisy pixels from each quadrant. If the there are fewer than three noisy pixels in the level2.evt file, extra rows are filled as -1
| Pixel properties | Quadrant properties | ||||||
|---|---|---|---|---|---|---|---|
| Quadrant | DetID | PixID | Counts | Sigma | Mean | Median | Sigma |
| A | 10 | 83 | 460978 | 3296.21 | 677 | 664 | 139.6 |
| A | 13 | 248 | 105230 | 748.77 | 677 | 664 | 139.6 |
| A | 2 | 79 | 75891 | 538.68 | 677 | 664 | 139.6 |
| B | 5 | 184 | 76716 | 579.71 | 670 | 649 | 131.2 |
| B | 5 | 172 | 38303 | 286.96 | 670 | 649 | 131.2 |
| B | 12 | 111 | 16784 | 122.97 | 670 | 649 | 131.2 |
| C | 15 | 214 | 274706 | 1779.16 | 654 | 658 | 154.0 |
| C | 14 | 254 | 108544 | 700.41 | 654 | 658 | 154.0 |
| C | 9 | 187 | 58642 | 376.44 | 654 | 658 | 154.0 |
| D | 12 | 235 | 6820131 | 48361.56 | 567 | 551 | 141.0 |
| D | 12 | 227 | 165088 | 1166.83 | 567 | 551 | 141.0 |
| D | 5 | 222 | 105090 | 741.35 | 567 | 551 | 141.0 |
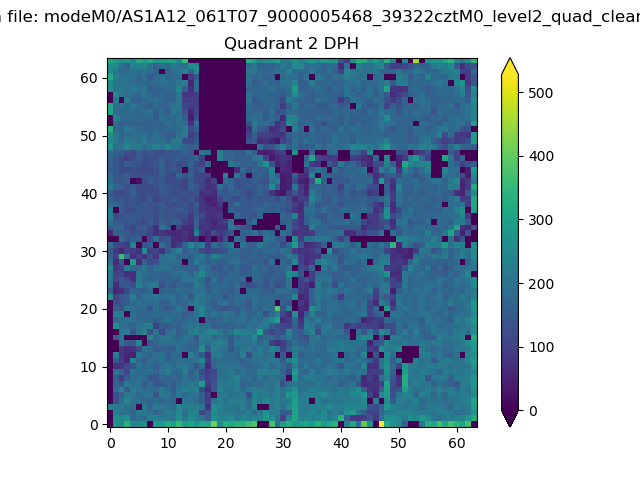
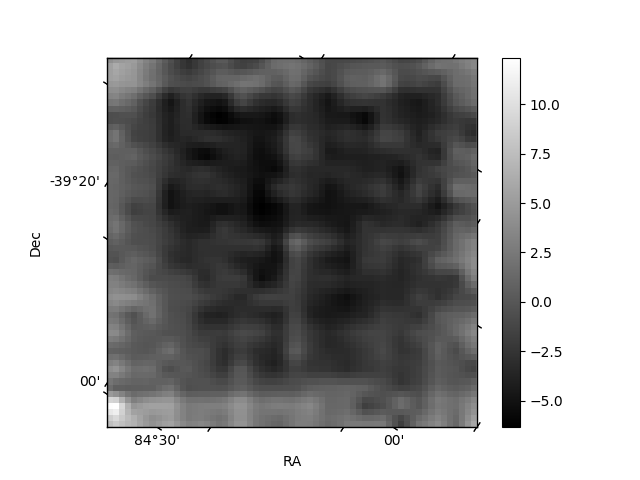
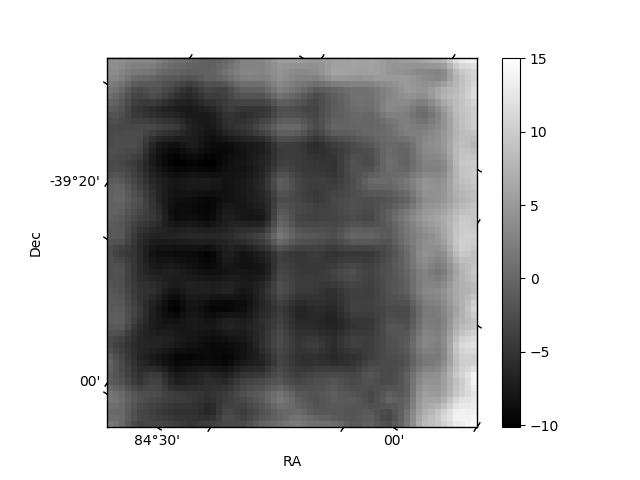
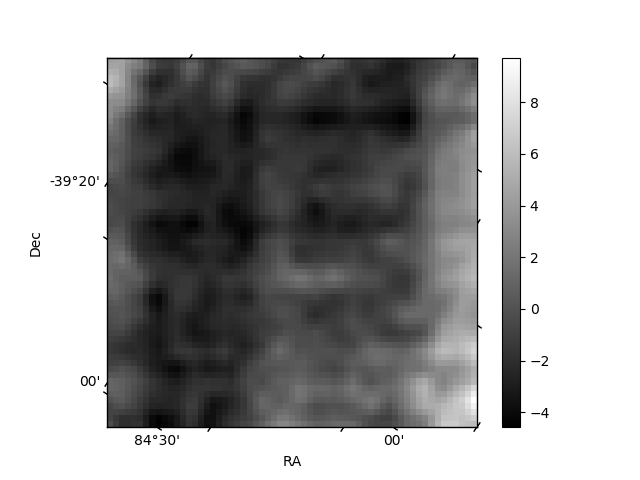
Histogram calculated using DETX and DETY for each event in the final _common_clean file
| Quadrant A | 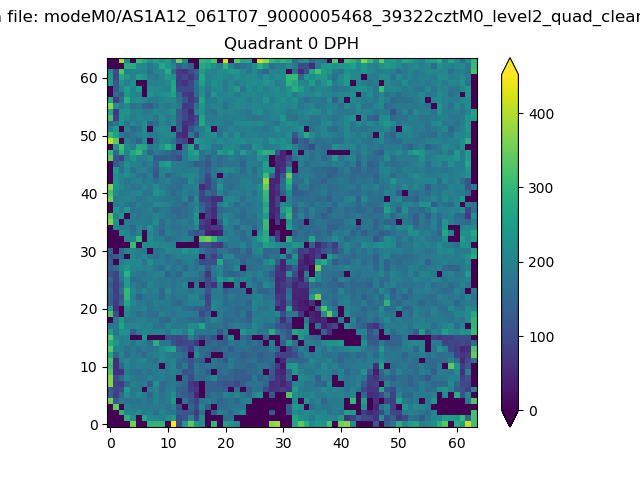 |
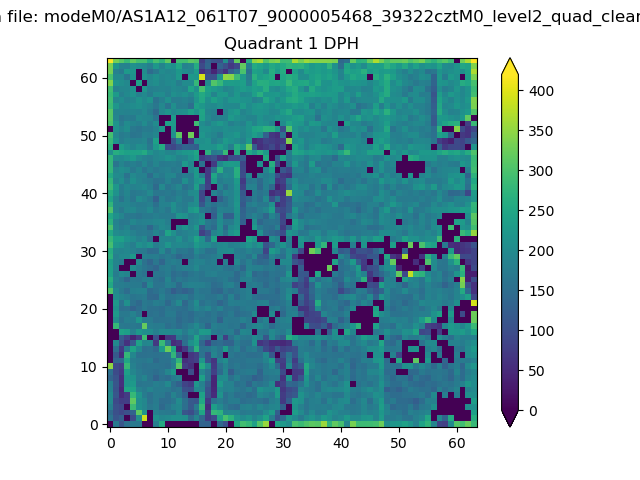 |
Quadrant B |
|---|---|---|---|
| Quadrant D | 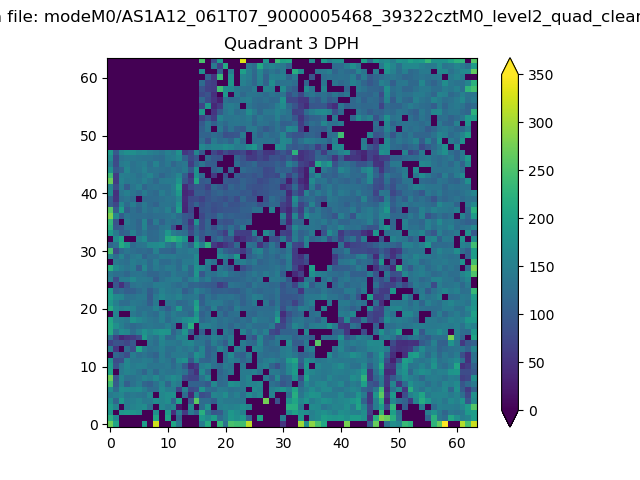 |
 |
Quadrant C |
| Plot type | Count rate plots | Images |
|---|---|---|
| Comparison with Poisson distribution Blue bars denote a histogram of data divided into 1 sec bins. Red curve is a Poisson curve with rate = median count rate of data. |
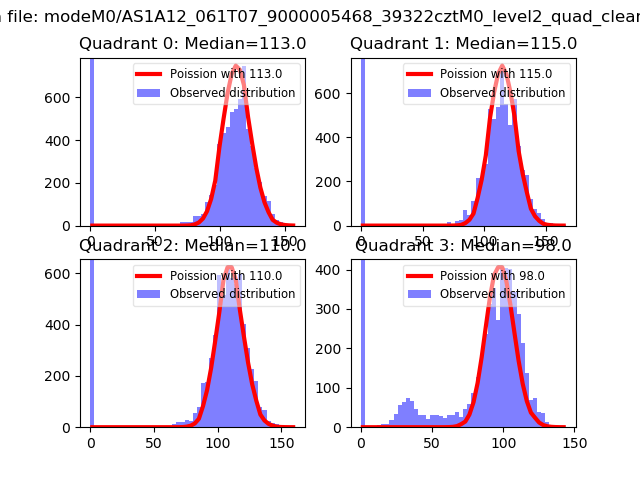 |
 |
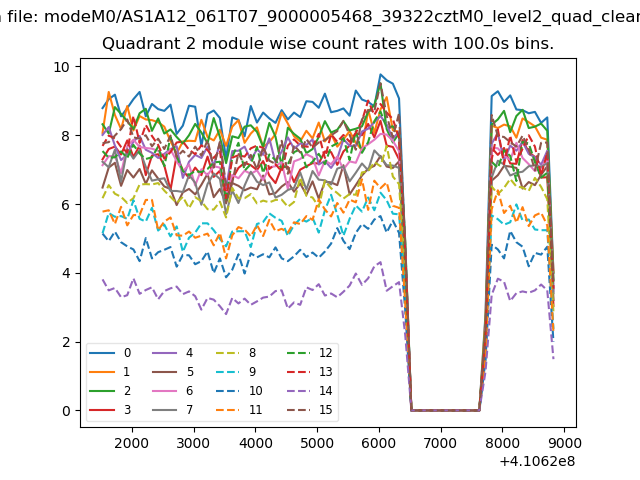
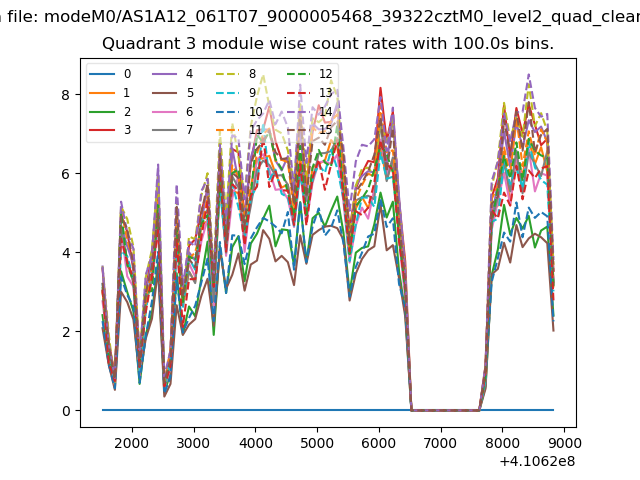
| Quadrant-wise count rates Data is divided into 100 sec bins |
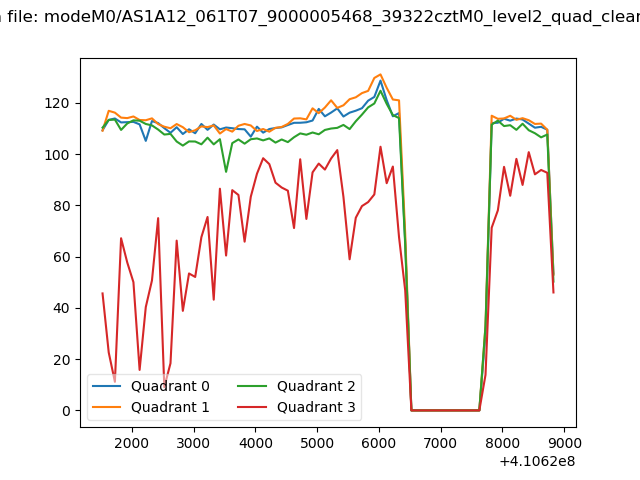 |
|
| Module-wise count rates for Quadrant A Data is divided into 100 sec bins |
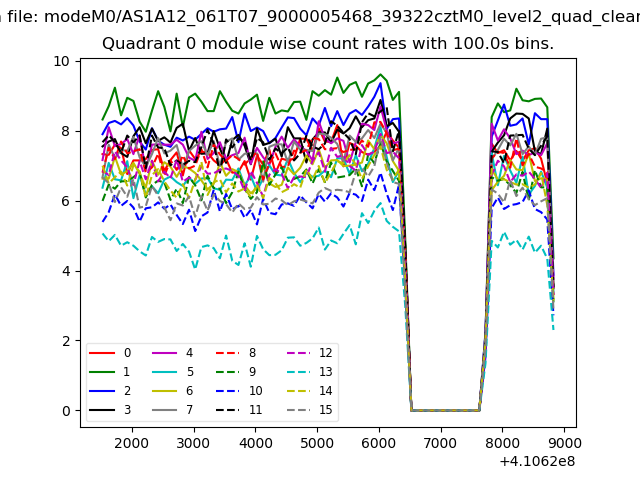 |
 |
| Module-wise count rates for Quadrant B Data is divided into 100 sec bins |
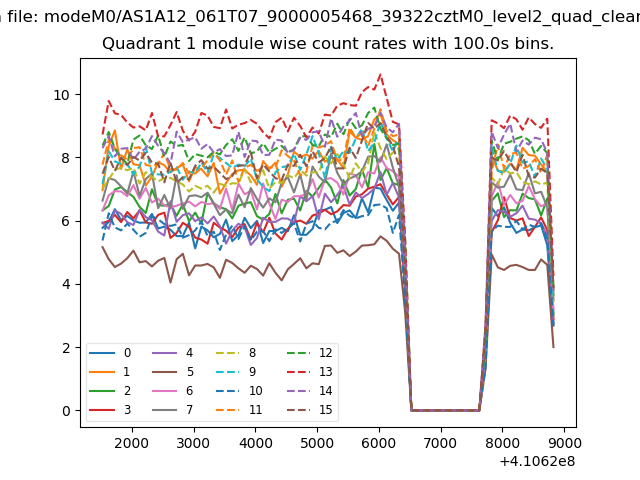 |
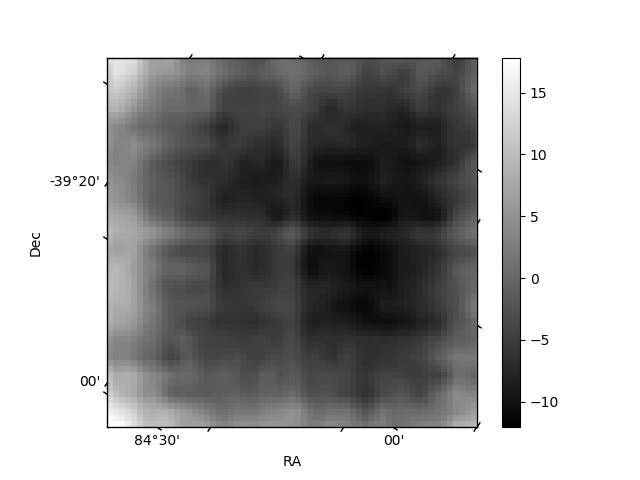 |
| Module-wise count rates for Quadrant C Data is divided into 100 sec bins |
 |
 |
| Module-wise count rates for Quadrant D Data is divided into 100 sec bins |
 |
 |
| Parameter | Plot |
|---|---|
| CZT HV Monitor | 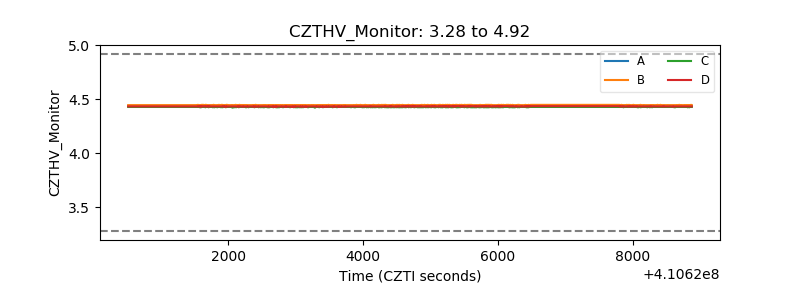 |
| D_VDD | 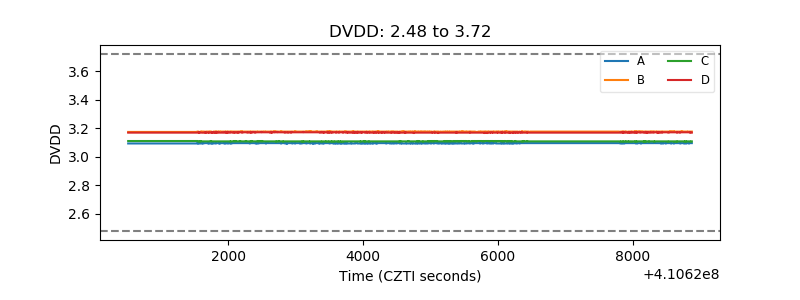 |
| Temperature 1 | 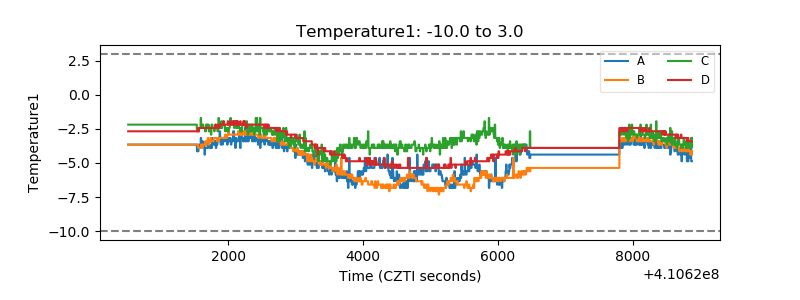 |
| Veto HV Monitor | 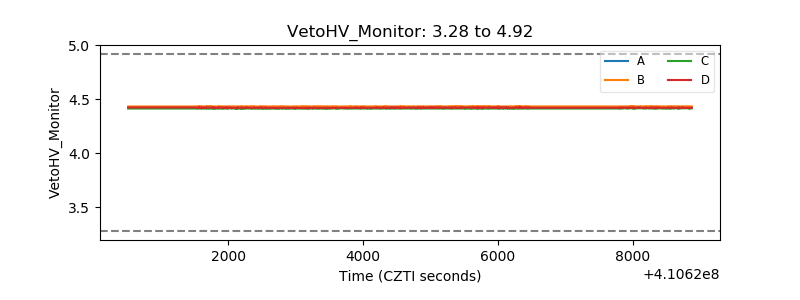 |
| Veto LLD | 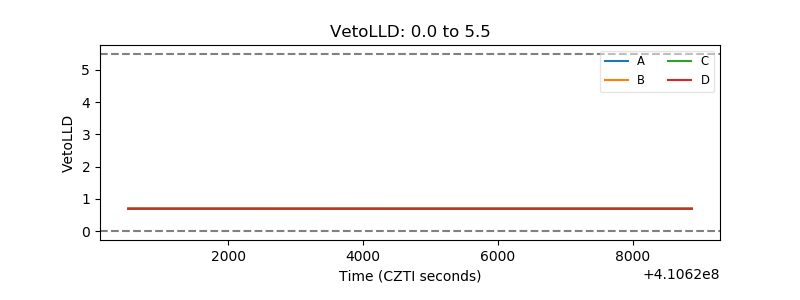 |
| Alpha Counter |  |
| _CPM_Rate | 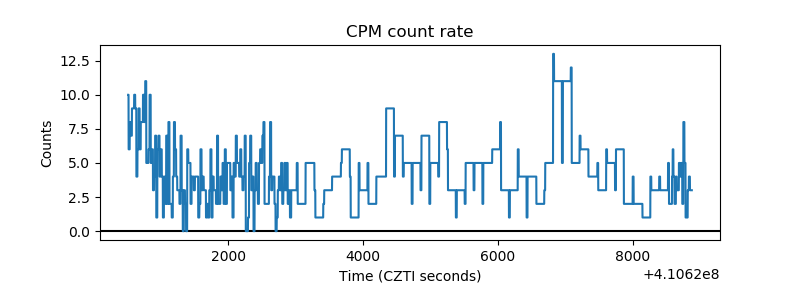 |
| CZT Counter | 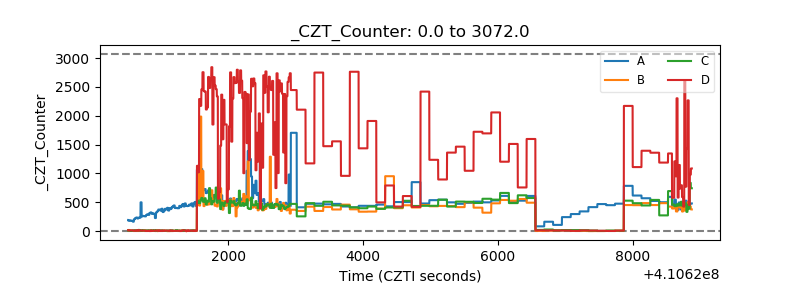 |
| +2.5 Volts monitor | 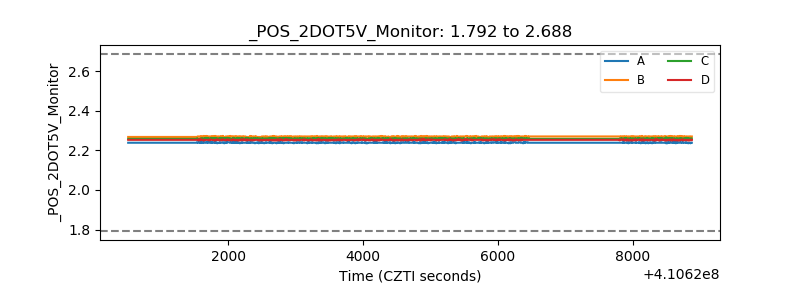 |
| +5 Volts monitor | 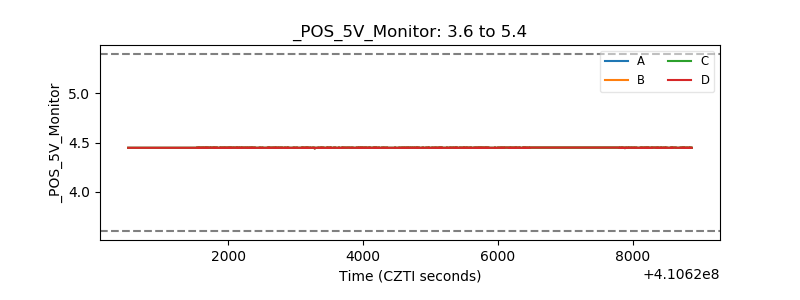 |
| _ROLL_ROT | 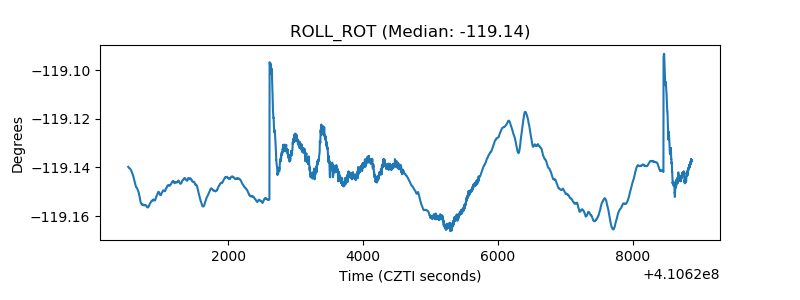 |
| _Roll_DEC | 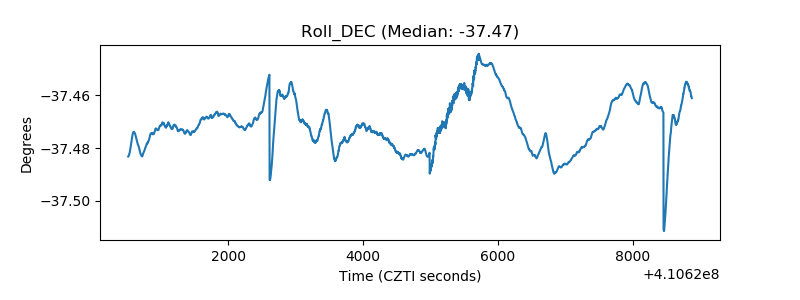 |
| _Roll_RA | 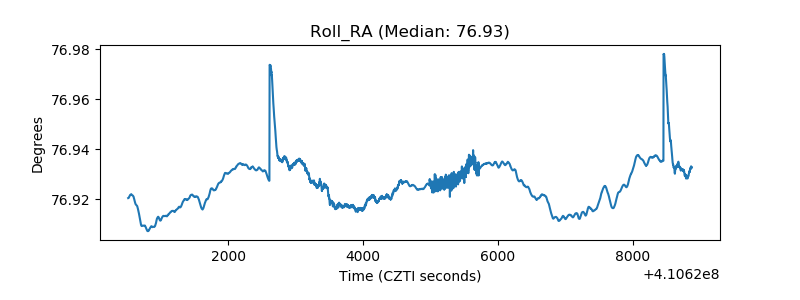 |
| Veto Counter | 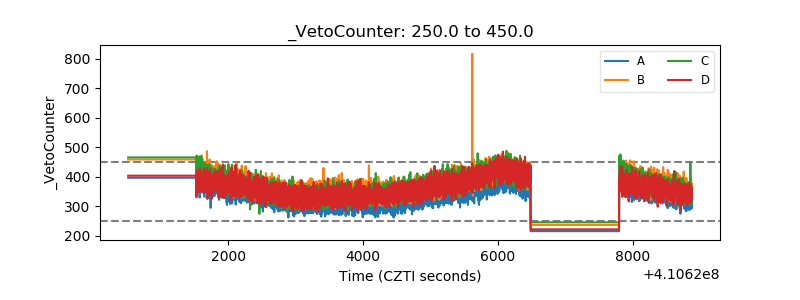 |