| Param | Original file | Final file |
|---|---|---|
| Filename | modeM0/AS1A12_061T07_9000005468_39324cztM0_level2.fits | modeM0/AS1A12_061T07_9000005468_39324cztM0_level2_quad_clean.evt |
| Size (bytes) | 654,203,520 | 160,024,320 |
| Size | 623.9 MB | 152.6 MB |
| Events in quadrant A | 4,987,734 | 1,087,699 |
| Events in quadrant B | 4,480,996 | 1,106,877 |
| Events in quadrant C | 4,800,988 | 1,050,250 |
| Events in quadrant D | 9,189,623 | 923,321 |
| Mode M9 | |||
|---|---|---|---|
| Quadrant | BADHDUFLAG | Total packets | Discarded packets |
| A | 0 | 23 | 0 |
| B | 0 | 22 | 0 |
| C | 0 | 22 | 0 |
| D | 0 | 23 | 0 |
| Mode SS | |||
|---|---|---|---|
| Quadrant | BADHDUFLAG | Total packets | Discarded packets |
| A | 0 | 200 | 0 |
| B | 0 | 200 | 0 |
| C | 0 | 200 | 0 |
| D | 0 | 200 | 0 |
| Mode M0 | |||
|---|---|---|---|
| Quadrant | BADHDUFLAG | Total packets | Discarded packets |
| A | 0 | 20974 | 2 |
| B | 0 | 20250 | 2 |
| C | 0 | 20414 | 2 |
| D | 0 | 34118 | 2 |
| Quadrant | Total seconds | Saturated seconds | Saturation percentage |
|---|---|---|---|
| A | 9765 | 28 | 0.286738% |
| B | 9765 | 40 | 0.409626% |
| C | 9765 | 8 | 0.081925% |
| D | 9765 | 829 | 8.489503% |
Noise dominated data is calculated using 1-second bins in cleaned event files. If a bin has >2000 counts, and if more than 50% of those come from <1% of pixels, then it is considered to be noise-dominated and hence unusable.
| Quadrant | # 1 sec bins | Bins with >0 counts | Bins with >2000 counts | High rate bins dominated by noise | Noise dominated (total time) | Noise dominated (detector-on time) | Marked lightcurve |
|---|---|---|---|---|---|---|---|
| A | 11107 | 9766 | 10 | 10 | 0.09% | 0.10% | 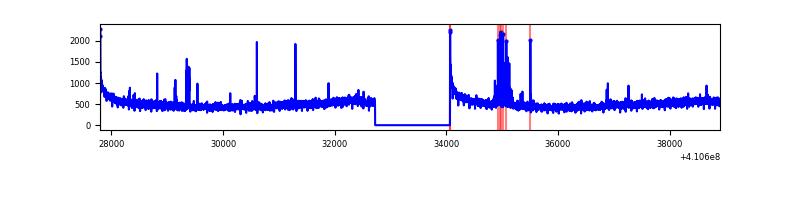 |
| B | 11107 | 9766 | 12 | 12 | 0.11% | 0.12% | 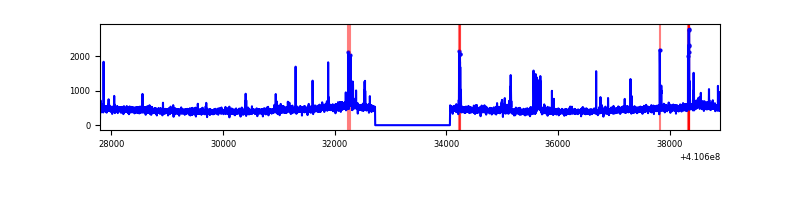 |
| C | 11107 | 9766 | 5 | 5 | 0.05% | 0.05% | 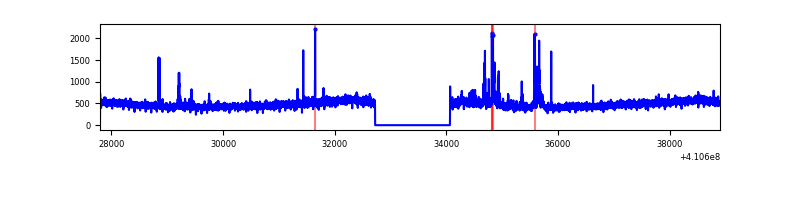 |
| D | 11107 | 9766 | 725 | 725 | 6.53% | 7.42% | 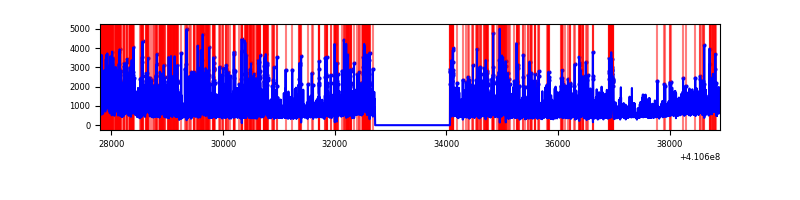 |
Top three noisy pixels from each quadrant. If the there are fewer than three noisy pixels in the level2.evt file, extra rows are filled as -1
| Pixel properties | Quadrant properties | ||||||
|---|---|---|---|---|---|---|---|
| Quadrant | DetID | PixID | Counts | Sigma | Mean | Median | Sigma |
| A | 10 | 83 | 622033 | 2803.39 | 1087 | 1063 | 221.5 |
| A | 13 | 248 | 106545 | 476.2 | 1087 | 1063 | 221.5 |
| A | 15 | 222 | 50662 | 223.92 | 1087 | 1063 | 221.5 |
| B | 5 | 172 | 174225 | 830.96 | 1081 | 1051 | 208.4 |
| B | 5 | 255 | 44087 | 206.5 | 1081 | 1051 | 208.4 |
| B | 12 | 111 | 27663 | 127.7 | 1081 | 1051 | 208.4 |
| C | 15 | 214 | 431755 | 1732.27 | 1060 | 1064 | 248.6 |
| C | 9 | 187 | 205291 | 821.42 | 1060 | 1064 | 248.6 |
| C | 14 | 254 | 12989 | 47.96 | 1060 | 1064 | 248.6 |
| D | 12 | 235 | 4445050 | 17728.12 | 1026 | 998 | 250.7 |
| D | 13 | 249 | 432251 | 1720.35 | 1026 | 998 | 250.7 |
| D | 5 | 222 | 118926 | 470.44 | 1026 | 998 | 250.7 |
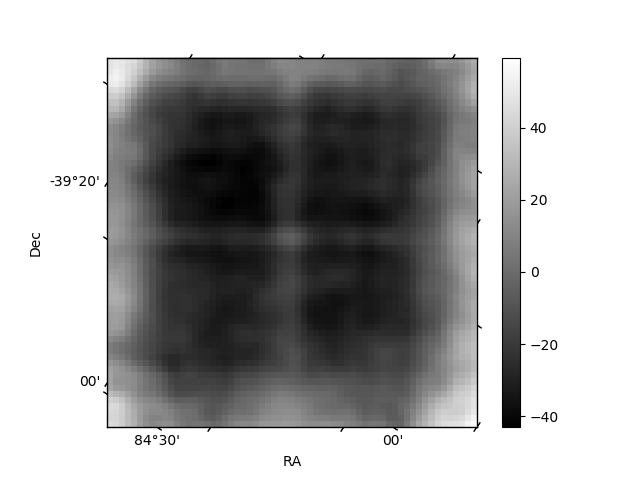
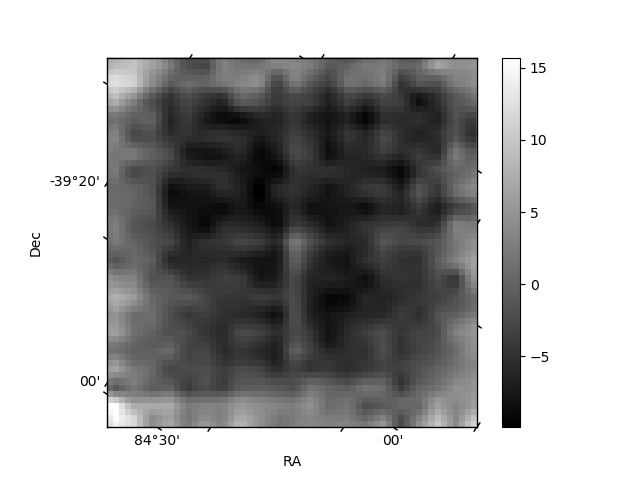
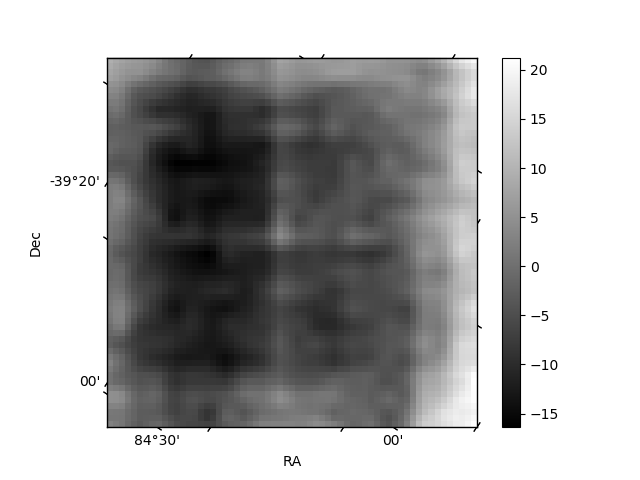
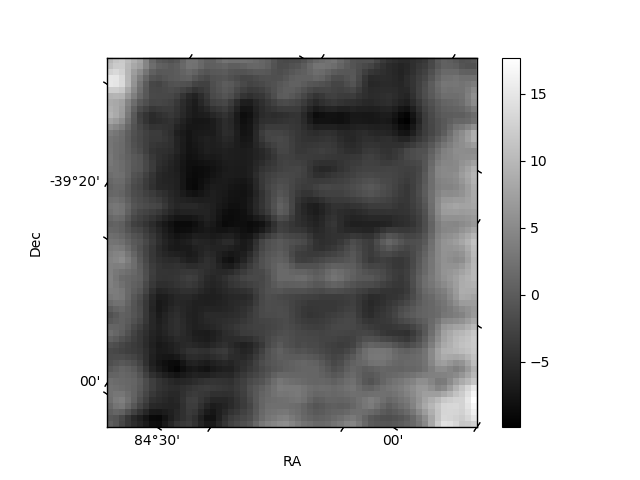
Histogram calculated using DETX and DETY for each event in the final _common_clean file
| Quadrant A | 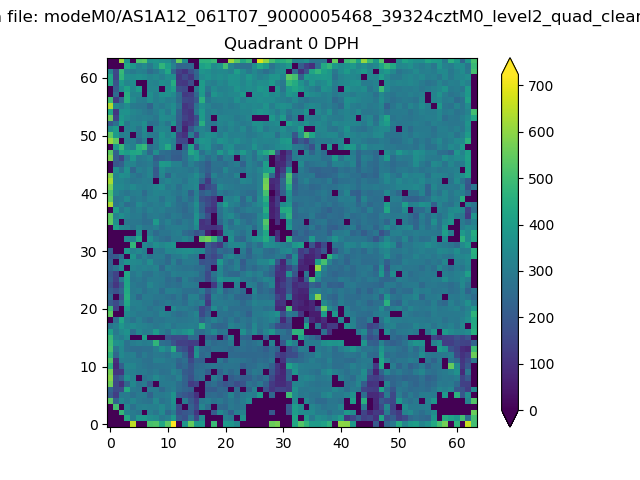 |
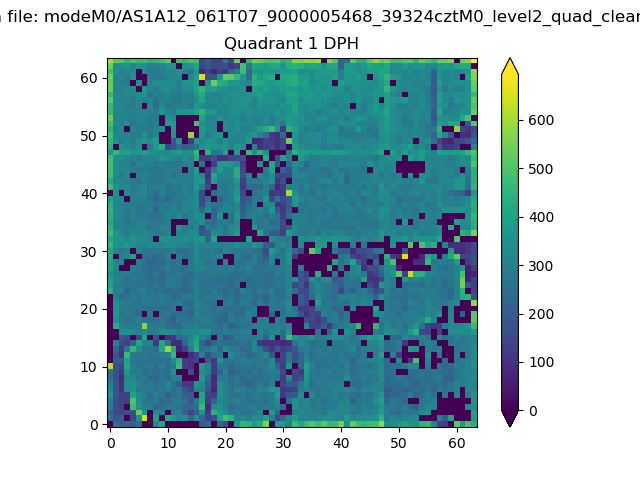 |
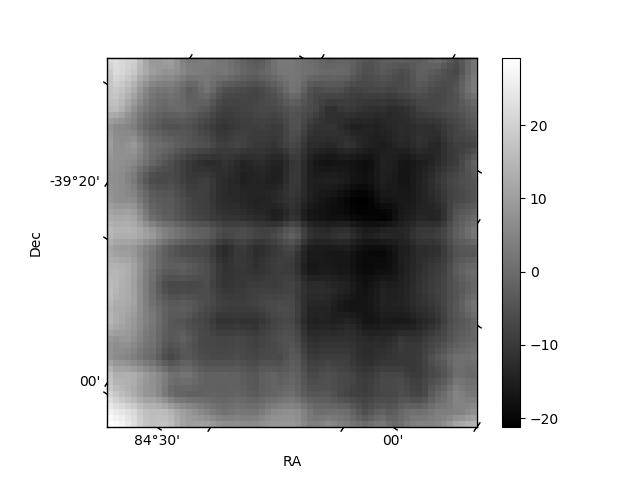
Quadrant B |
|---|---|---|---|
| Quadrant D | 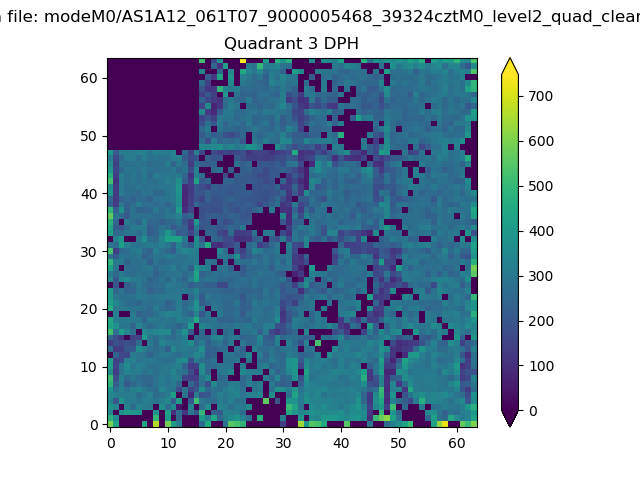 |
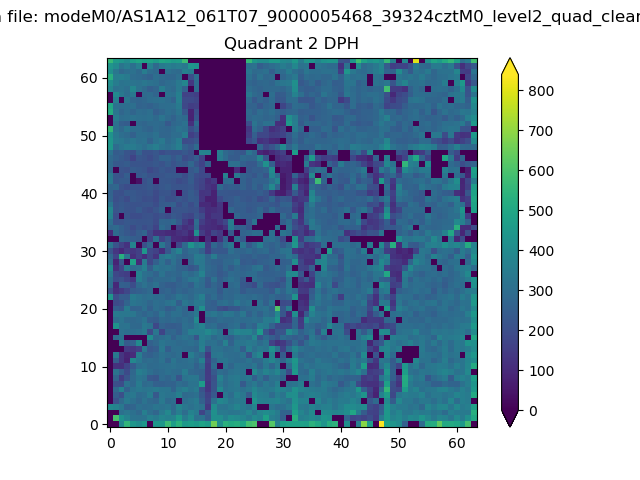 |
Quadrant C |
| Plot type | Count rate plots | Images |
|---|---|---|
| Comparison with Poisson distribution Blue bars denote a histogram of data divided into 1 sec bins. Red curve is a Poisson curve with rate = median count rate of data. |
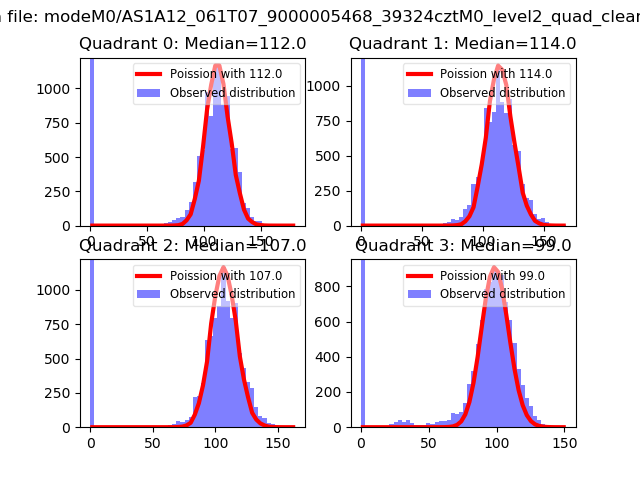 |
 |
| Quadrant-wise count rates Data is divided into 100 sec bins |
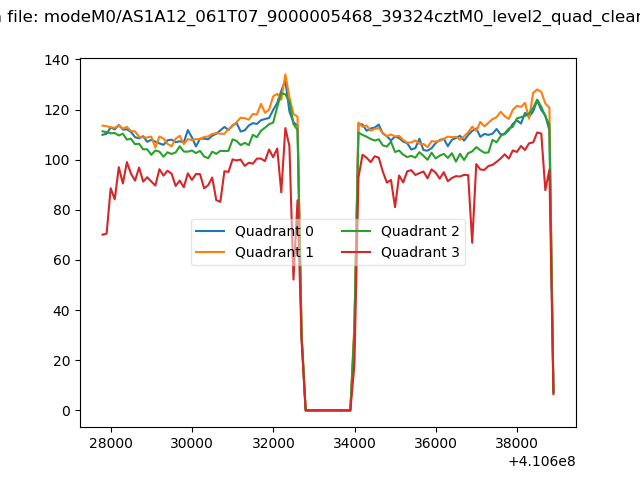 |
|
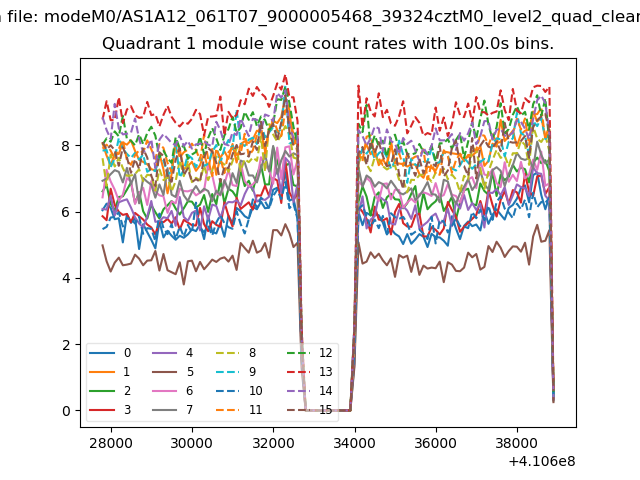
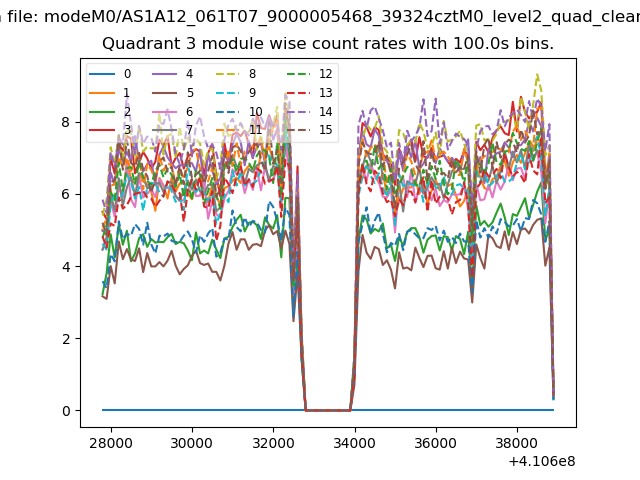
| Module-wise count rates for Quadrant A Data is divided into 100 sec bins |
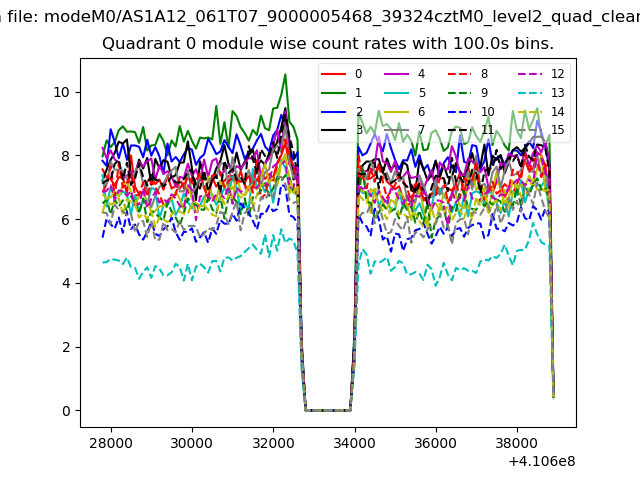 |
 |
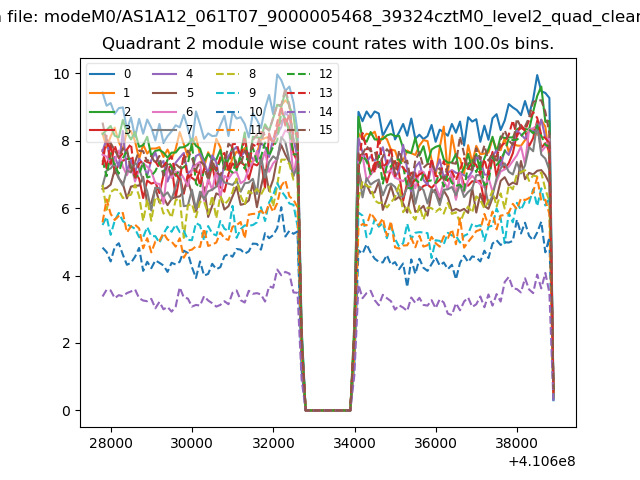
| Module-wise count rates for Quadrant B Data is divided into 100 sec bins |
 |
 |
| Module-wise count rates for Quadrant C Data is divided into 100 sec bins |
 |
 |
| Module-wise count rates for Quadrant D Data is divided into 100 sec bins |
 |
 |
| Parameter | Plot |
|---|---|
| CZT HV Monitor | 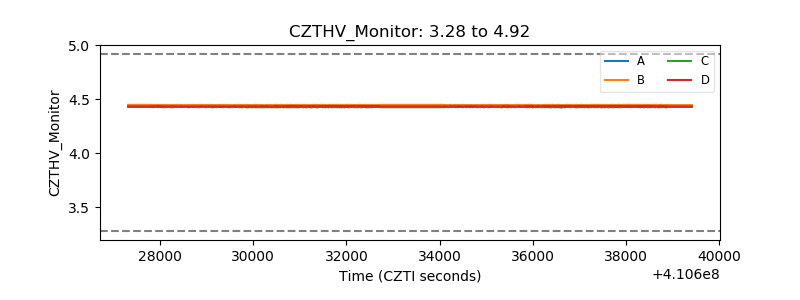 |
| D_VDD | 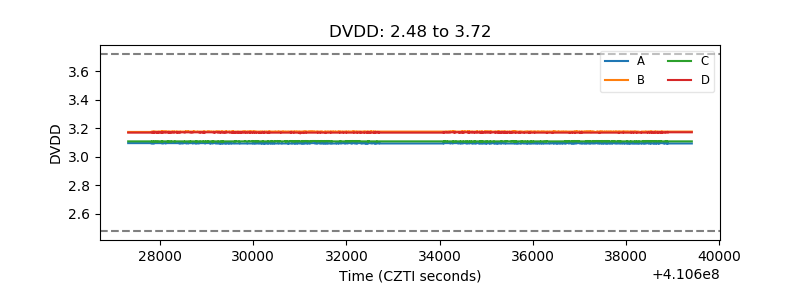 |
| Temperature 1 | 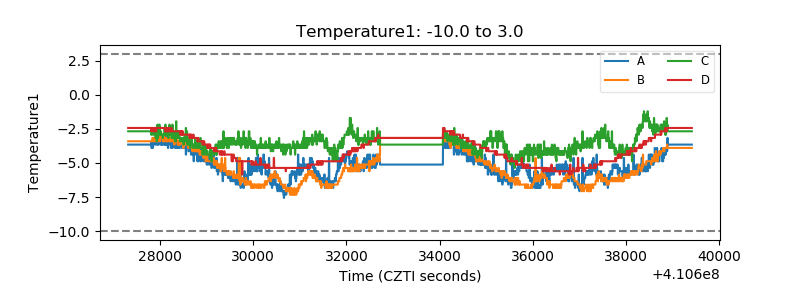 |
| Veto HV Monitor | 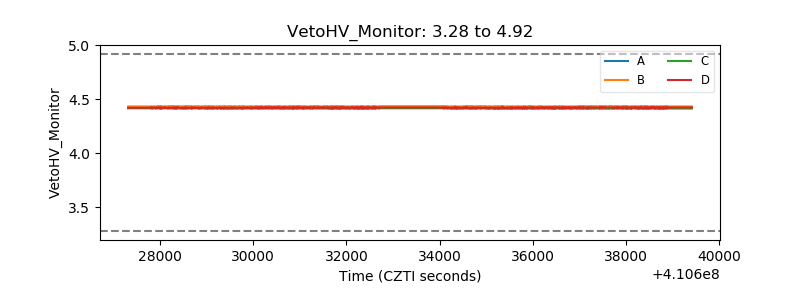 |
| Veto LLD | 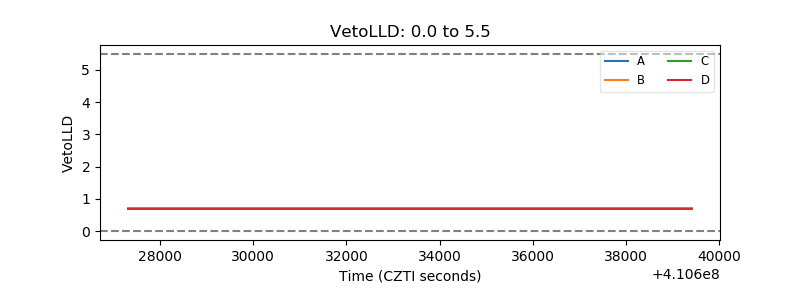 |
| Alpha Counter | 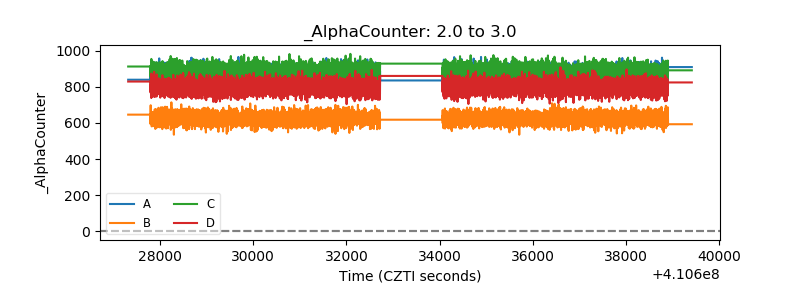 |
| _CPM_Rate | 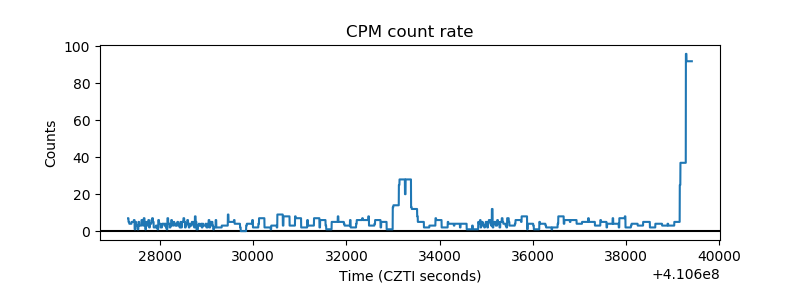 |
| CZT Counter | 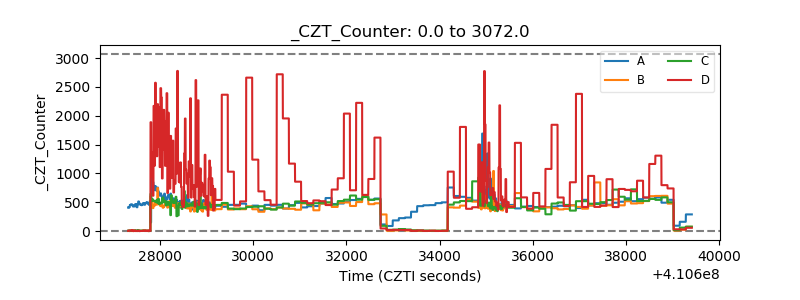 |
| +2.5 Volts monitor | 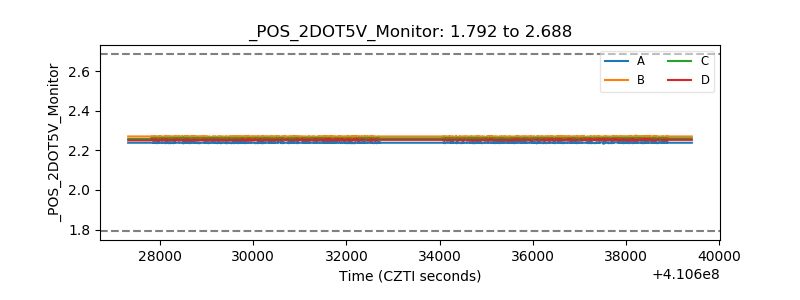 |
| +5 Volts monitor | 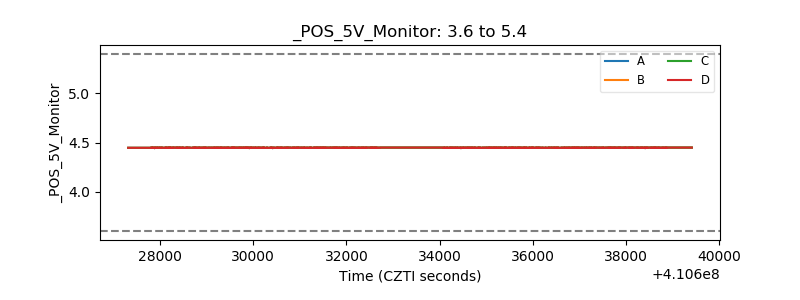 |
| _ROLL_ROT | 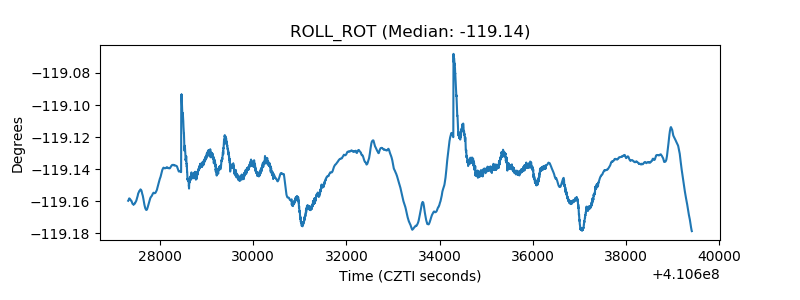 |
| _Roll_DEC | 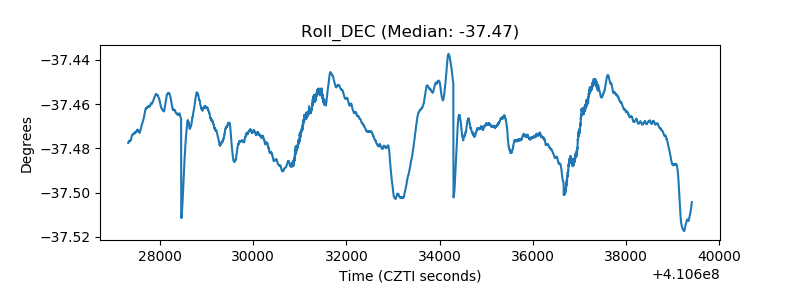 |
| _Roll_RA | 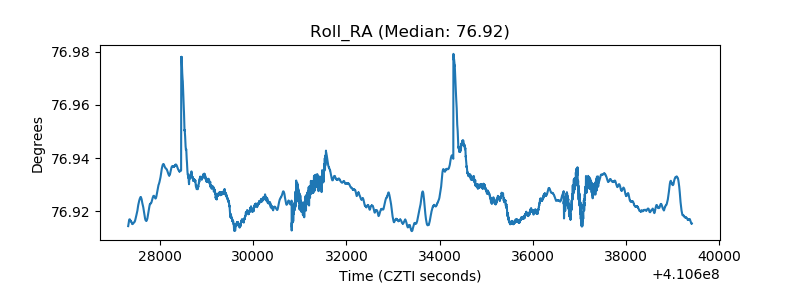 |
| Veto Counter | 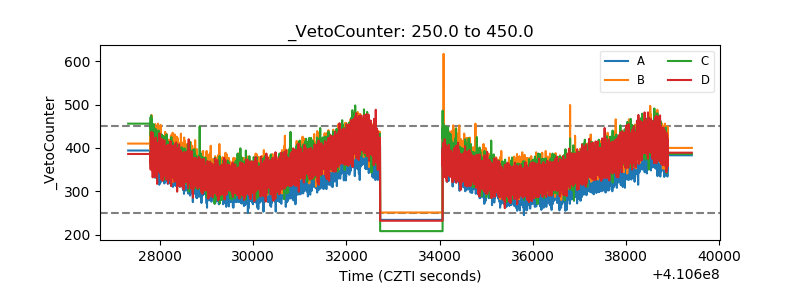 |