| Param | Original file | Final file |
|---|---|---|
| Filename | modeM0/AS1A12_061T07_9000005468_39325cztM0_level2.fits | modeM0/AS1A12_061T07_9000005468_39325cztM0_level2_quad_clean.evt |
| Size (bytes) | 404,248,320 | 93,723,840 |
| Size | 385.5 MB | 89.4 MB |
| Events in quadrant A | 2,967,530 | 637,855 |
| Events in quadrant B | 3,630,836 | 633,206 |
| Events in quadrant C | 2,782,741 | 614,062 |
| Events in quadrant D | 5,139,149 | 553,725 |
| Mode M9 | |||
|---|---|---|---|
| Quadrant | BADHDUFLAG | Total packets | Discarded packets |
| A | 0 | 25 | 0 |
| B | 0 | 25 | 0 |
| C | 0 | 25 | 0 |
| D | 0 | 26 | 0 |
| Mode SS | |||
|---|---|---|---|
| Quadrant | BADHDUFLAG | Total packets | Discarded packets |
| A | 0 | 116 | 0 |
| B | 0 | 116 | 0 |
| C | 0 | 116 | 0 |
| D | 0 | 116 | 0 |
| Mode M0 | |||
|---|---|---|---|
| Quadrant | BADHDUFLAG | Total packets | Discarded packets |
| A | 0 | 12449 | 3 |
| B | 0 | 14676 | 2 |
| C | 0 | 11910 | 2 |
| D | 0 | 19241 | 2 |
| Quadrant | Total seconds | Saturated seconds | Saturation percentage |
|---|---|---|---|
| A | 5706 | 25 | 0.438135% |
| B | 5706 | 243 | 4.258675% |
| C | 5706 | 6 | 0.105152% |
| D | 5706 | 303 | 5.310200% |
Noise dominated data is calculated using 1-second bins in cleaned event files. If a bin has >2000 counts, and if more than 50% of those come from <1% of pixels, then it is considered to be noise-dominated and hence unusable.
| Quadrant | # 1 sec bins | Bins with >0 counts | Bins with >2000 counts | High rate bins dominated by noise | Noise dominated (total time) | Noise dominated (detector-on time) | Marked lightcurve |
|---|---|---|---|---|---|---|---|
| A | 7228 | 5707 | 10 | 10 | 0.14% | 0.18% | 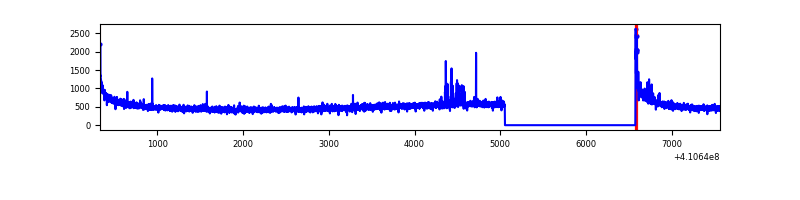 |
| B | 7228 | 5707 | 171 | 171 | 2.37% | 3.00% | 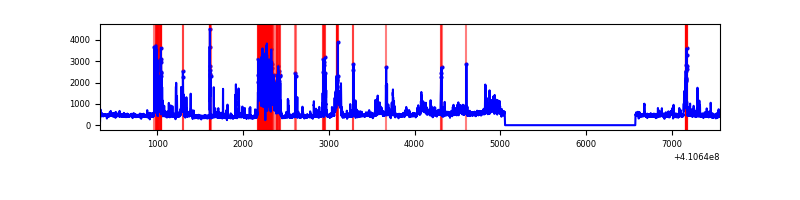 |
| C | 7228 | 5707 | 0 | 0 | 0.00% | 0.00% | 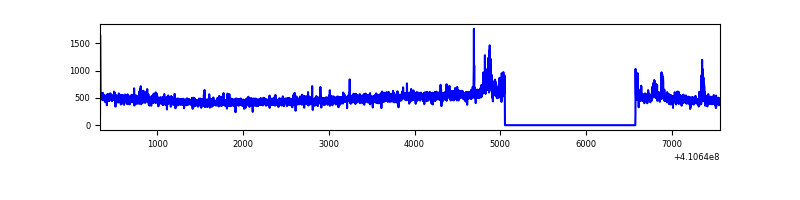 |
| D | 7228 | 5707 | 317 | 317 | 4.39% | 5.55% | 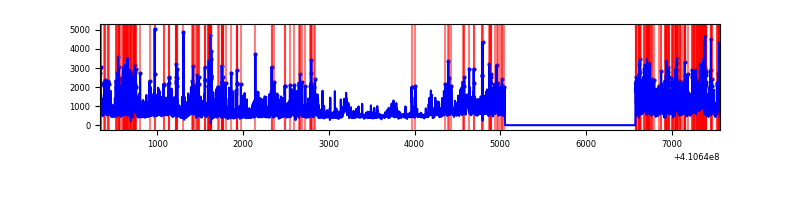 |
Top three noisy pixels from each quadrant. If the there are fewer than three noisy pixels in the level2.evt file, extra rows are filled as -1
| Pixel properties | Quadrant properties | ||||||
|---|---|---|---|---|---|---|---|
| Quadrant | DetID | PixID | Counts | Sigma | Mean | Median | Sigma |
| A | 10 | 83 | 426520 | 3319.01 | 632 | 619 | 128.3 |
| A | 13 | 248 | 73442 | 567.5 | 632 | 619 | 128.3 |
| A | 15 | 222 | 26307 | 200.18 | 632 | 619 | 128.3 |
| B | 5 | 172 | 1123453 | 9245.32 | 622 | 605 | 121.5 |
| B | 0 | 213 | 44188 | 358.85 | 622 | 605 | 121.5 |
| B | 12 | 111 | 15622 | 123.65 | 622 | 605 | 121.5 |
| C | 15 | 214 | 260552 | 1788.81 | 616 | 620 | 145.3 |
| C | 9 | 187 | 90100 | 615.79 | 616 | 620 | 145.3 |
| C | 14 | 254 | 14822 | 97.74 | 616 | 620 | 145.3 |
| D | 12 | 235 | 2049039 | 13779.08 | 601 | 584 | 148.7 |
| D | 5 | 222 | 314275 | 2110.07 | 601 | 584 | 148.7 |
| D | 13 | 249 | 273882 | 1838.36 | 601 | 584 | 148.7 |
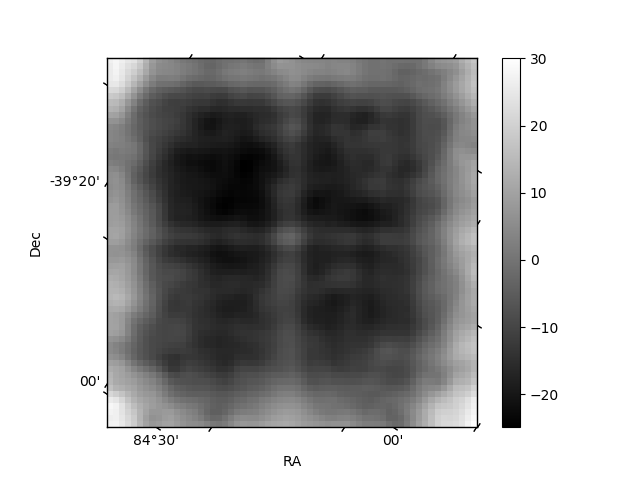
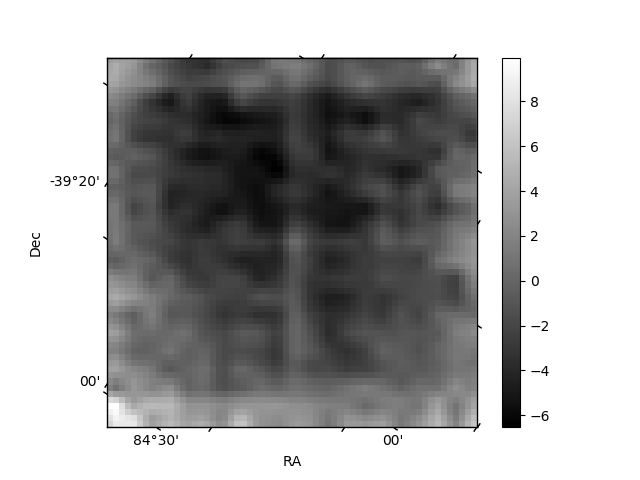
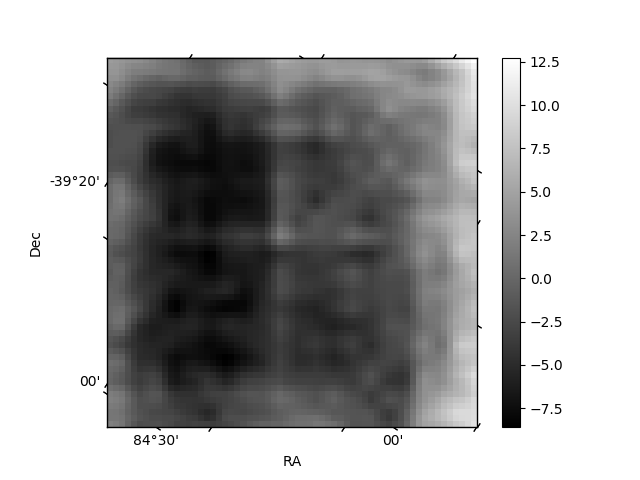
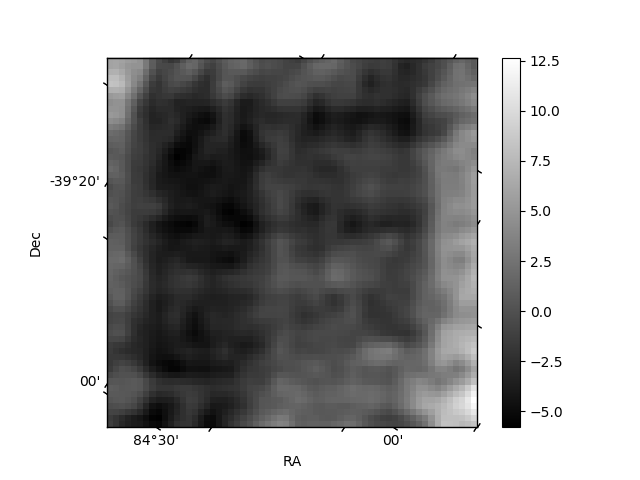
Histogram calculated using DETX and DETY for each event in the final _common_clean file
| Quadrant A | 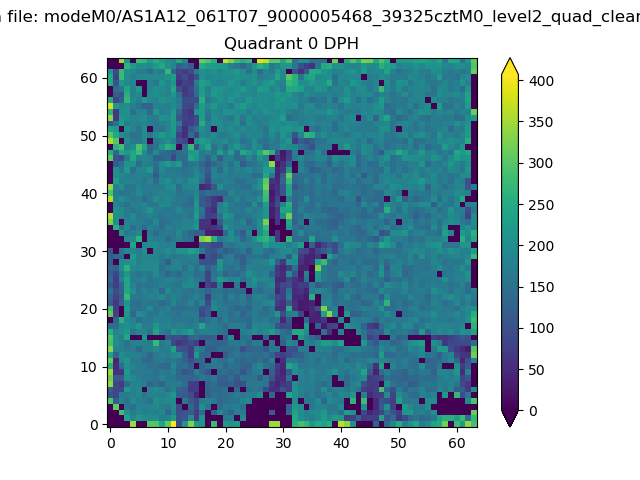 |
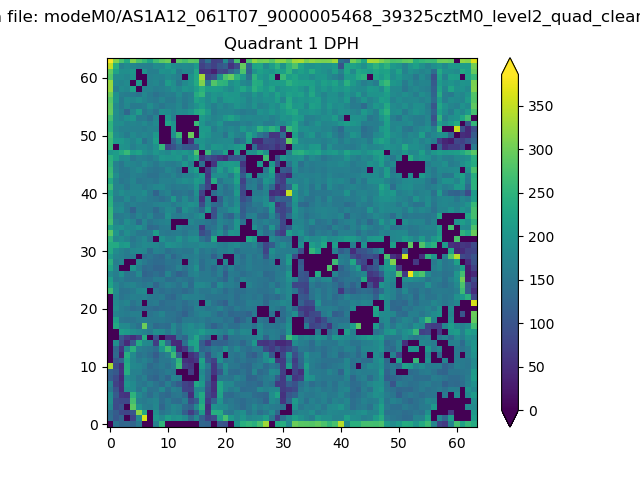 |
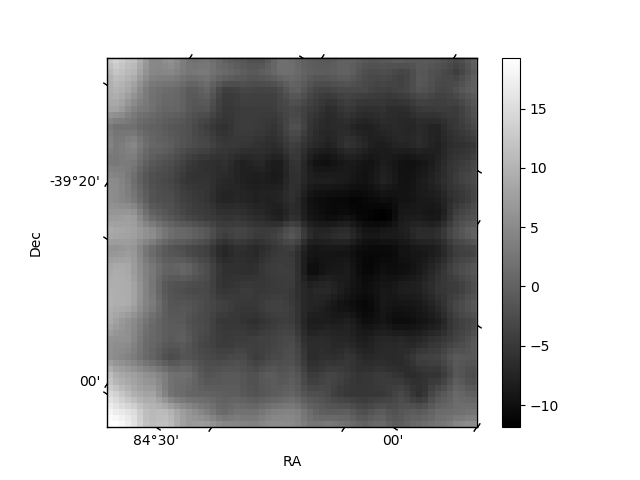
Quadrant B |
|---|---|---|---|
| Quadrant D | 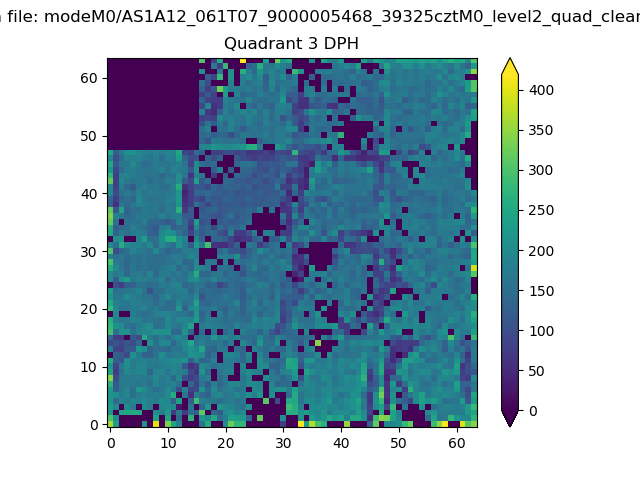 |
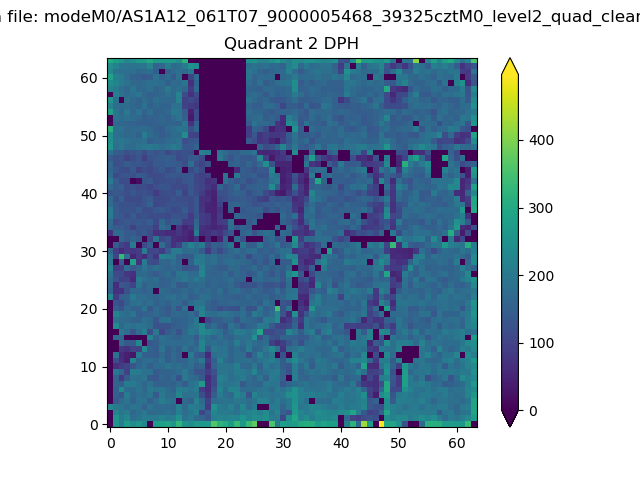 |
Quadrant C |
| Plot type | Count rate plots | Images |
|---|---|---|
| Comparison with Poisson distribution Blue bars denote a histogram of data divided into 1 sec bins. Red curve is a Poisson curve with rate = median count rate of data. |
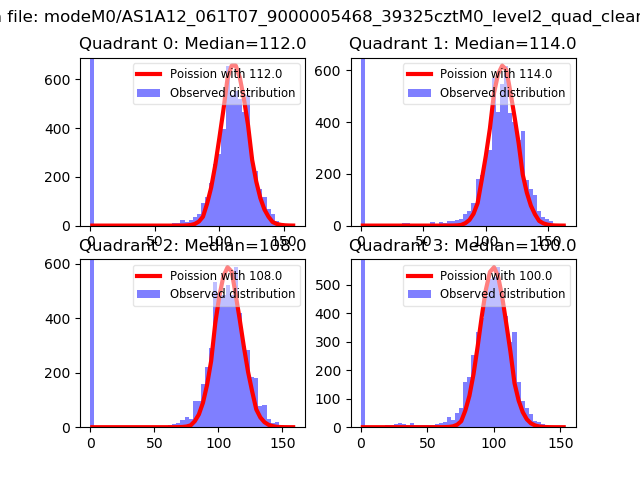 |
 |
| Quadrant-wise count rates Data is divided into 100 sec bins |
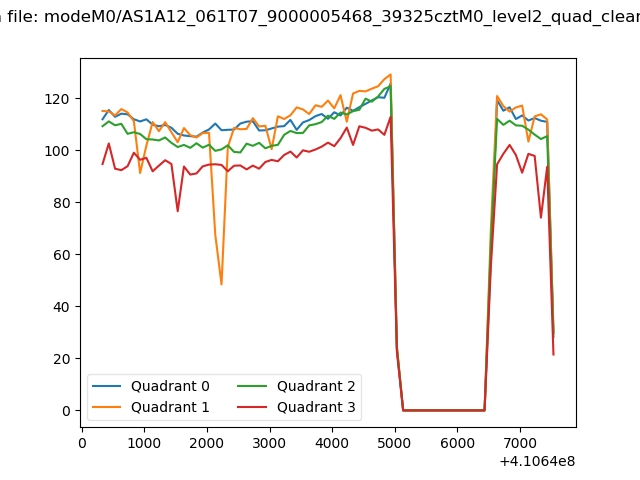 |
|
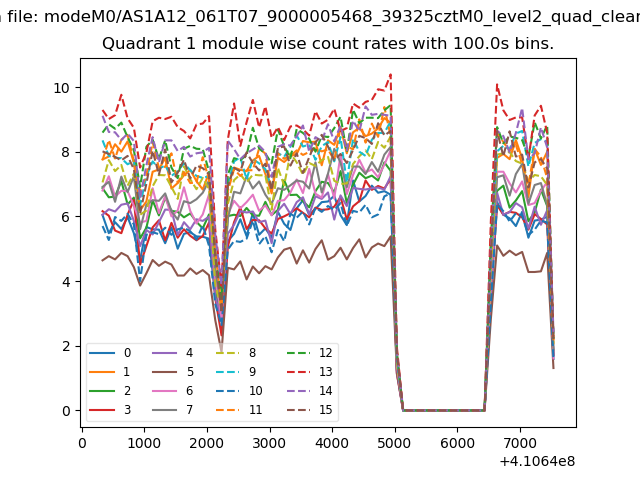
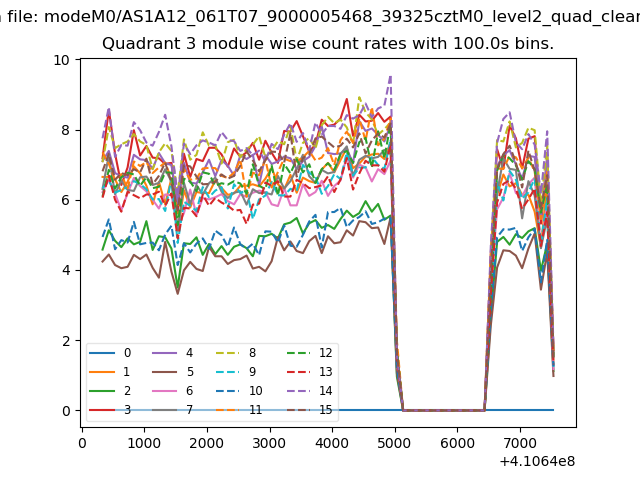
| Module-wise count rates for Quadrant A Data is divided into 100 sec bins |
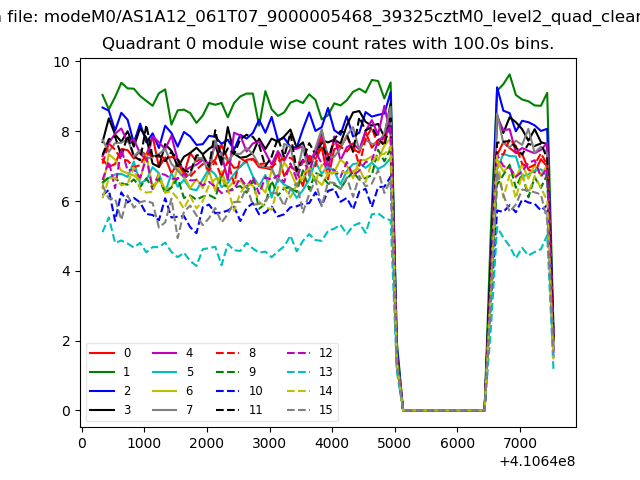 |
 |
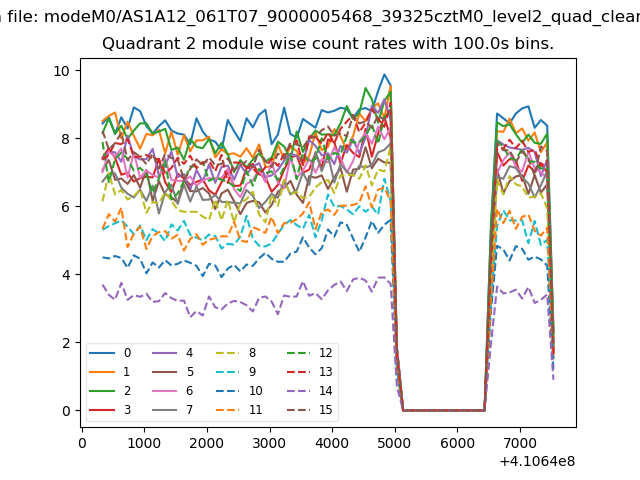
| Module-wise count rates for Quadrant B Data is divided into 100 sec bins |
 |
 |
| Module-wise count rates for Quadrant C Data is divided into 100 sec bins |
 |
 |
| Module-wise count rates for Quadrant D Data is divided into 100 sec bins |
 |
 |
| Parameter | Plot |
|---|---|
| CZT HV Monitor | 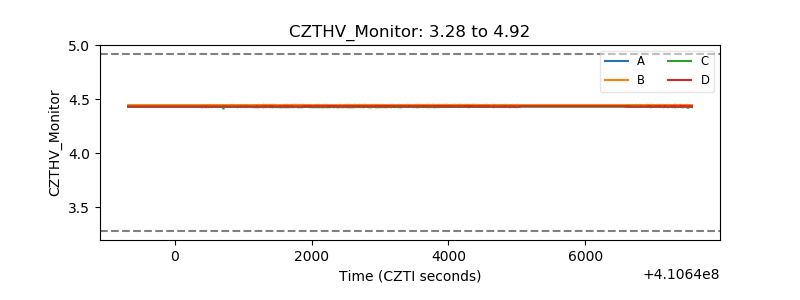 |
| D_VDD | 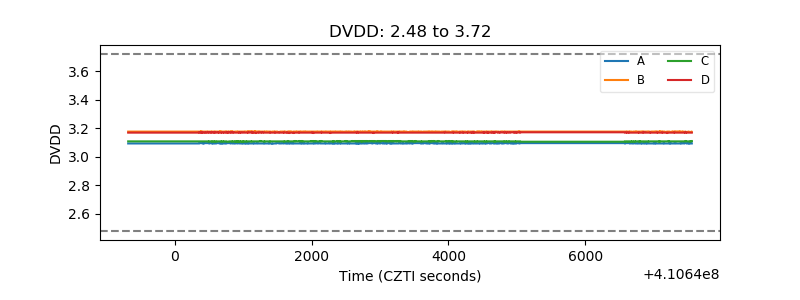 |
| Temperature 1 | 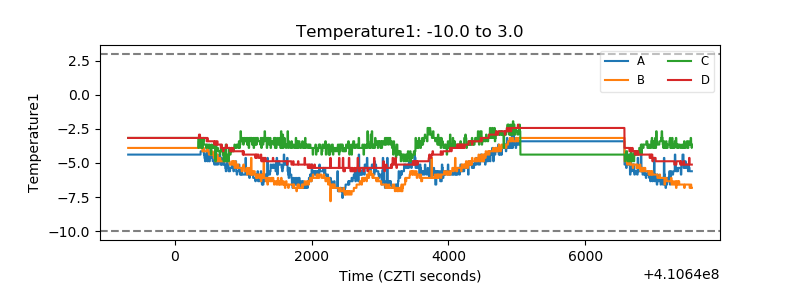 |
| Veto HV Monitor | 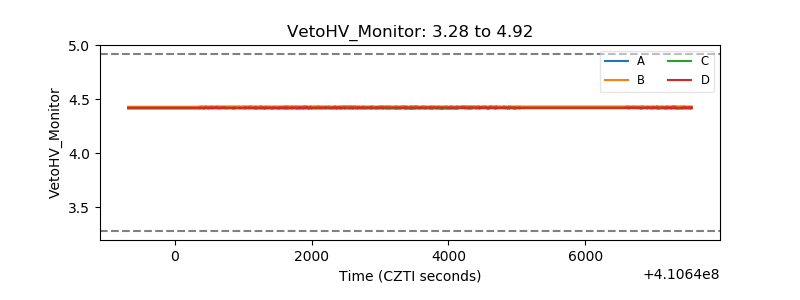 |
| Veto LLD | 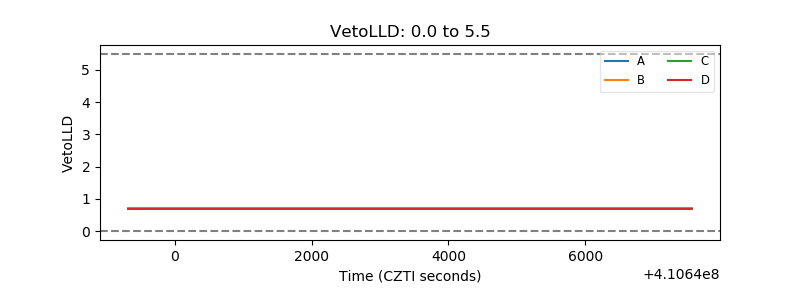 |
| Alpha Counter | 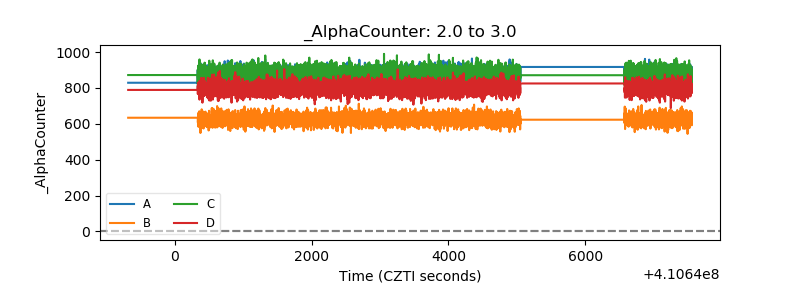 |
| _CPM_Rate |  |
| CZT Counter | 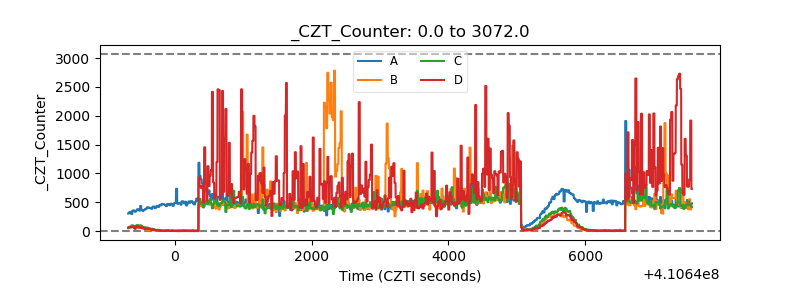 |
| +2.5 Volts monitor | 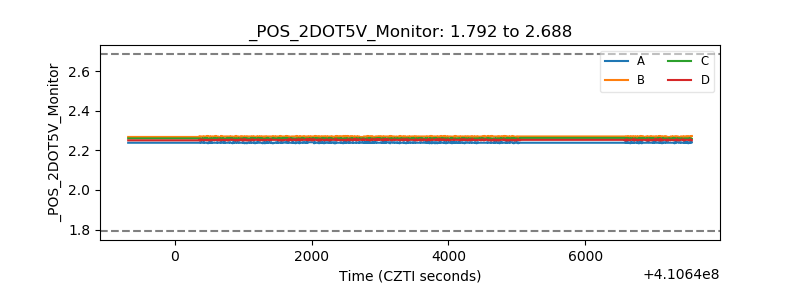 |
| +5 Volts monitor | 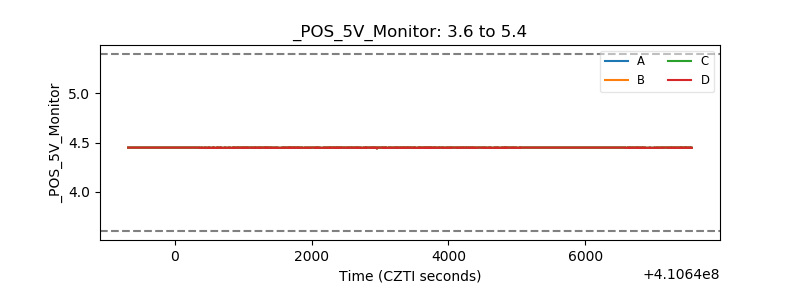 |
| _ROLL_ROT | 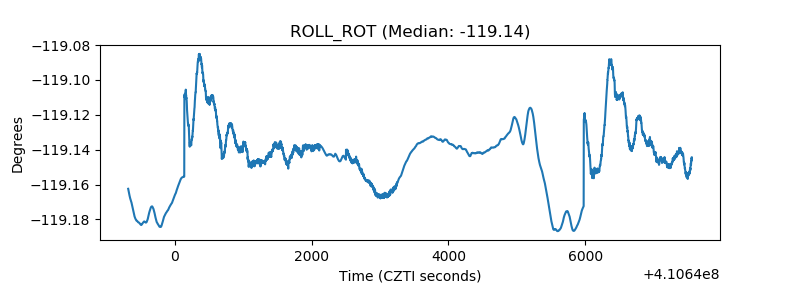 |
| _Roll_DEC | 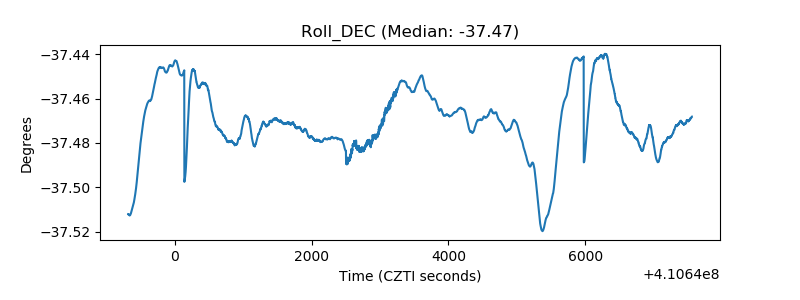 |
| _Roll_RA | 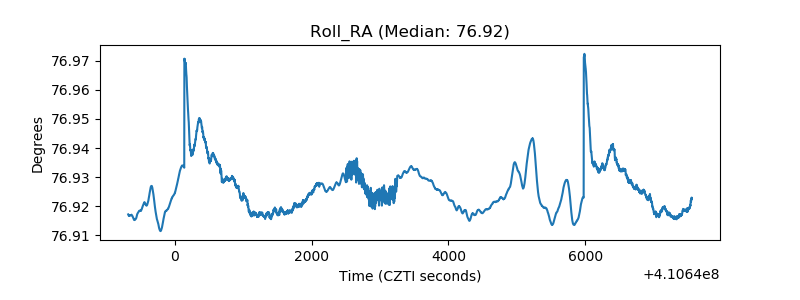 |
| Veto Counter | 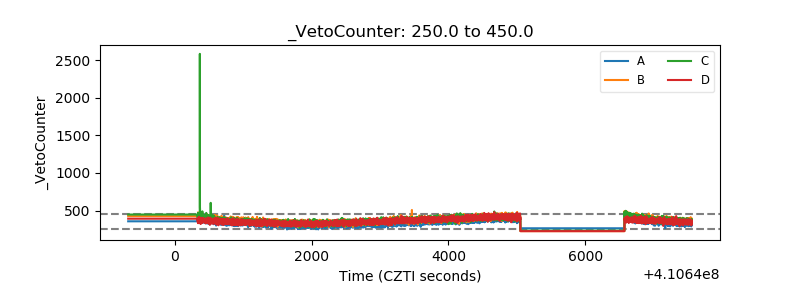 |