| Param | Original file | Final file |
|---|---|---|
| Filename | modeM0/AS1A12_061T07_9000005468_39326cztM0_level2.fits | modeM0/AS1A12_061T07_9000005468_39326cztM0_level2_quad_clean.evt |
| Size (bytes) | 388,324,800 | 89,737,920 |
| Size | 370.3 MB | 85.6 MB |
| Events in quadrant A | 2,775,119 | 611,736 |
| Events in quadrant B | 3,013,779 | 617,633 |
| Events in quadrant C | 2,739,512 | 589,812 |
| Events in quadrant D | 5,425,744 | 519,389 |
| Mode M9 | |||
|---|---|---|---|
| Quadrant | BADHDUFLAG | Total packets | Discarded packets |
| A | 0 | 24 | 0 |
| B | 0 | 24 | 0 |
| C | 0 | 24 | 0 |
| D | 0 | 25 | 0 |
| Mode SS | |||
|---|---|---|---|
| Quadrant | BADHDUFLAG | Total packets | Discarded packets |
| A | 0 | 110 | 0 |
| B | 0 | 110 | 0 |
| C | 0 | 110 | 0 |
| D | 0 | 110 | 0 |
| Mode M0 | |||
|---|---|---|---|
| Quadrant | BADHDUFLAG | Total packets | Discarded packets |
| A | 0 | 11604 | 3 |
| B | 0 | 12519 | 2 |
| C | 0 | 11472 | 2 |
| D | 0 | 19901 | 2 |
| Quadrant | Total seconds | Saturated seconds | Saturation percentage |
|---|---|---|---|
| A | 5407 | 14 | 0.258924% |
| B | 5407 | 115 | 2.126873% |
| C | 5407 | 14 | 0.258924% |
| D | 5407 | 423 | 7.823192% |
Noise dominated data is calculated using 1-second bins in cleaned event files. If a bin has >2000 counts, and if more than 50% of those come from <1% of pixels, then it is considered to be noise-dominated and hence unusable.
| Quadrant | # 1 sec bins | Bins with >0 counts | Bins with >2000 counts | High rate bins dominated by noise | Noise dominated (total time) | Noise dominated (detector-on time) | Marked lightcurve |
|---|---|---|---|---|---|---|---|
| A | 7079 | 5408 | 11 | 11 | 0.16% | 0.20% | 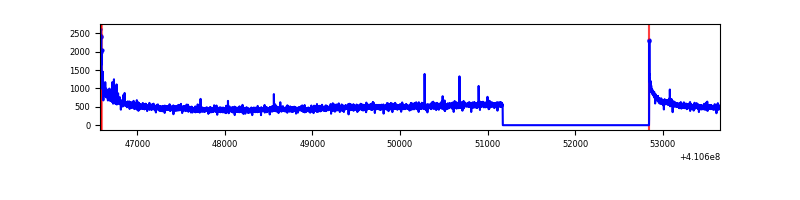 |
| B | 7079 | 5408 | 80 | 80 | 1.13% | 1.48% | 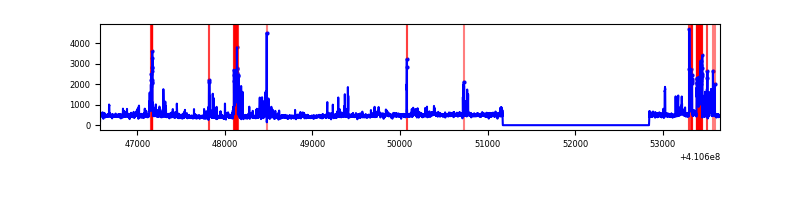 |
| C | 7079 | 5408 | 6 | 6 | 0.08% | 0.11% | 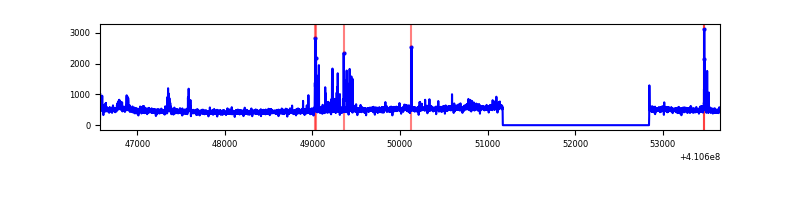 |
| D | 7079 | 5408 | 401 | 401 | 5.66% | 7.41% | 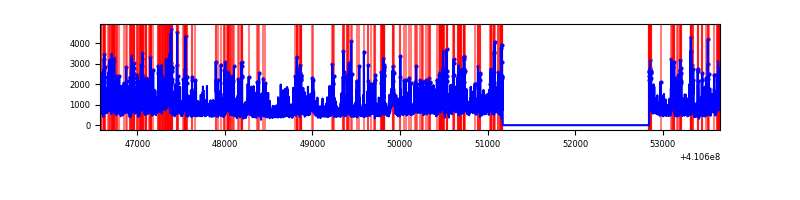 |
Top three noisy pixels from each quadrant. If the there are fewer than three noisy pixels in the level2.evt file, extra rows are filled as -1
| Pixel properties | Quadrant properties | ||||||
|---|---|---|---|---|---|---|---|
| Quadrant | DetID | PixID | Counts | Sigma | Mean | Median | Sigma |
| A | 10 | 83 | 405868 | 3322.55 | 601 | 589 | 122.0 |
| A | 13 | 248 | 32870 | 264.65 | 601 | 589 | 122.0 |
| A | 15 | 222 | 10170 | 78.55 | 601 | 589 | 122.0 |
| B | 5 | 172 | 606668 | 5157.92 | 599 | 582 | 117.5 |
| B | 5 | 255 | 22482 | 186.37 | 599 | 582 | 117.5 |
| B | 0 | 213 | 21536 | 178.32 | 599 | 582 | 117.5 |
| C | 15 | 214 | 247343 | 1778.77 | 591 | 595 | 138.7 |
| C | 14 | 254 | 92885 | 665.31 | 591 | 595 | 138.7 |
| C | 9 | 187 | 59203 | 422.5 | 591 | 595 | 138.7 |
| D | 12 | 235 | 2440192 | 17322.9 | 571 | 556 | 140.8 |
| D | 5 | 222 | 325592 | 2307.95 | 571 | 556 | 140.8 |
| D | 13 | 249 | 215378 | 1525.37 | 571 | 556 | 140.8 |
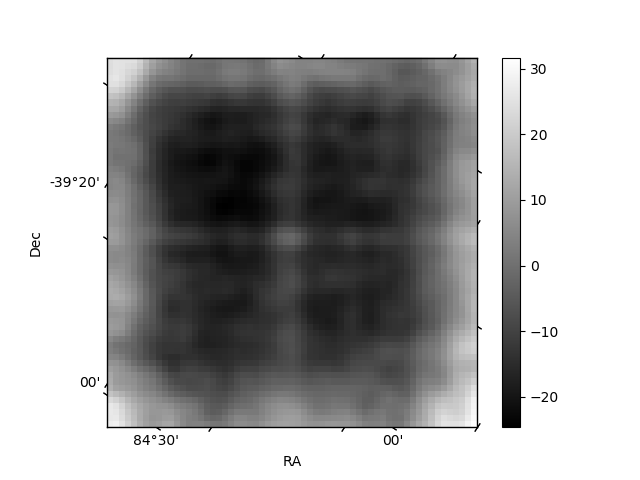
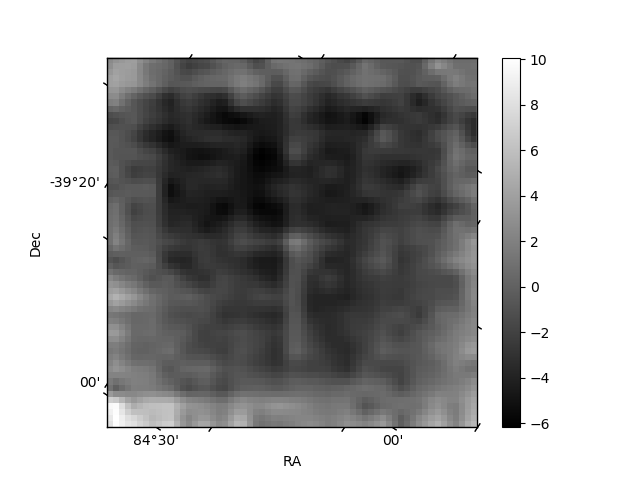
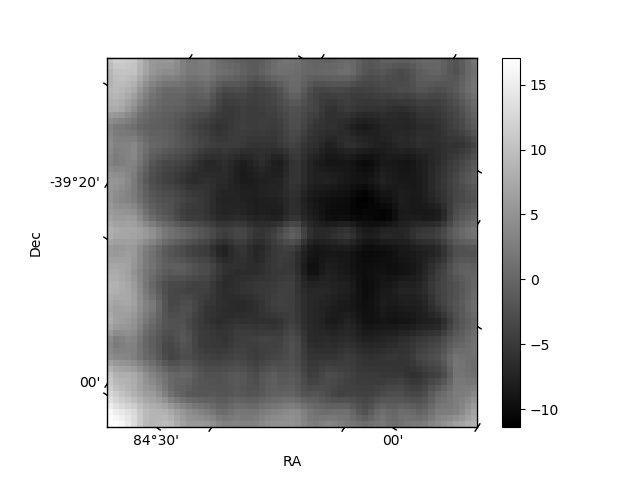
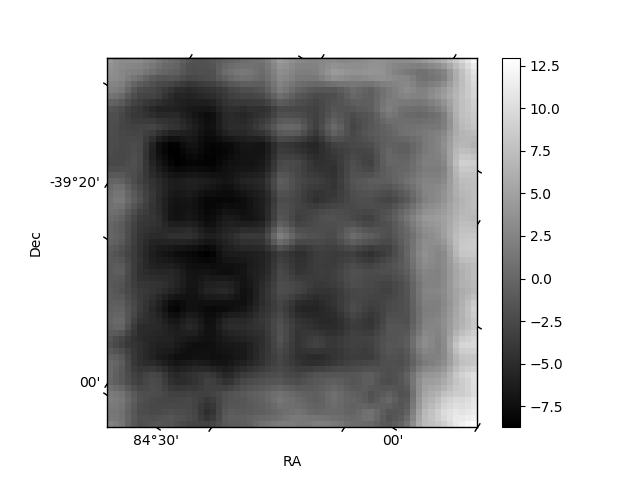
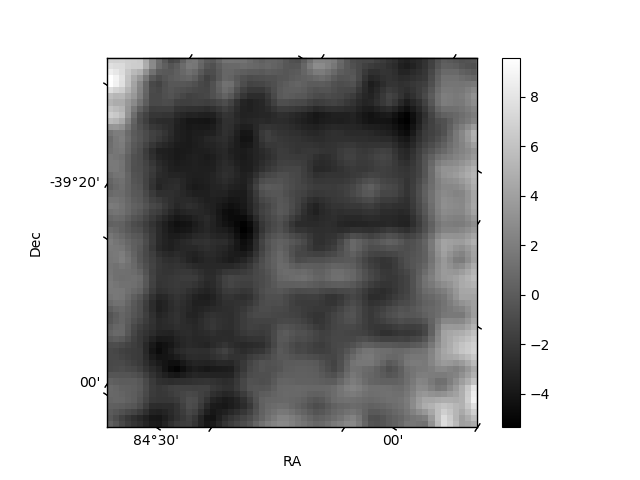
Histogram calculated using DETX and DETY for each event in the final _common_clean file
| Quadrant A | 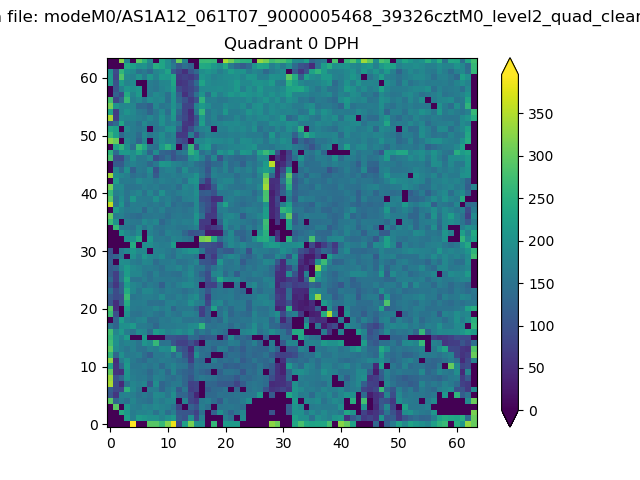 |
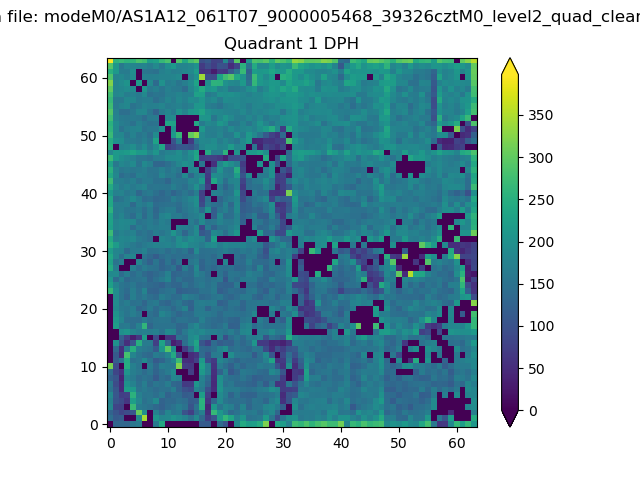 |
Quadrant B |
|---|---|---|---|
| Quadrant D | 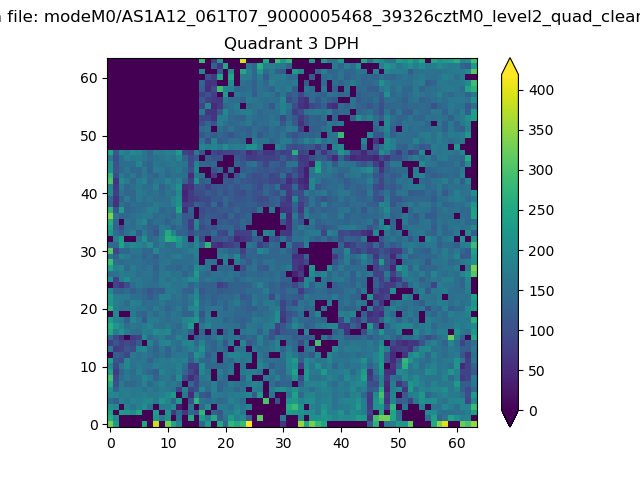 |
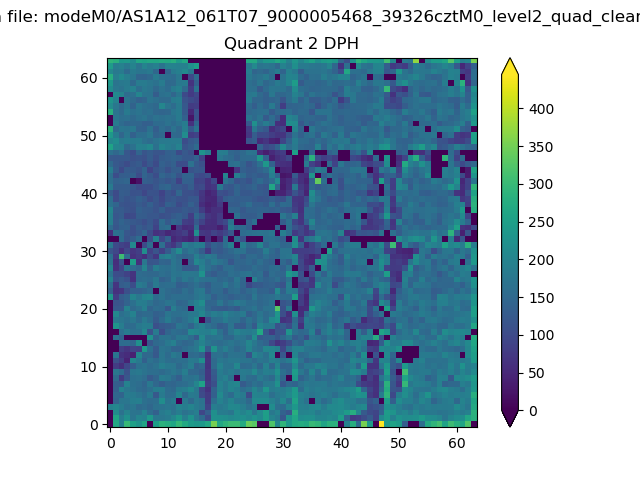 |
Quadrant C |
| Plot type | Count rate plots | Images |
|---|---|---|
| Comparison with Poisson distribution Blue bars denote a histogram of data divided into 1 sec bins. Red curve is a Poisson curve with rate = median count rate of data. |
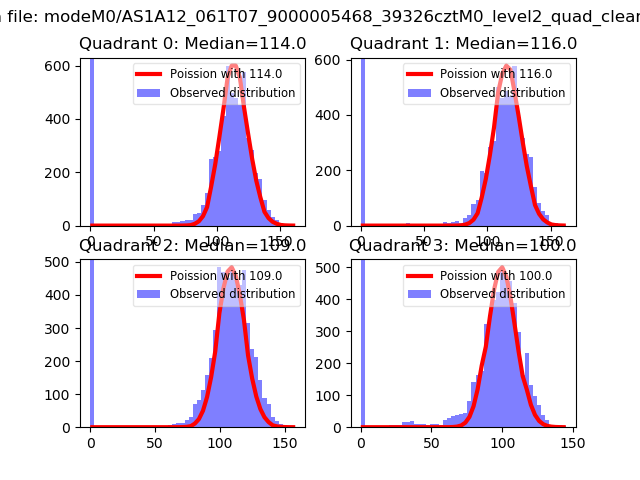 |
 |
| Quadrant-wise count rates Data is divided into 100 sec bins |
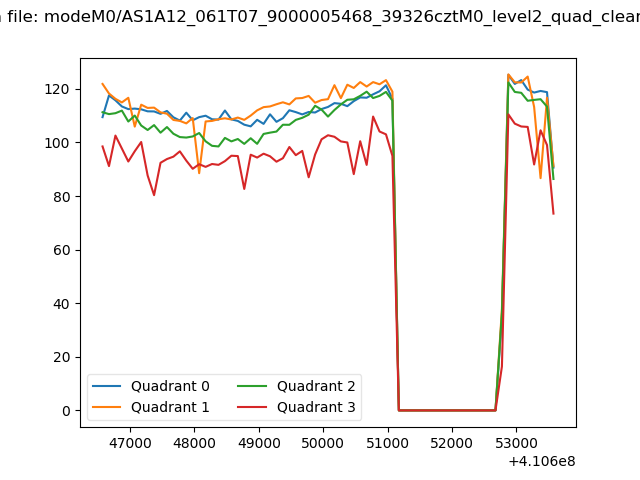 |
|
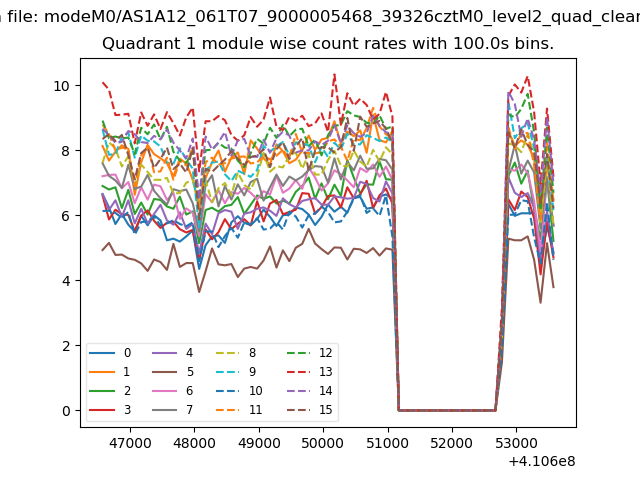
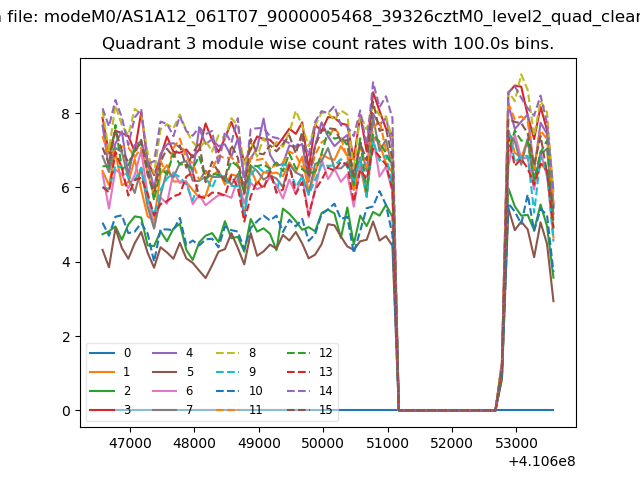
| Module-wise count rates for Quadrant A Data is divided into 100 sec bins |
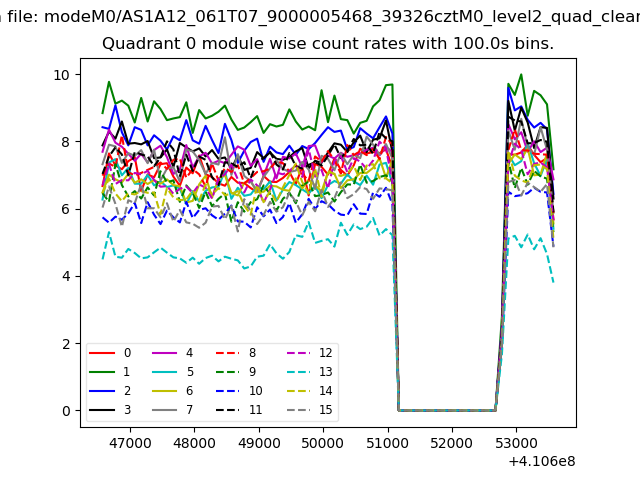 |
 |
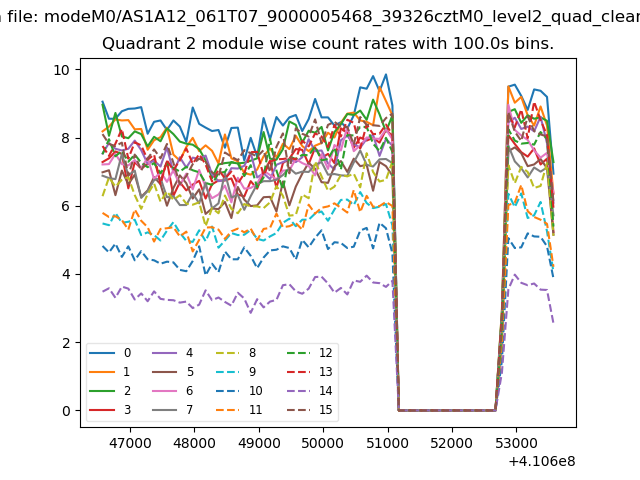
| Module-wise count rates for Quadrant B Data is divided into 100 sec bins |
 |
 |
| Module-wise count rates for Quadrant C Data is divided into 100 sec bins |
 |
 |
| Module-wise count rates for Quadrant D Data is divided into 100 sec bins |
 |
 |
| Parameter | Plot |
|---|---|
| CZT HV Monitor | 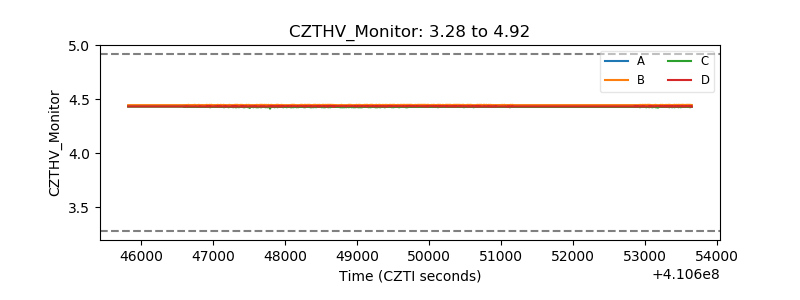 |
| D_VDD | 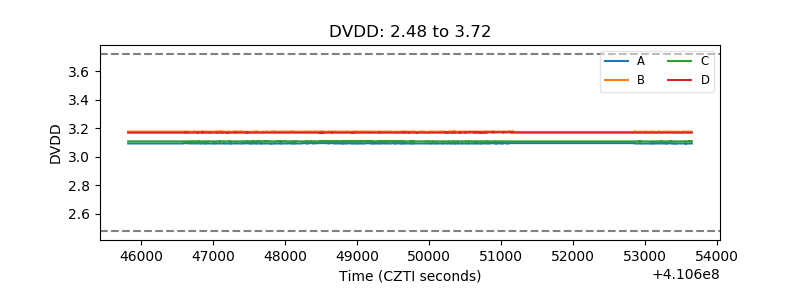 |
| Temperature 1 | 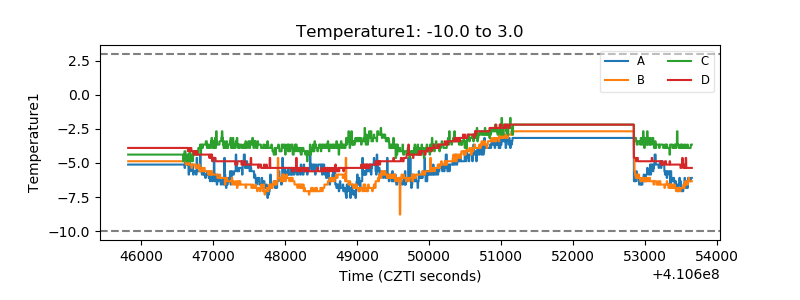 |
| Veto HV Monitor | 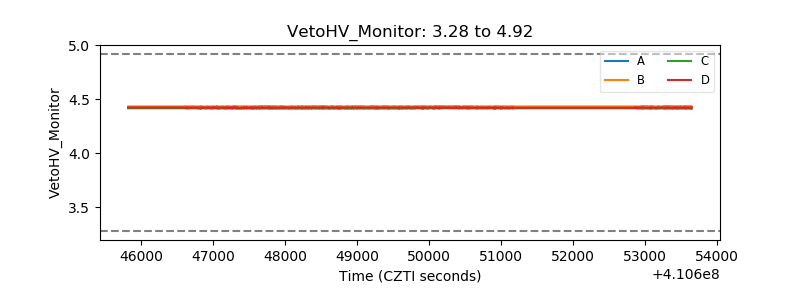 |
| Veto LLD | 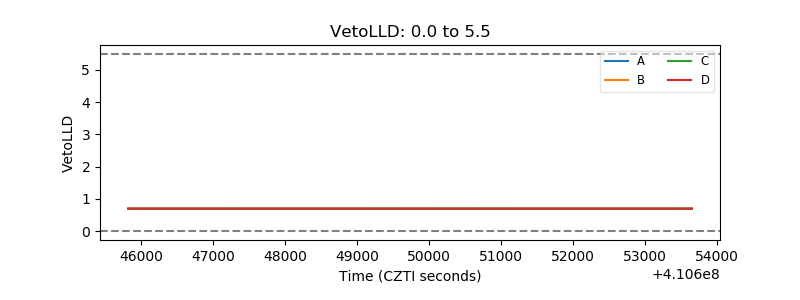 |
| Alpha Counter | 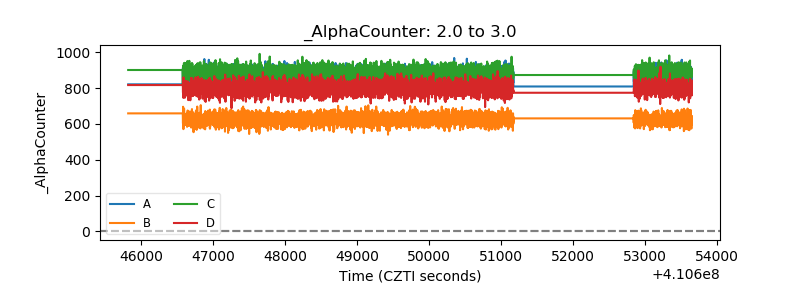 |
| _CPM_Rate | 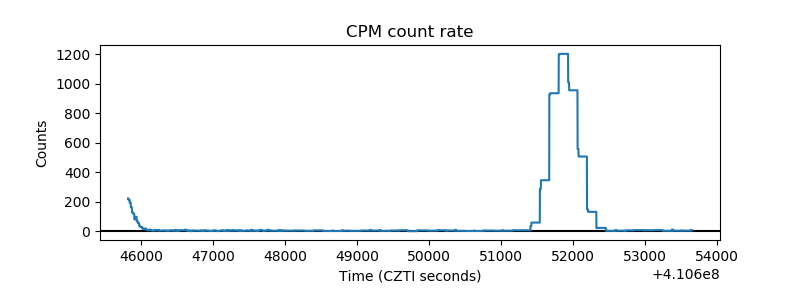 |
| CZT Counter | 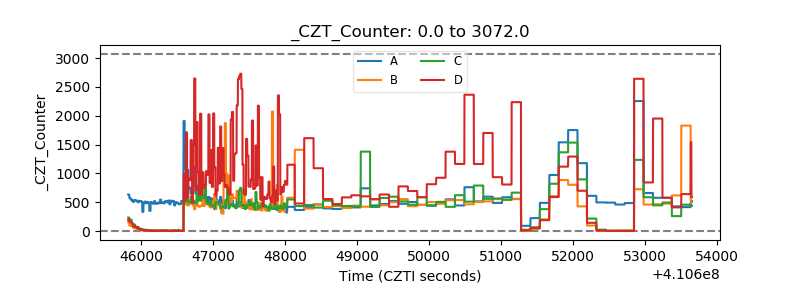 |
| +2.5 Volts monitor | 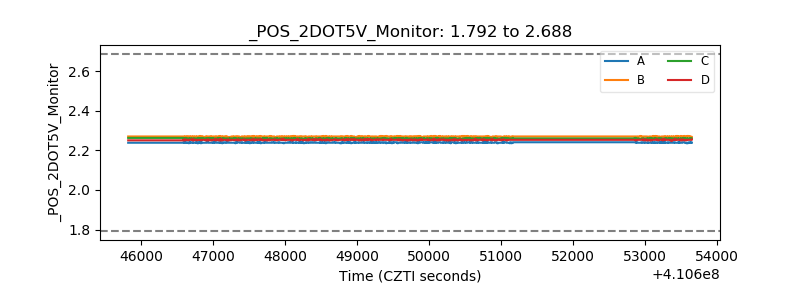 |
| +5 Volts monitor | 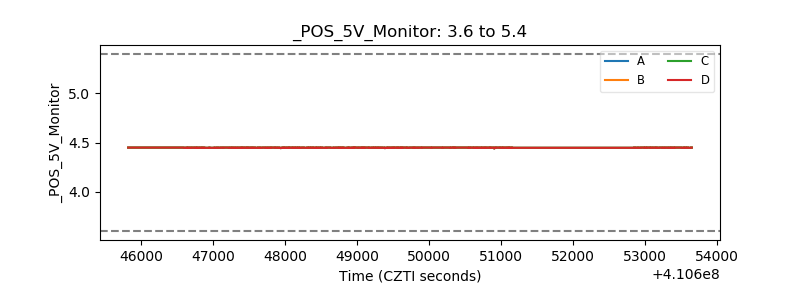 |
| _ROLL_ROT | 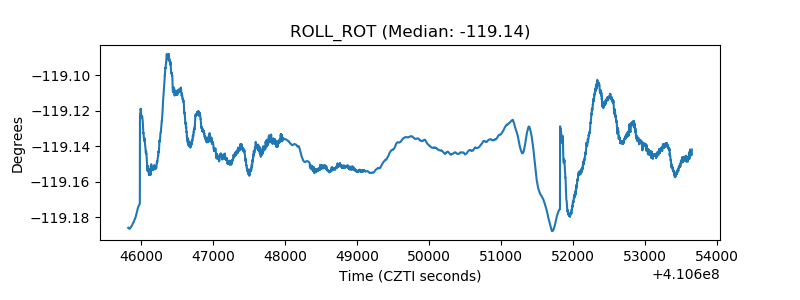 |
| _Roll_DEC | 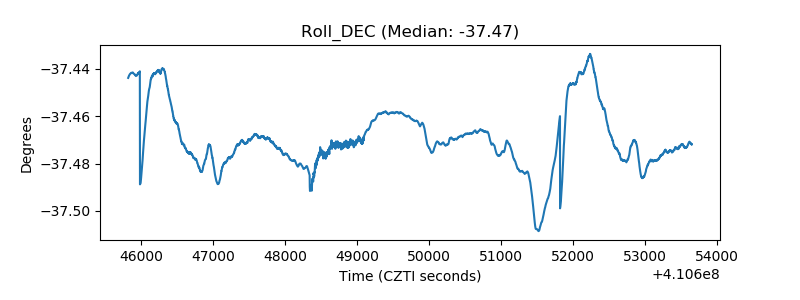 |
| _Roll_RA | 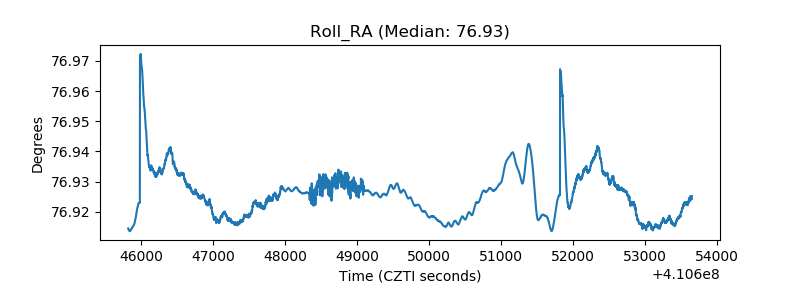 |
| Veto Counter | 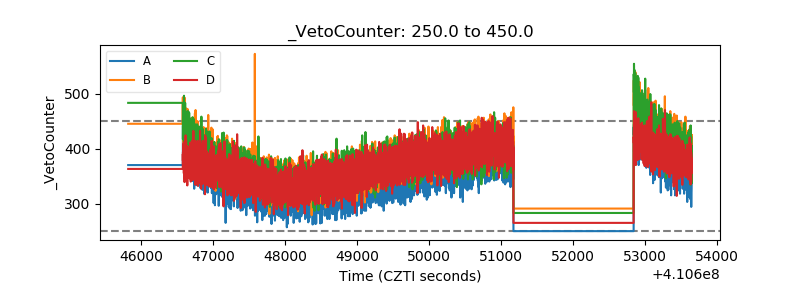 |