| Param | Original file | Final file |
|---|---|---|
| Filename | modeM0/AS1A12_061T07_9000005468_39328cztM0_level2.fits | modeM0/AS1A12_061T07_9000005468_39328cztM0_level2_quad_clean.evt |
| Size (bytes) | 389,494,080 | 90,904,320 |
| Size | 371.5 MB | 86.7 MB |
| Events in quadrant A | 2,850,665 | 621,750 |
| Events in quadrant B | 3,390,239 | 615,092 |
| Events in quadrant C | 2,755,332 | 606,652 |
| Events in quadrant D | 5,007,460 | 536,163 |
| Mode M9 | |||
|---|---|---|---|
| Quadrant | BADHDUFLAG | Total packets | Discarded packets |
| A | 0 | 33 | 0 |
| B | 0 | 33 | 0 |
| C | 0 | 33 | 0 |
| D | 0 | 34 | 0 |
| Mode SS | |||
|---|---|---|---|
| Quadrant | BADHDUFLAG | Total packets | Discarded packets |
| A | 0 | 108 | 0 |
| B | 0 | 108 | 0 |
| C | 0 | 108 | 0 |
| D | 0 | 108 | 0 |
| Mode M0 | |||
|---|---|---|---|
| Quadrant | BADHDUFLAG | Total packets | Discarded packets |
| A | 0 | 11697 | 2 |
| B | 0 | 13526 | 1 |
| C | 0 | 11360 | 1 |
| D | 0 | 18574 | 1 |
| Quadrant | Total seconds | Saturated seconds | Saturation percentage |
|---|---|---|---|
| A | 5327 | 33 | 0.619486% |
| B | 5327 | 264 | 4.955885% |
| C | 5327 | 9 | 0.168951% |
| D | 5327 | 337 | 6.326262% |
Noise dominated data is calculated using 1-second bins in cleaned event files. If a bin has >2000 counts, and if more than 50% of those come from <1% of pixels, then it is considered to be noise-dominated and hence unusable.
| Quadrant | # 1 sec bins | Bins with >0 counts | Bins with >2000 counts | High rate bins dominated by noise | Noise dominated (total time) | Noise dominated (detector-on time) | Marked lightcurve |
|---|---|---|---|---|---|---|---|
| A | 7120 | 5328 | 15 | 15 | 0.21% | 0.28% |  |
| B | 7120 | 5328 | 210 | 210 | 2.95% | 3.94% | 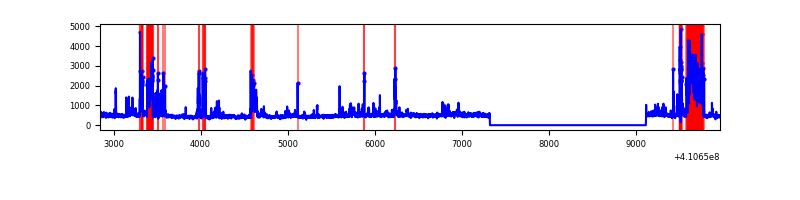 |
| C | 7120 | 5328 | 4 | 4 | 0.06% | 0.08% | 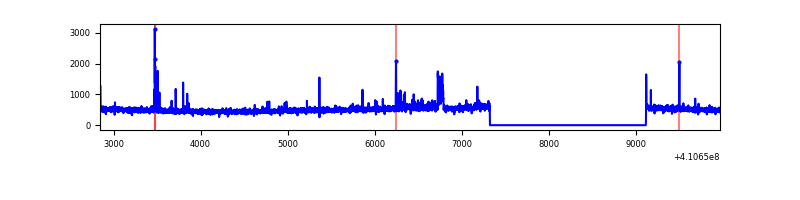 |
| D | 7120 | 5328 | 308 | 308 | 4.33% | 5.78% | 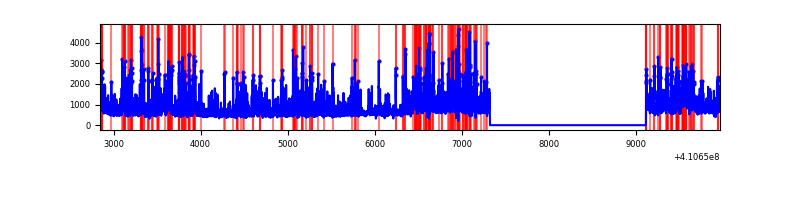 |
Top three noisy pixels from each quadrant. If the there are fewer than three noisy pixels in the level2.evt file, extra rows are filled as -1
| Pixel properties | Quadrant properties | ||||||
|---|---|---|---|---|---|---|---|
| Quadrant | DetID | PixID | Counts | Sigma | Mean | Median | Sigma |
| A | 10 | 83 | 411831 | 3313.26 | 607 | 595 | 124.1 |
| A | 13 | 248 | 80551 | 644.19 | 607 | 595 | 124.1 |
| A | 13 | 254 | 11228 | 85.67 | 607 | 595 | 124.1 |
| B | 5 | 172 | 502139 | 4330.18 | 593 | 576 | 115.8 |
| B | 5 | 255 | 488544 | 4212.81 | 593 | 576 | 115.8 |
| B | 0 | 213 | 57466 | 491.15 | 593 | 576 | 115.8 |
| C | 15 | 214 | 245260 | 1738.58 | 598 | 602 | 140.7 |
| C | 9 | 187 | 109680 | 775.13 | 598 | 602 | 140.7 |
| C | 15 | 159 | 24298 | 168.39 | 598 | 602 | 140.7 |
| D | 12 | 235 | 2126217 | 14900.2 | 579 | 563 | 142.7 |
| D | 13 | 249 | 338801 | 2370.95 | 579 | 563 | 142.7 |
| D | 2 | 16 | 165084 | 1153.24 | 579 | 563 | 142.7 |
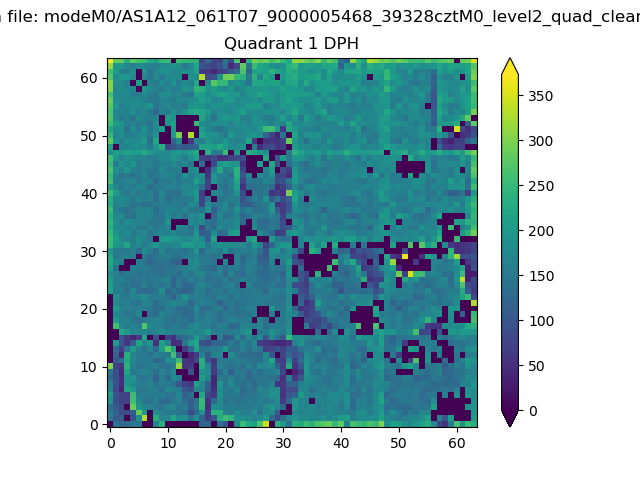
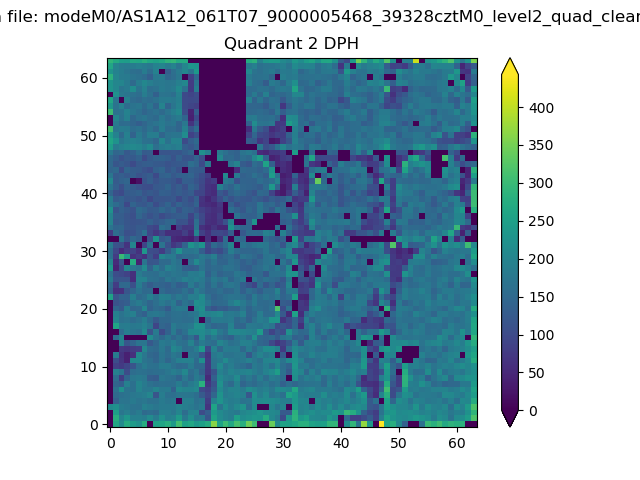
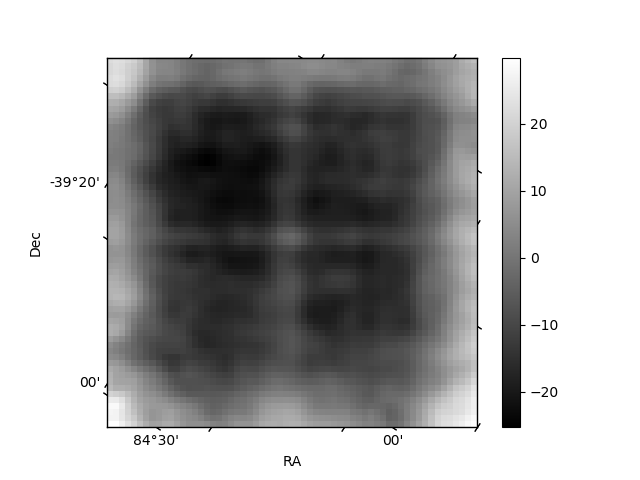
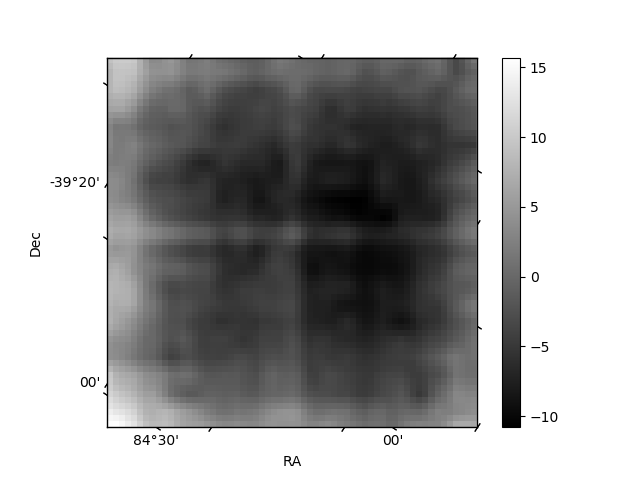
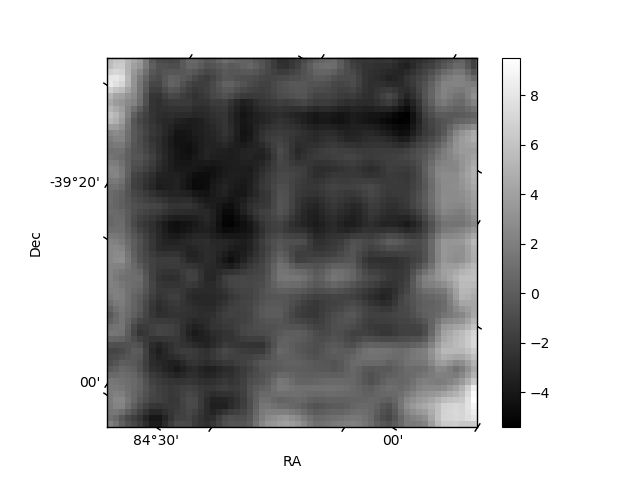
Histogram calculated using DETX and DETY for each event in the final _common_clean file
| Quadrant A | 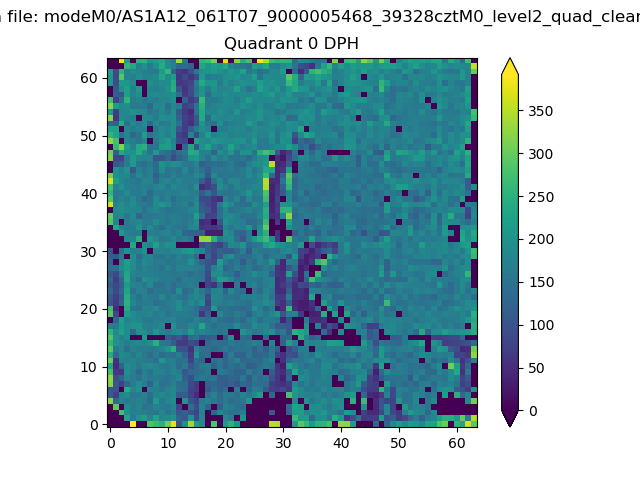 |
 |
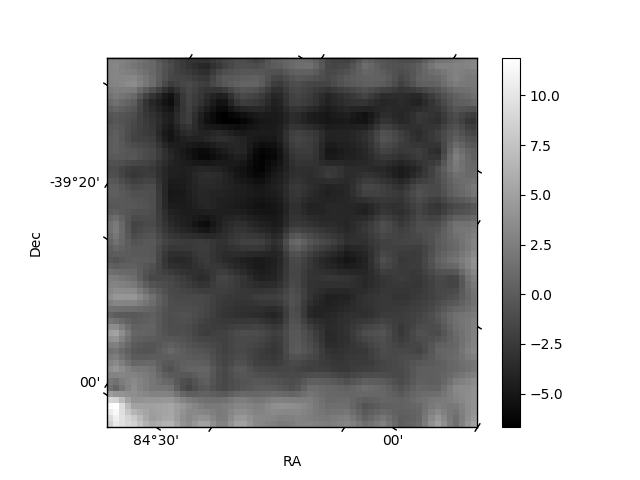
Quadrant B |
|---|---|---|---|
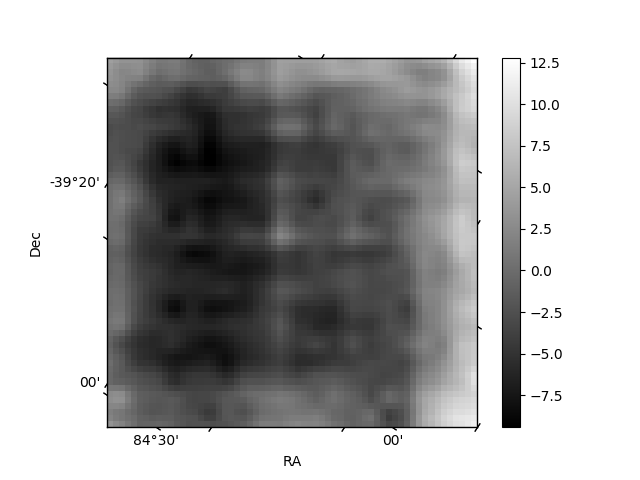
| Quadrant D | 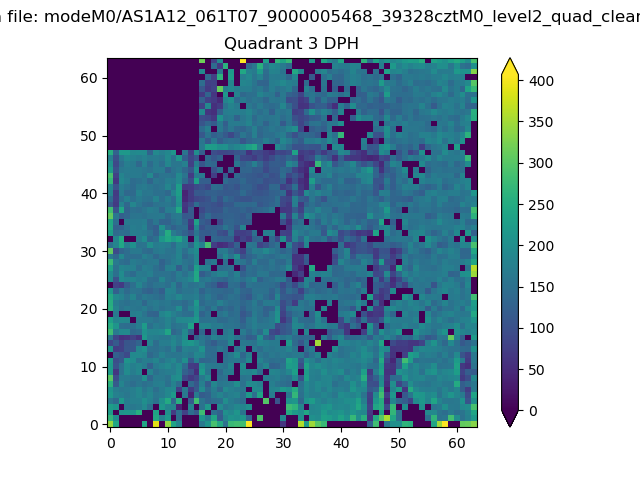 |
 |
Quadrant C |
| Plot type | Count rate plots | Images |
|---|---|---|
| Comparison with Poisson distribution Blue bars denote a histogram of data divided into 1 sec bins. Red curve is a Poisson curve with rate = median count rate of data. |
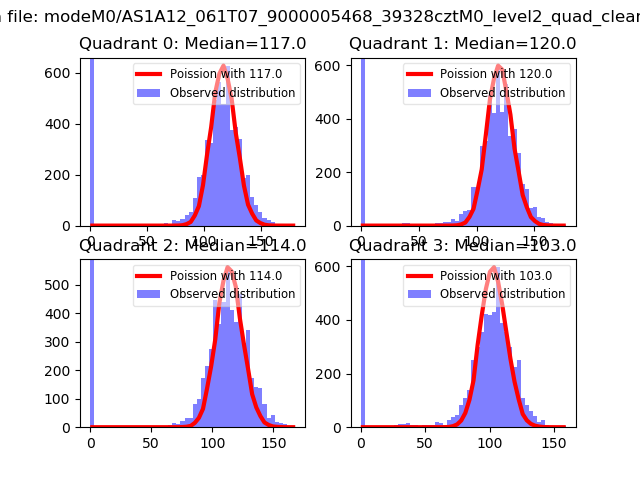 |
 |
| Quadrant-wise count rates Data is divided into 100 sec bins |
 |
|
| Module-wise count rates for Quadrant A Data is divided into 100 sec bins |
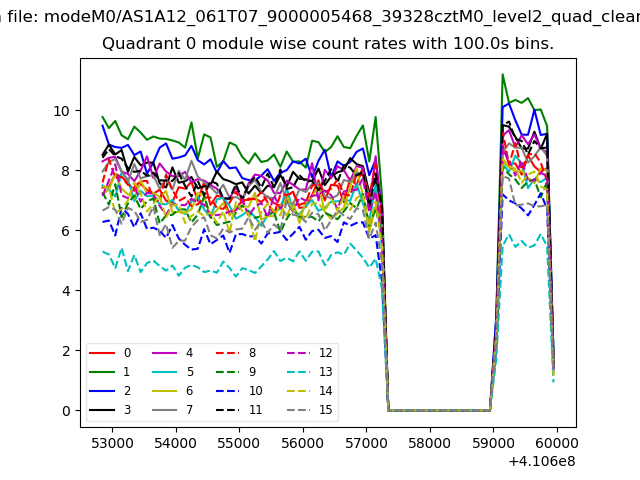 |
 |
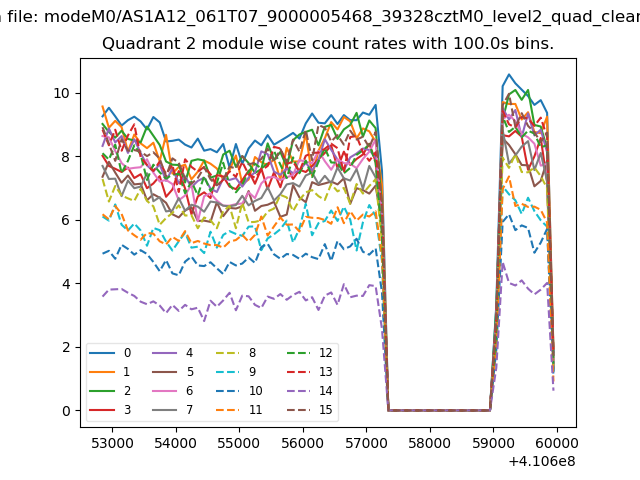
| Module-wise count rates for Quadrant B Data is divided into 100 sec bins |
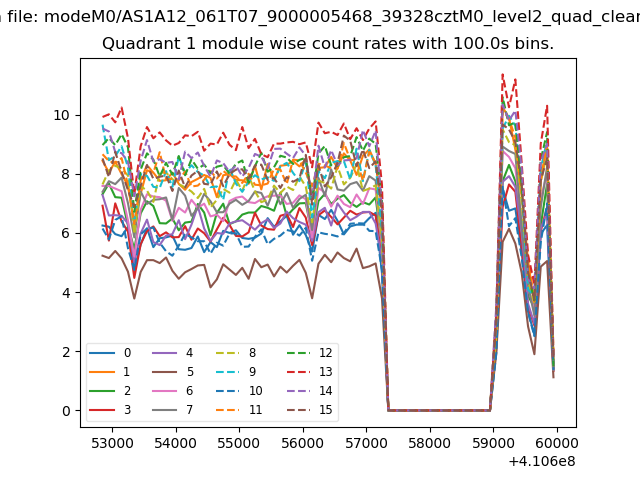 |
 |
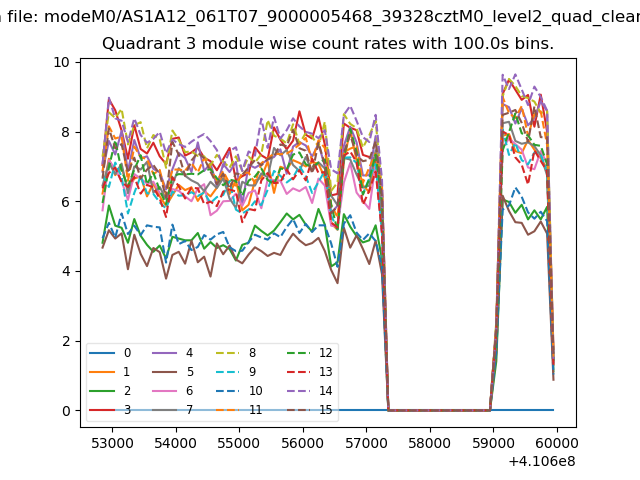
| Module-wise count rates for Quadrant C Data is divided into 100 sec bins |
 |
 |
| Module-wise count rates for Quadrant D Data is divided into 100 sec bins |
 |
 |
| Parameter | Plot |
|---|---|
| CZT HV Monitor | 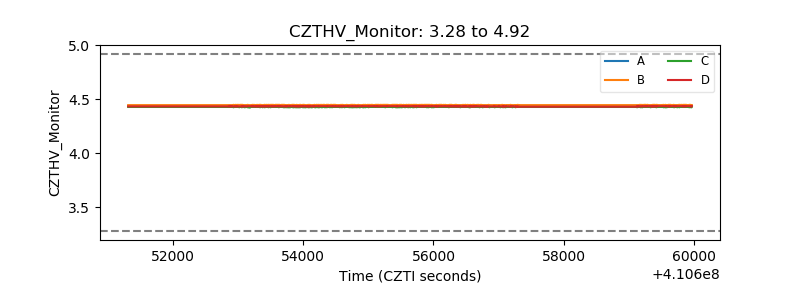 |
| D_VDD | 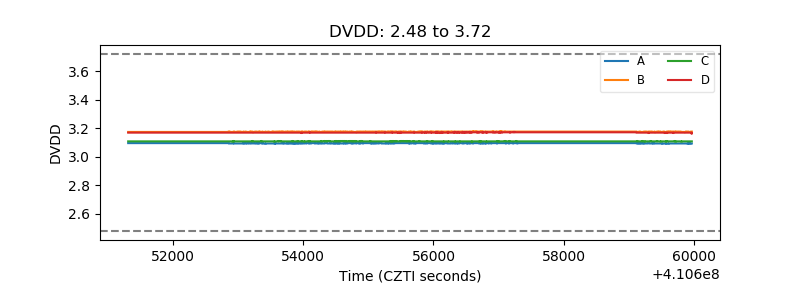 |
| Temperature 1 | 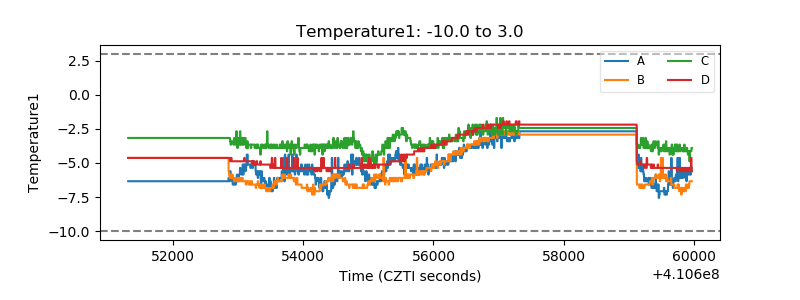 |
| Veto HV Monitor | 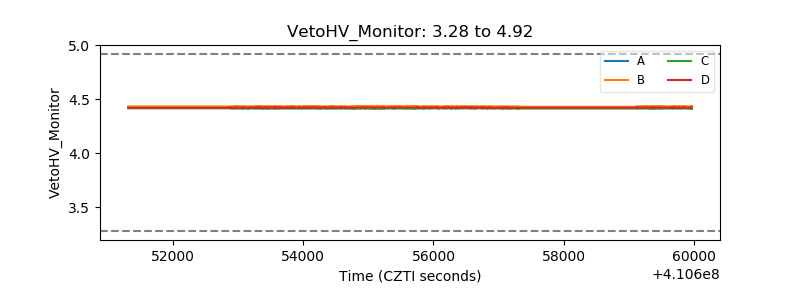 |
| Veto LLD | 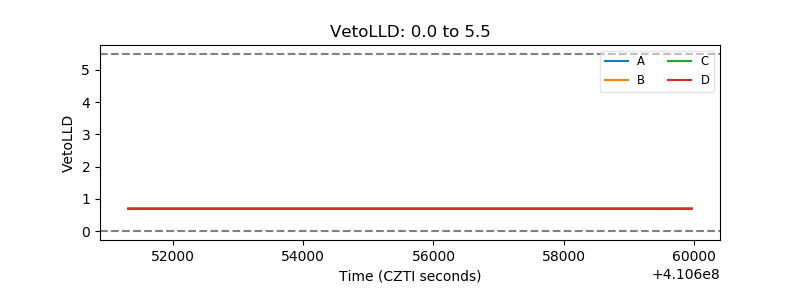 |
| Alpha Counter | 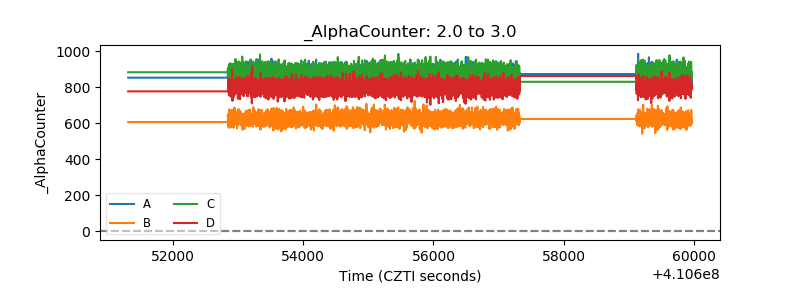 |
| _CPM_Rate | 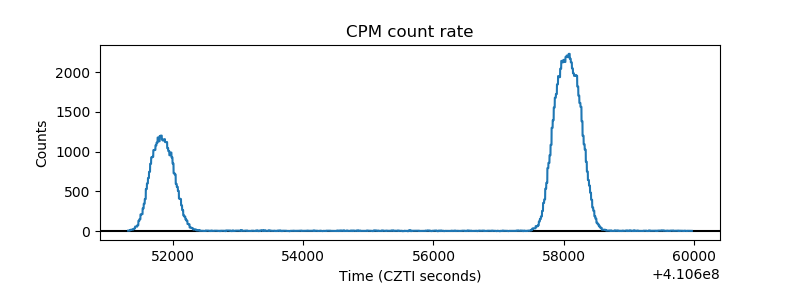 |
| CZT Counter | 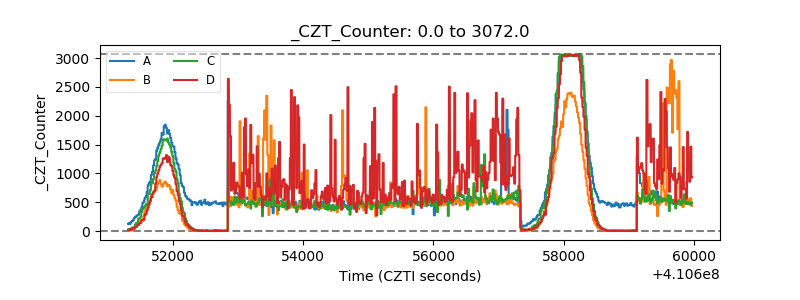 |
| +2.5 Volts monitor | 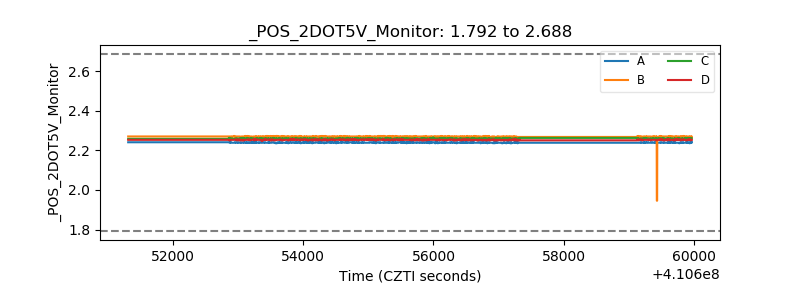 |
| +5 Volts monitor | 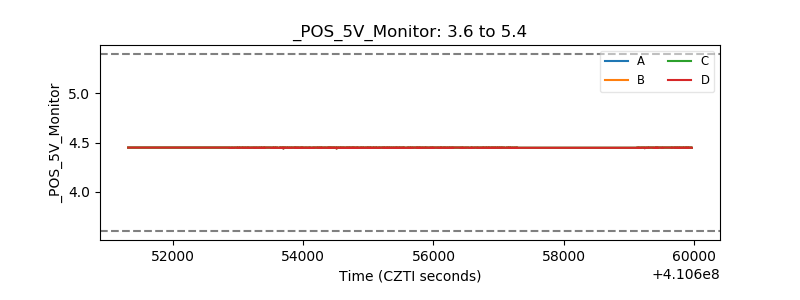 |
| _ROLL_ROT | 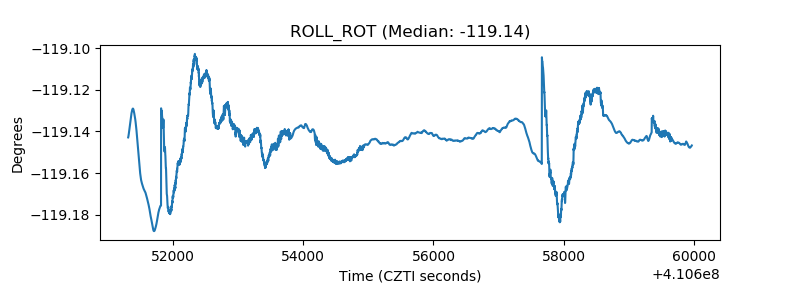 |
| _Roll_DEC | 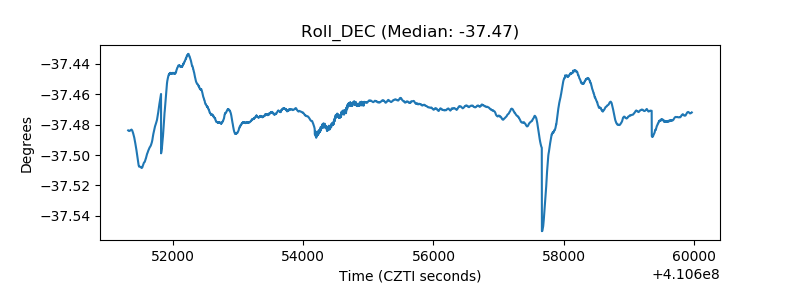 |
| _Roll_RA | 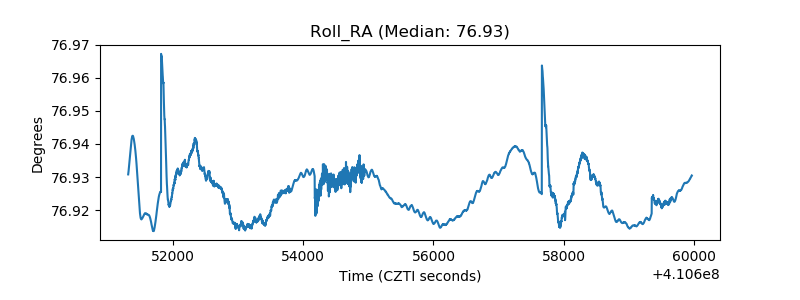 |
| Veto Counter | 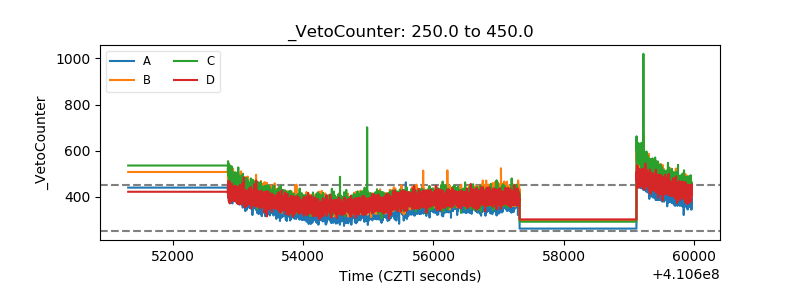 |