| Param | Original file | Final file |
|---|---|---|
| Filename | modeM0/AS1A12_061T07_9000005468_39329cztM0_level2.fits | modeM0/AS1A12_061T07_9000005468_39329cztM0_level2_quad_clean.evt |
| Size (bytes) | 398,623,680 | 96,811,200 |
| Size | 380.2 MB | 92.3 MB |
| Events in quadrant A | 2,913,955 | 668,453 |
| Events in quadrant B | 3,240,408 | 666,508 |
| Events in quadrant C | 3,027,842 | 645,979 |
| Events in quadrant D | 5,162,622 | 580,214 |
| Mode M9 | |||
|---|---|---|---|
| Quadrant | BADHDUFLAG | Total packets | Discarded packets |
| A | 0 | 33 | 0 |
| B | 0 | 33 | 0 |
| C | 0 | 33 | 0 |
| D | 0 | 34 | 0 |
| Mode SS | |||
|---|---|---|---|
| Quadrant | BADHDUFLAG | Total packets | Discarded packets |
| A | 0 | 108 | 0 |
| B | 0 | 108 | 0 |
| C | 0 | 108 | 0 |
| D | 0 | 108 | 0 |
| Mode M0 | |||
|---|---|---|---|
| Quadrant | BADHDUFLAG | Total packets | Discarded packets |
| A | 0 | 11787 | 2 |
| B | 0 | 12902 | 1 |
| C | 0 | 12247 | 1 |
| D | 0 | 19097 | 1 |
| Quadrant | Total seconds | Saturated seconds | Saturation percentage |
|---|---|---|---|
| A | 5290 | 9 | 0.170132% |
| B | 5290 | 196 | 3.705104% |
| C | 5290 | 22 | 0.415879% |
| D | 5290 | 213 | 4.026465% |
Noise dominated data is calculated using 1-second bins in cleaned event files. If a bin has >2000 counts, and if more than 50% of those come from <1% of pixels, then it is considered to be noise-dominated and hence unusable.
| Quadrant | # 1 sec bins | Bins with >0 counts | Bins with >2000 counts | High rate bins dominated by noise | Noise dominated (total time) | Noise dominated (detector-on time) | Marked lightcurve |
|---|---|---|---|---|---|---|---|
| A | 7203 | 5291 | 7 | 7 | 0.10% | 0.13% | 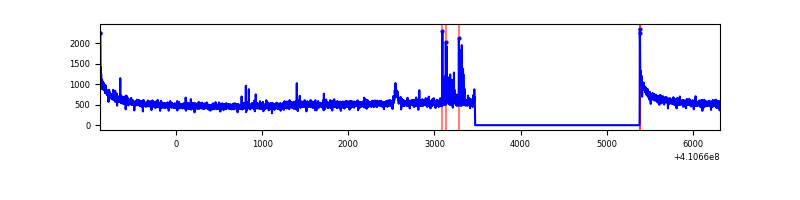 |
| B | 7203 | 5291 | 173 | 173 | 2.40% | 3.27% | 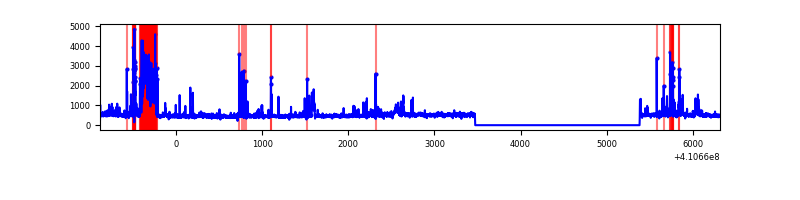 |
| C | 7203 | 5291 | 13 | 13 | 0.18% | 0.25% | 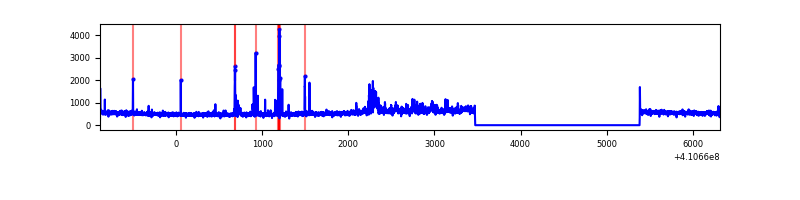 |
| D | 7203 | 5291 | 192 | 192 | 2.67% | 3.63% | 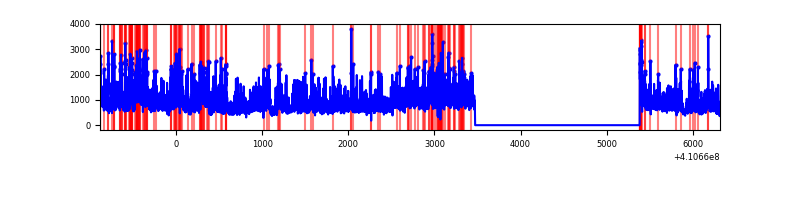 |
Top three noisy pixels from each quadrant. If the there are fewer than three noisy pixels in the level2.evt file, extra rows are filled as -1
| Pixel properties | Quadrant properties | ||||||
|---|---|---|---|---|---|---|---|
| Quadrant | DetID | PixID | Counts | Sigma | Mean | Median | Sigma |
| A | 10 | 83 | 413281 | 3256.09 | 629 | 618 | 126.7 |
| A | 13 | 248 | 55279 | 431.3 | 629 | 618 | 126.7 |
| A | 13 | 254 | 8532 | 62.44 | 629 | 618 | 126.7 |
| B | 5 | 255 | 596708 | 5008.65 | 619 | 602 | 119.0 |
| B | 5 | 172 | 150265 | 1257.51 | 619 | 602 | 119.0 |
| B | 0 | 213 | 44951 | 372.63 | 619 | 602 | 119.0 |
| C | 15 | 214 | 243439 | 1675.22 | 621 | 627 | 144.9 |
| C | 9 | 187 | 243333 | 1674.49 | 621 | 627 | 144.9 |
| C | 14 | 254 | 58169 | 397.0 | 621 | 627 | 144.9 |
| D | 12 | 235 | 2403334 | 16300.55 | 605 | 591 | 147.4 |
| D | 2 | 16 | 148611 | 1004.19 | 605 | 591 | 147.4 |
| D | 13 | 249 | 119690 | 807.98 | 605 | 591 | 147.4 |
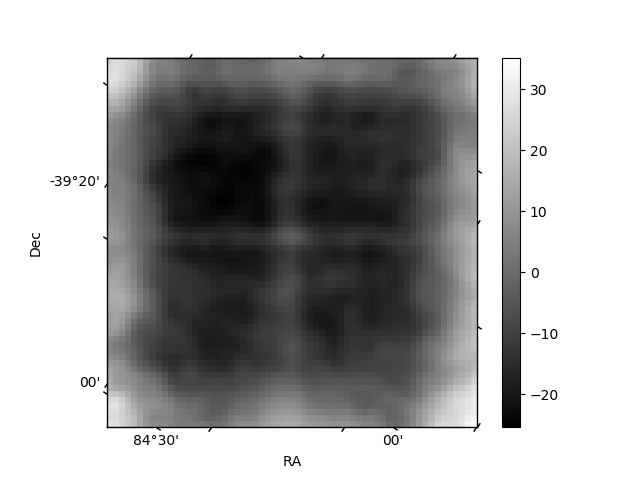
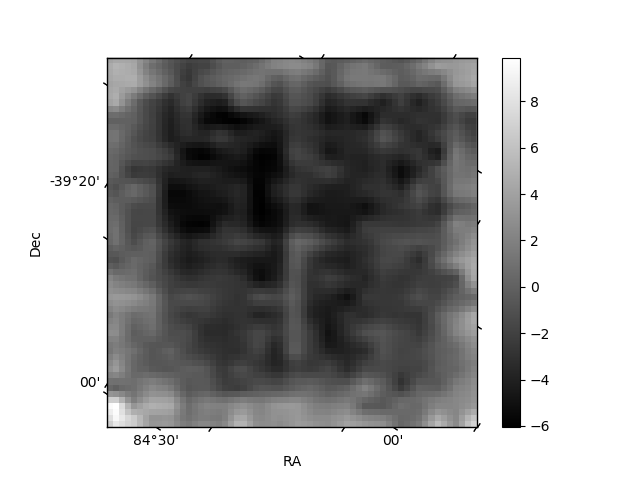
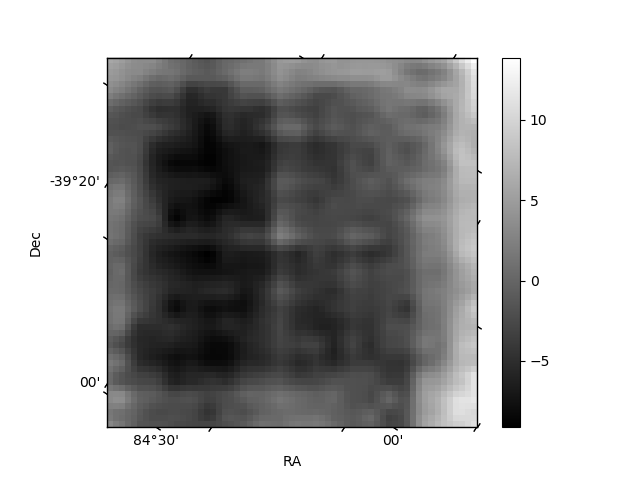
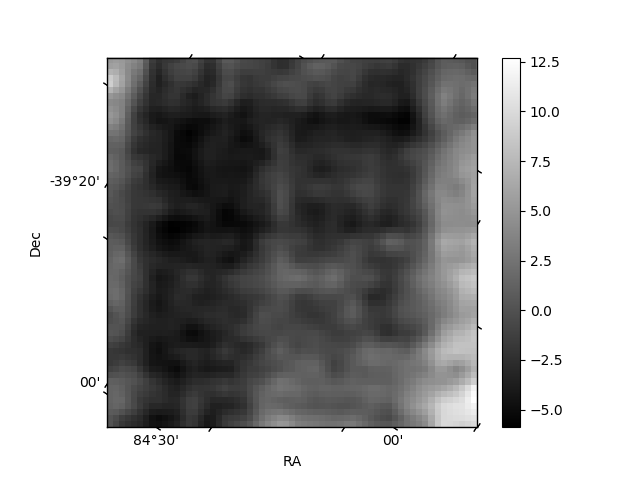
Histogram calculated using DETX and DETY for each event in the final _common_clean file
| Quadrant A | 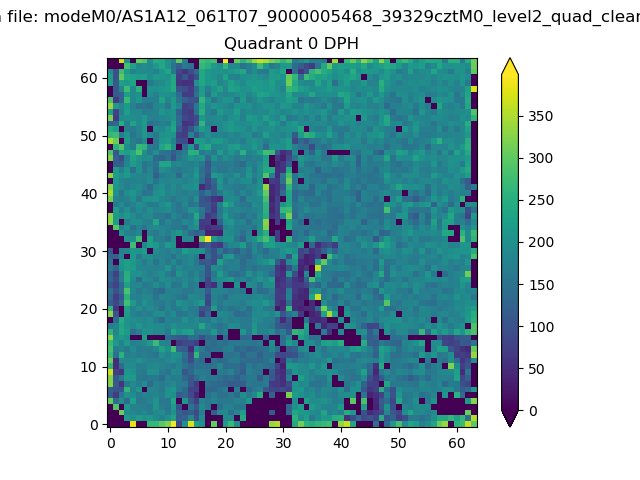 |
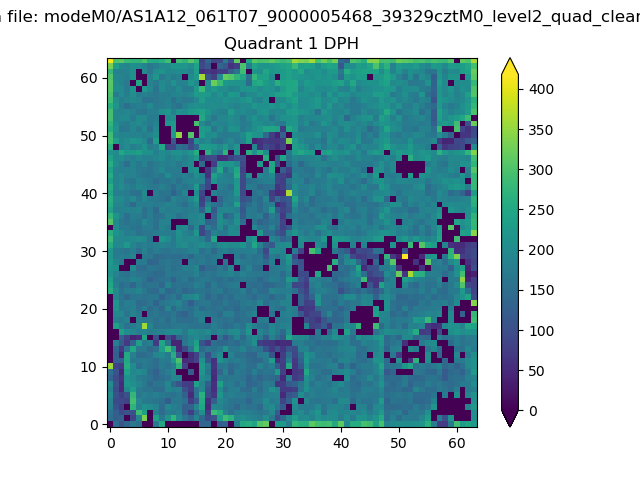 |
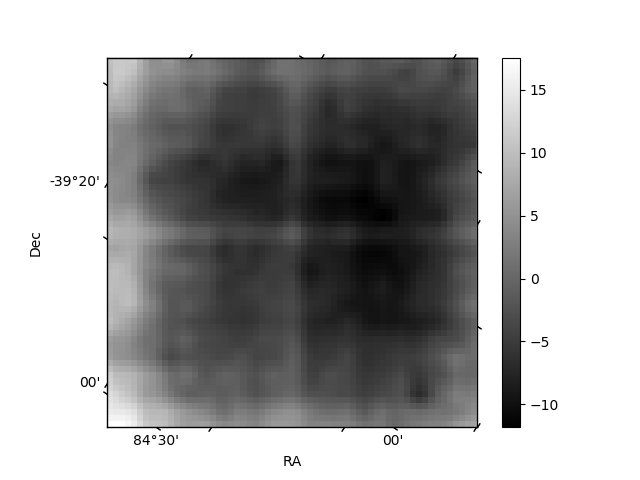
Quadrant B |
|---|---|---|---|
| Quadrant D | 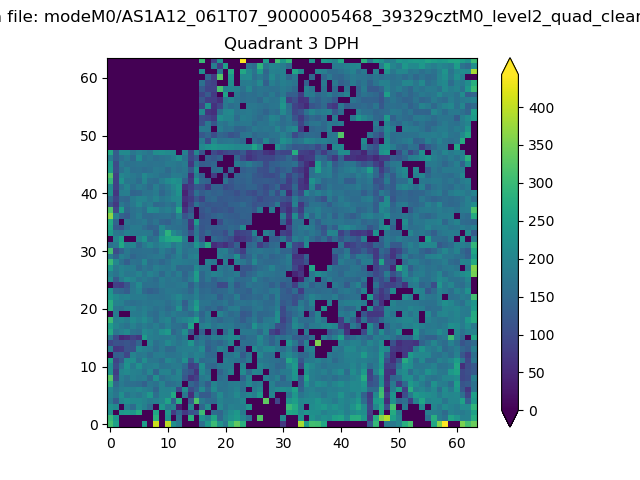 |
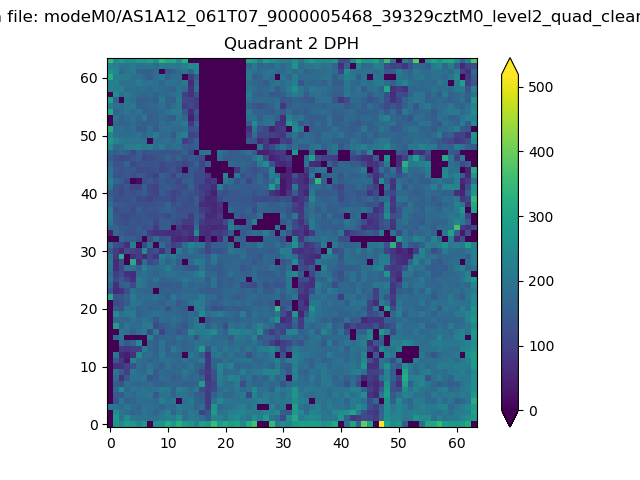 |
Quadrant C |
| Plot type | Count rate plots | Images |
|---|---|---|
| Comparison with Poisson distribution Blue bars denote a histogram of data divided into 1 sec bins. Red curve is a Poisson curve with rate = median count rate of data. |
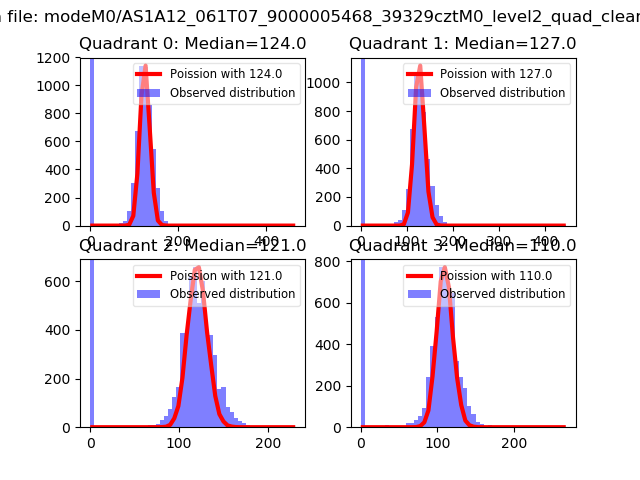 |
 |
| Quadrant-wise count rates Data is divided into 100 sec bins |
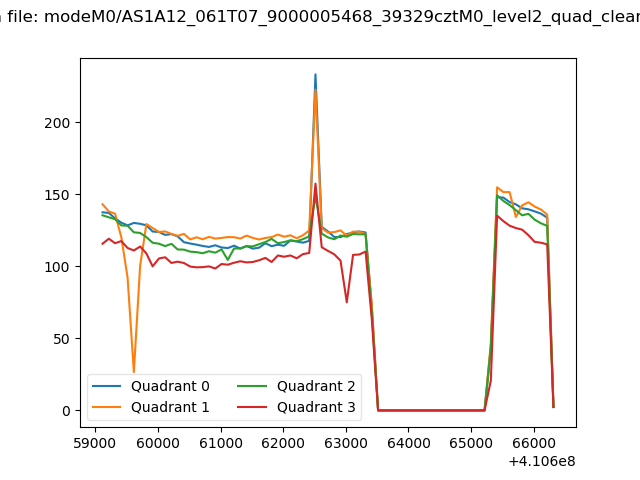 |
|
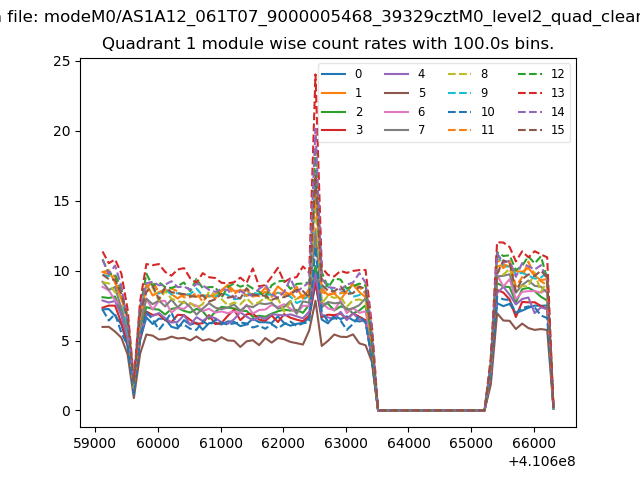
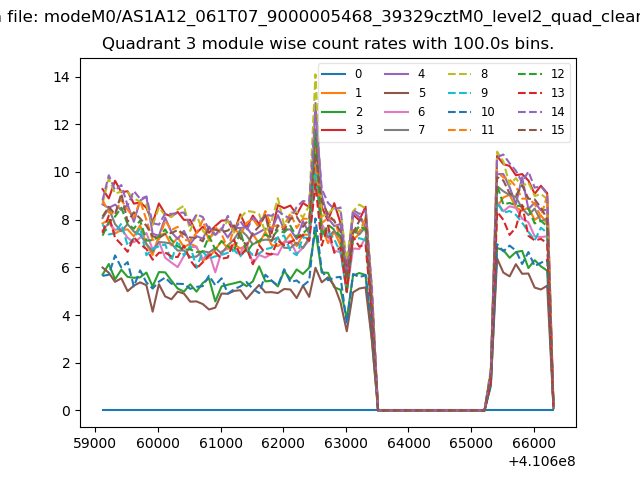
| Module-wise count rates for Quadrant A Data is divided into 100 sec bins |
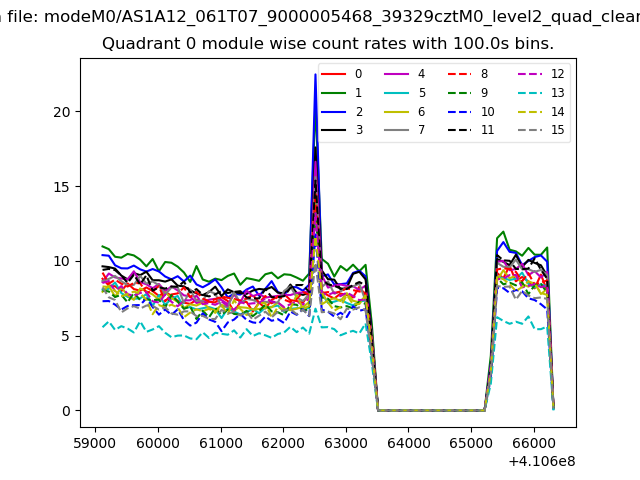 |
 |
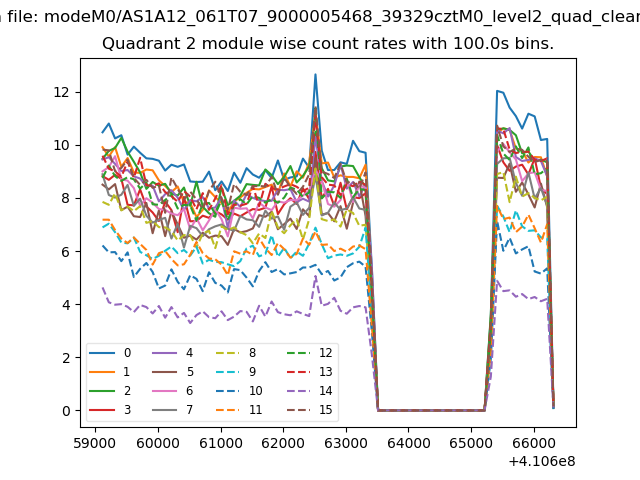
| Module-wise count rates for Quadrant B Data is divided into 100 sec bins |
 |
 |
| Module-wise count rates for Quadrant C Data is divided into 100 sec bins |
 |
 |
| Module-wise count rates for Quadrant D Data is divided into 100 sec bins |
 |
 |
| Parameter | Plot |
|---|---|
| CZT HV Monitor | 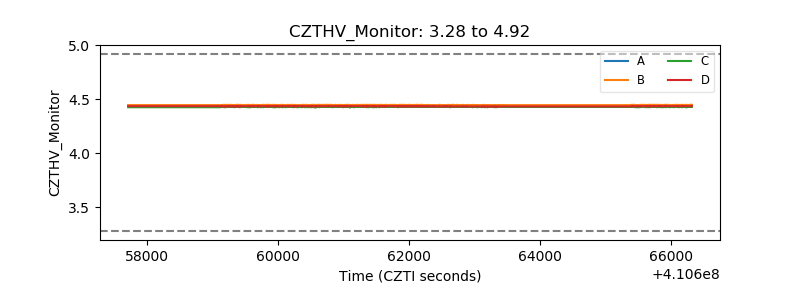 |
| D_VDD | 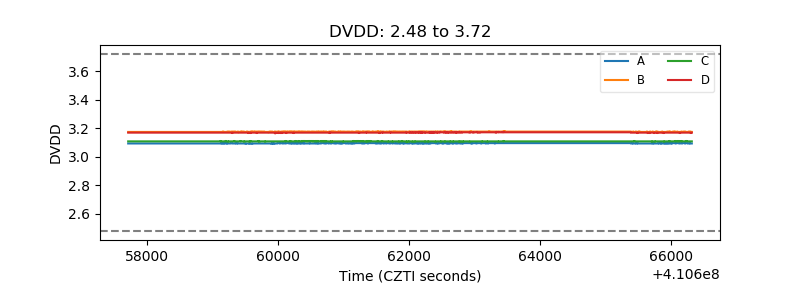 |
| Temperature 1 | 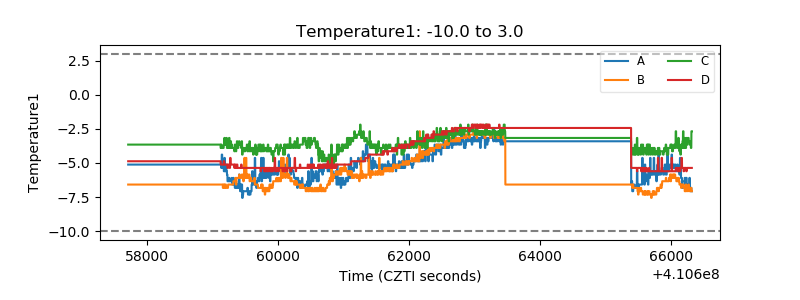 |
| Veto HV Monitor | 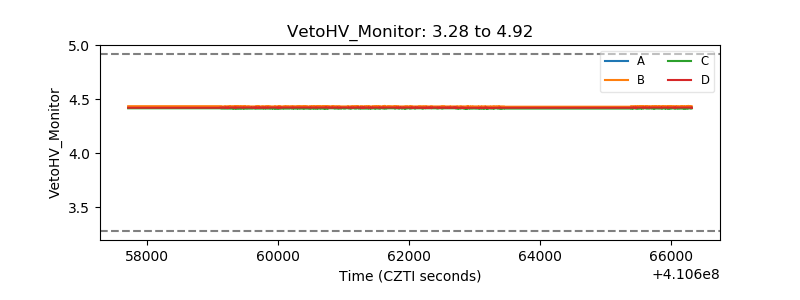 |
| Veto LLD | 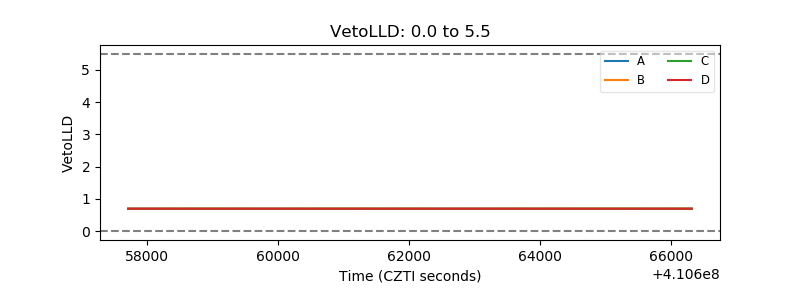 |
| Alpha Counter |  |
| _CPM_Rate | 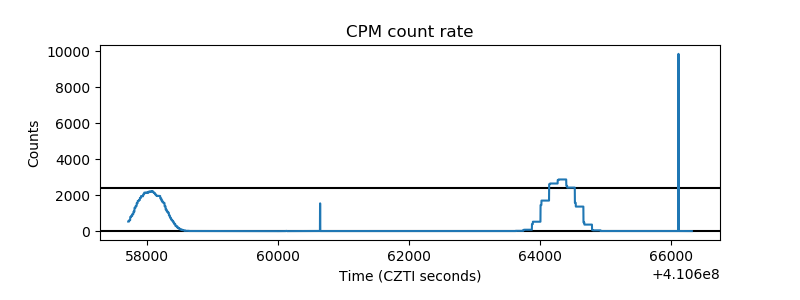 |
| CZT Counter | 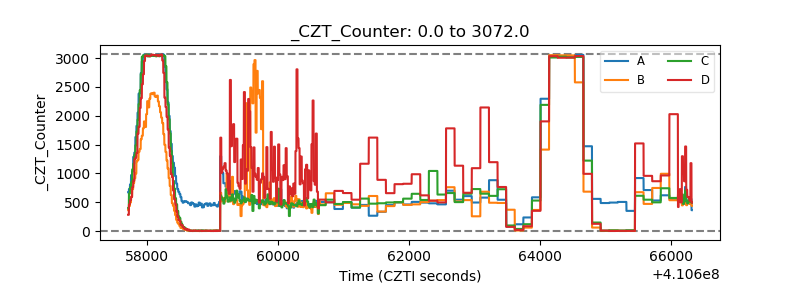 |
| +2.5 Volts monitor | 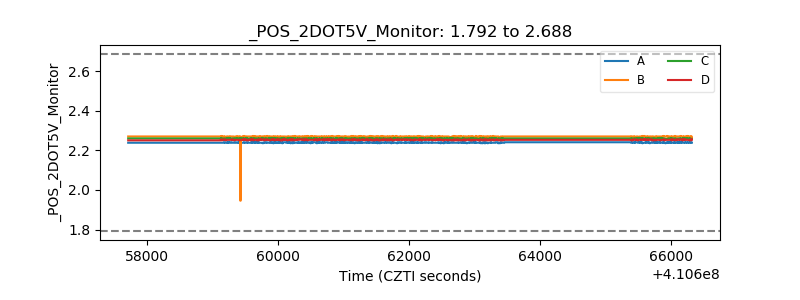 |
| +5 Volts monitor | 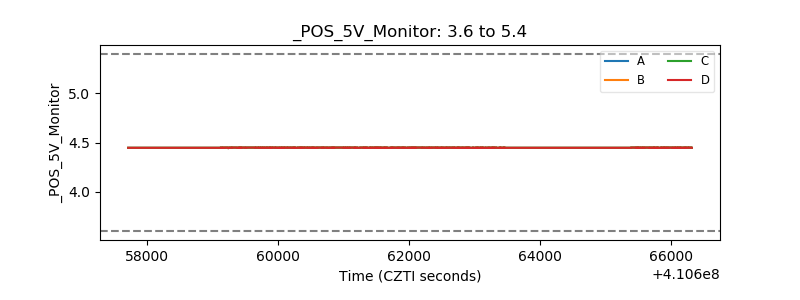 |
| _ROLL_ROT | 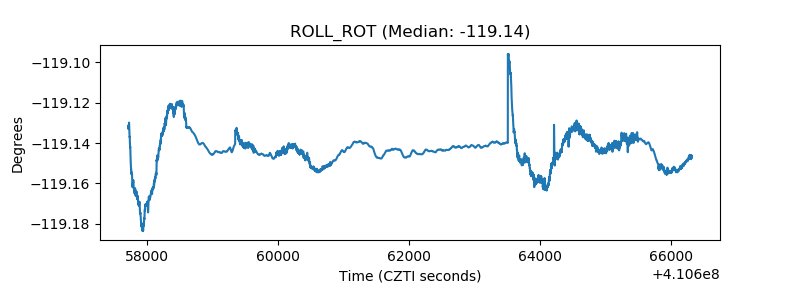 |
| _Roll_DEC | 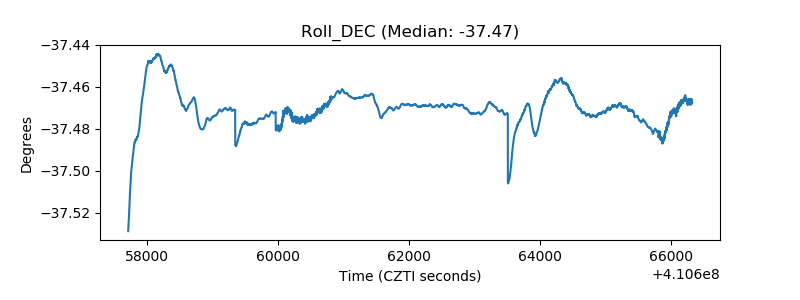 |
| _Roll_RA | 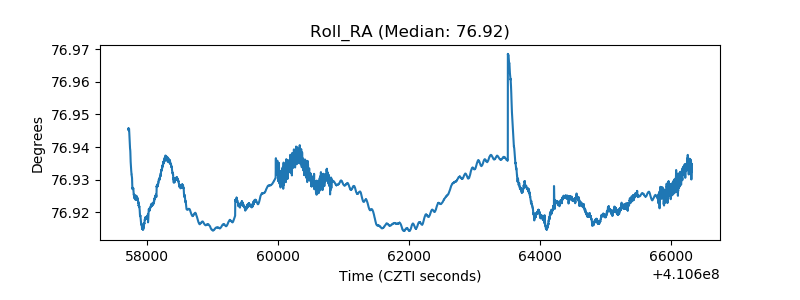 |
| Veto Counter | 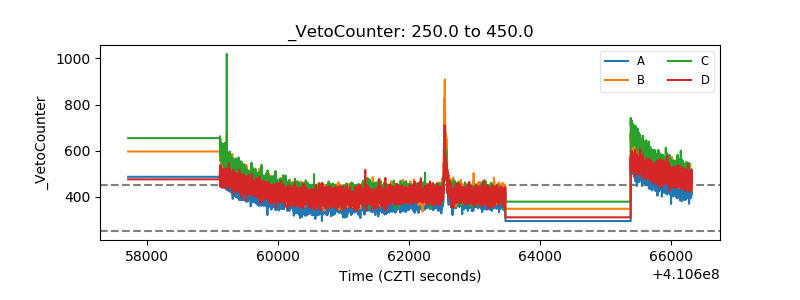 |