| Param | Original file | Final file |
|---|---|---|
| Filename | modeM0/AS1A12_061T07_9000005468_39330cztM0_level2.fits | modeM0/AS1A12_061T07_9000005468_39330cztM0_level2_quad_clean.evt |
| Size (bytes) | 389,234,880 | 97,968,960 |
| Size | 371.2 MB | 93.4 MB |
| Events in quadrant A | 2,952,894 | 665,847 |
| Events in quadrant B | 3,156,322 | 689,575 |
| Events in quadrant C | 2,849,950 | 665,720 |
| Events in quadrant D | 5,049,320 | 584,824 |
| Mode M9 | |||
|---|---|---|---|
| Quadrant | BADHDUFLAG | Total packets | Discarded packets |
| A | 0 | 34 | 0 |
| B | 0 | 34 | 0 |
| C | 0 | 34 | 0 |
| D | 0 | 35 | 0 |
| Mode SS | |||
|---|---|---|---|
| Quadrant | BADHDUFLAG | Total packets | Discarded packets |
| A | 0 | 106 | 0 |
| B | 0 | 106 | 0 |
| C | 0 | 106 | 0 |
| D | 0 | 106 | 0 |
| Mode M0 | |||
|---|---|---|---|
| Quadrant | BADHDUFLAG | Total packets | Discarded packets |
| A | 0 | 11769 | 3 |
| B | 0 | 12451 | 2 |
| C | 0 | 11296 | 2 |
| D | 0 | 18740 | 2 |
| Quadrant | Total seconds | Saturated seconds | Saturation percentage |
|---|---|---|---|
| A | 5145 | 37 | 0.719145% |
| B | 5145 | 99 | 1.924198% |
| C | 5145 | 5 | 0.097182% |
| D | 5145 | 232 | 4.509232% |
Noise dominated data is calculated using 1-second bins in cleaned event files. If a bin has >2000 counts, and if more than 50% of those come from <1% of pixels, then it is considered to be noise-dominated and hence unusable.
| Quadrant | # 1 sec bins | Bins with >0 counts | Bins with >2000 counts | High rate bins dominated by noise | Noise dominated (total time) | Noise dominated (detector-on time) | Marked lightcurve |
|---|---|---|---|---|---|---|---|
| A | 7177 | 5146 | 17 | 17 | 0.24% | 0.33% | 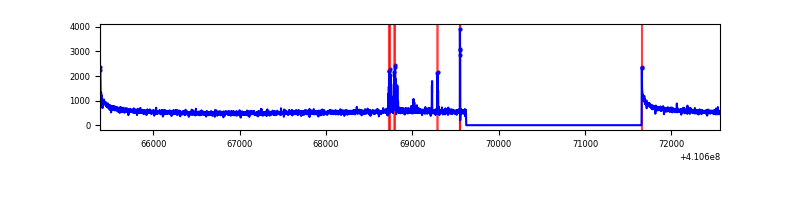 |
| B | 7177 | 5146 | 47 | 47 | 0.65% | 0.91% | 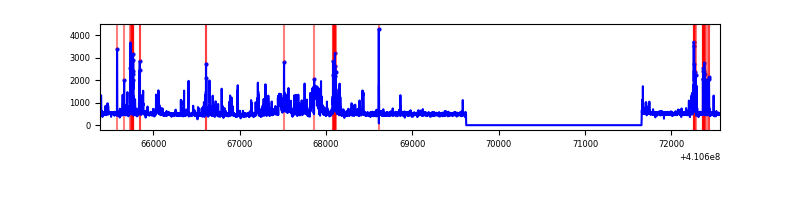 |
| C | 7177 | 5146 | 0 | 0 | 0.00% | 0.00% | 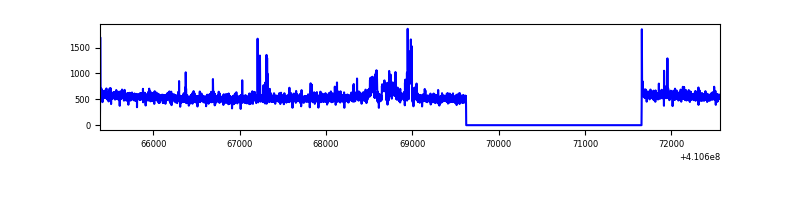 |
| D | 7177 | 5146 | 203 | 203 | 2.83% | 3.94% | 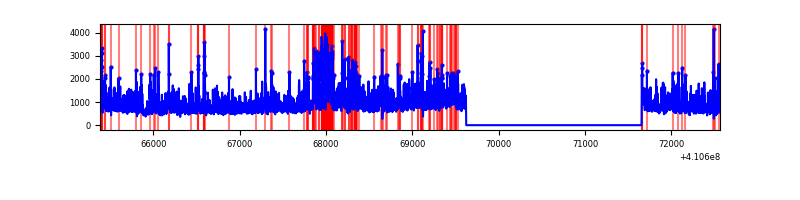 |
Top three noisy pixels from each quadrant. If the there are fewer than three noisy pixels in the level2.evt file, extra rows are filled as -1
| Pixel properties | Quadrant properties | ||||||
|---|---|---|---|---|---|---|---|
| Quadrant | DetID | PixID | Counts | Sigma | Mean | Median | Sigma |
| A | 10 | 83 | 414427 | 3290.52 | 626 | 614 | 125.8 |
| A | 13 | 248 | 78719 | 621.07 | 626 | 614 | 125.8 |
| A | 15 | 223 | 21263 | 164.19 | 626 | 614 | 125.8 |
| B | 5 | 172 | 539658 | 4538.88 | 628 | 613 | 118.8 |
| B | 5 | 255 | 125765 | 1053.81 | 628 | 613 | 118.8 |
| B | 5 | 184 | 16581 | 134.45 | 628 | 613 | 118.8 |
| C | 15 | 214 | 236274 | 1617.11 | 630 | 636 | 145.7 |
| C | 9 | 187 | 111943 | 763.86 | 630 | 636 | 145.7 |
| C | 14 | 254 | 19031 | 126.24 | 630 | 636 | 145.7 |
| D | 12 | 235 | 2196761 | 14896.8 | 610 | 595 | 147.4 |
| D | 2 | 249 | 228190 | 1543.8 | 610 | 595 | 147.4 |
| D | 2 | 16 | 142838 | 964.85 | 610 | 595 | 147.4 |
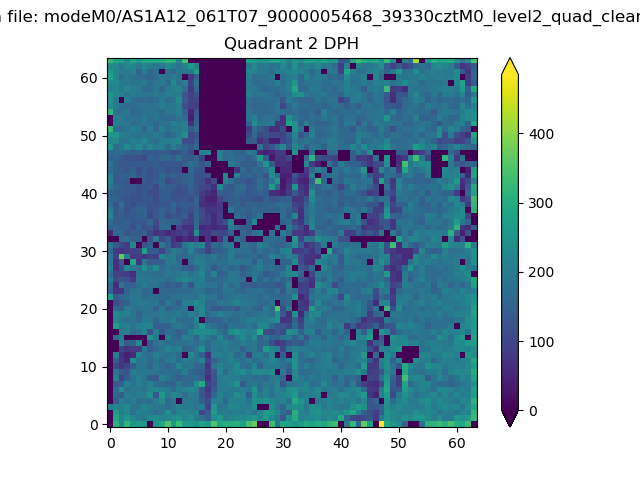
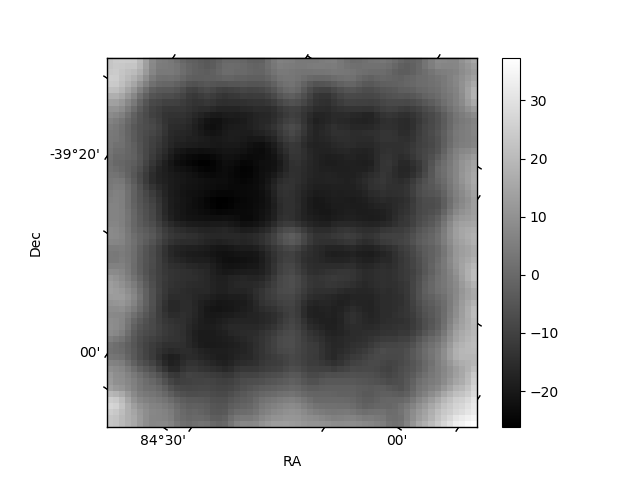
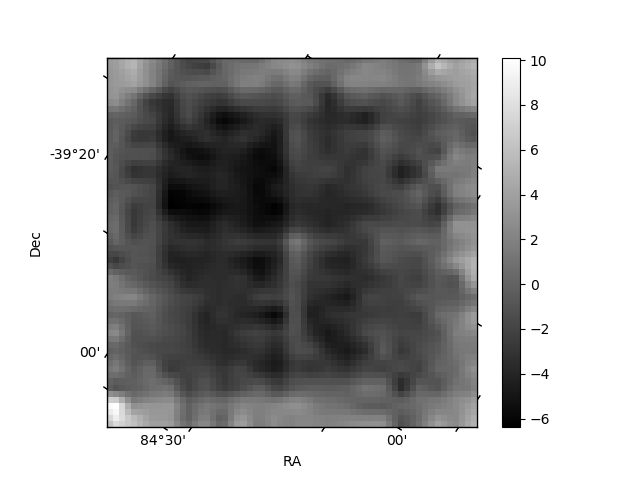
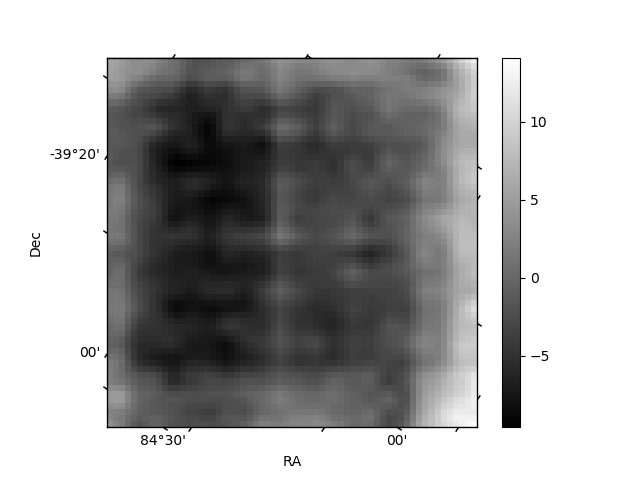
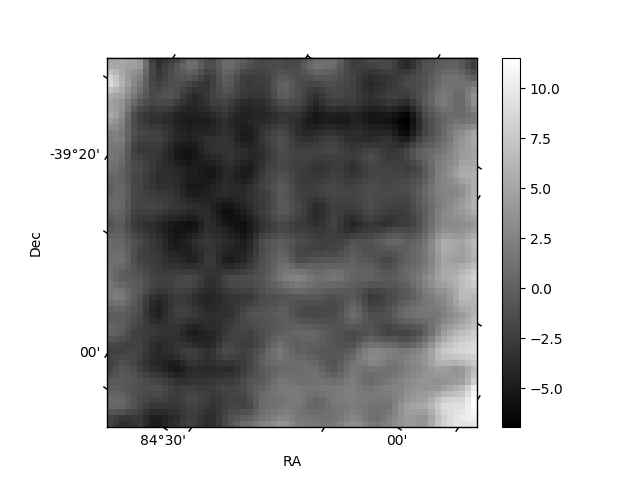
Histogram calculated using DETX and DETY for each event in the final _common_clean file
| Quadrant A | 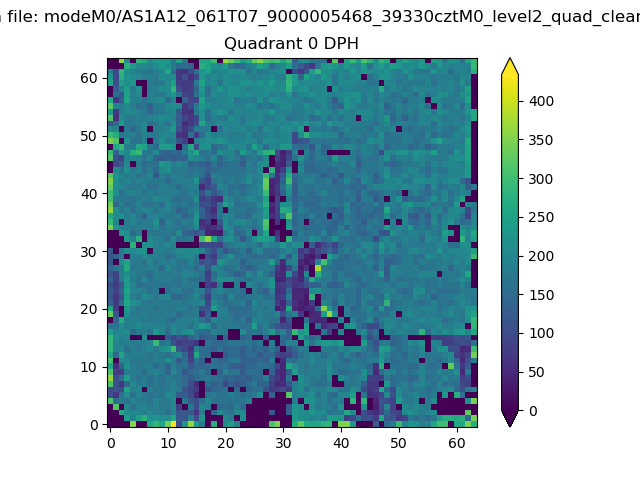 |
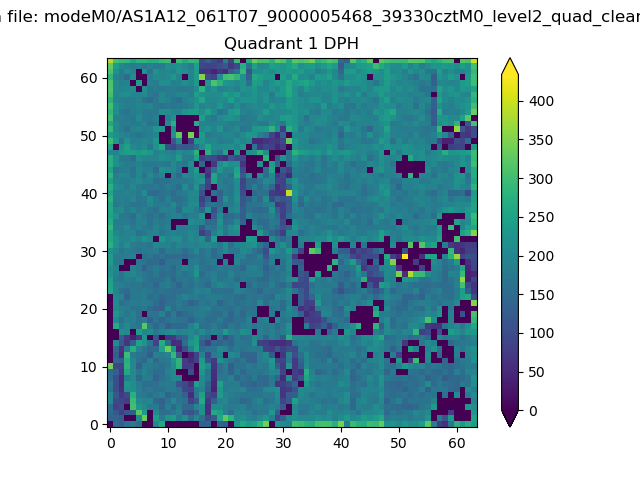 |
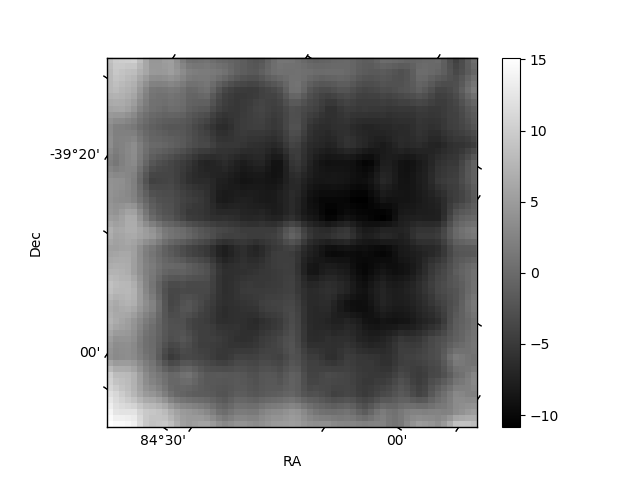
Quadrant B |
|---|---|---|---|
| Quadrant D | 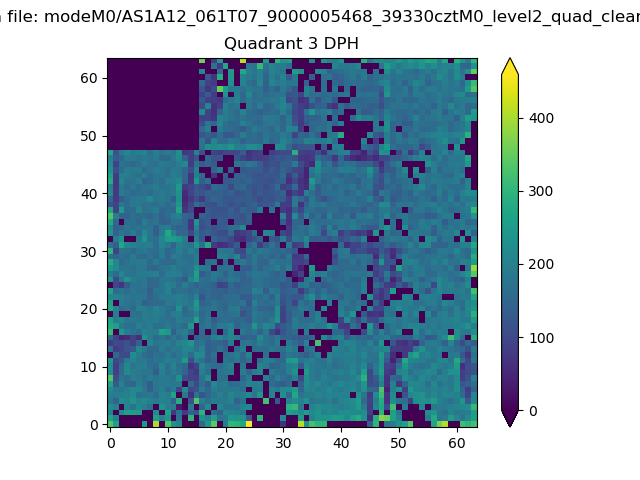 |
 |
Quadrant C |
| Plot type | Count rate plots | Images |
|---|---|---|
| Comparison with Poisson distribution Blue bars denote a histogram of data divided into 1 sec bins. Red curve is a Poisson curve with rate = median count rate of data. |
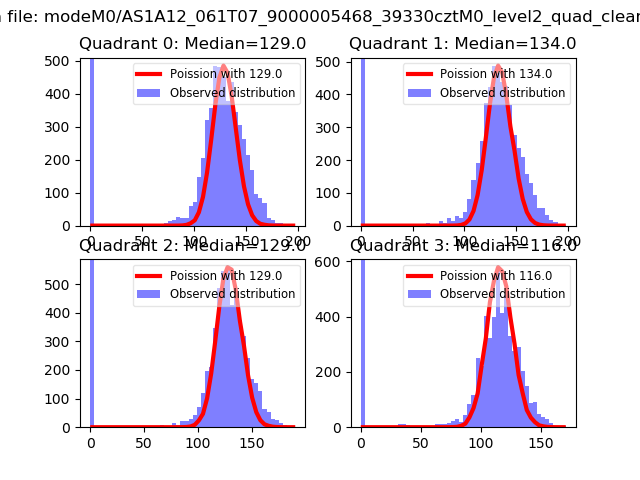 |
 |
| Quadrant-wise count rates Data is divided into 100 sec bins |
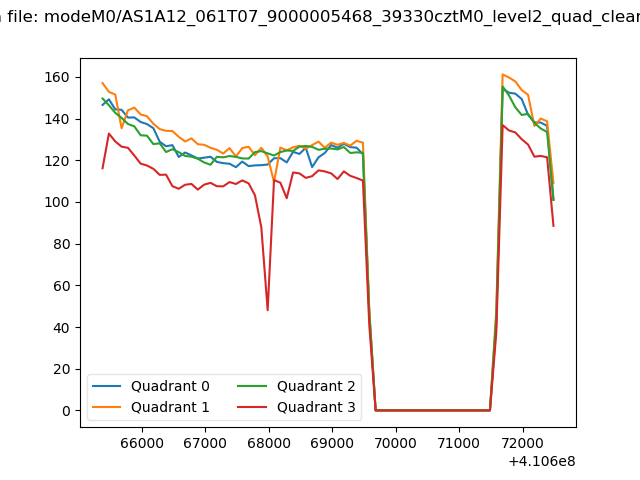 |
|
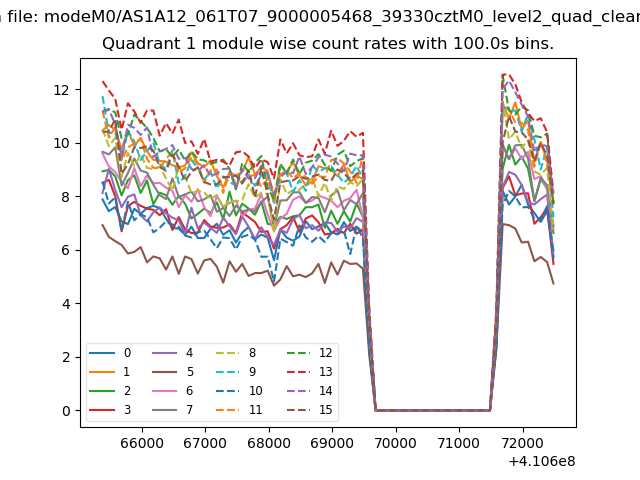
| Module-wise count rates for Quadrant A Data is divided into 100 sec bins |
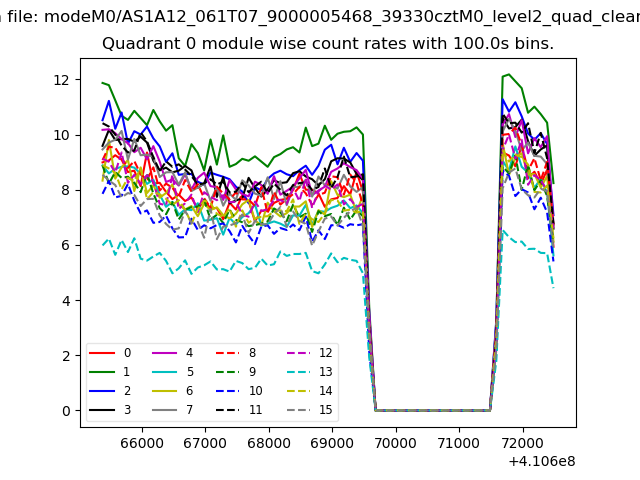 |
 |
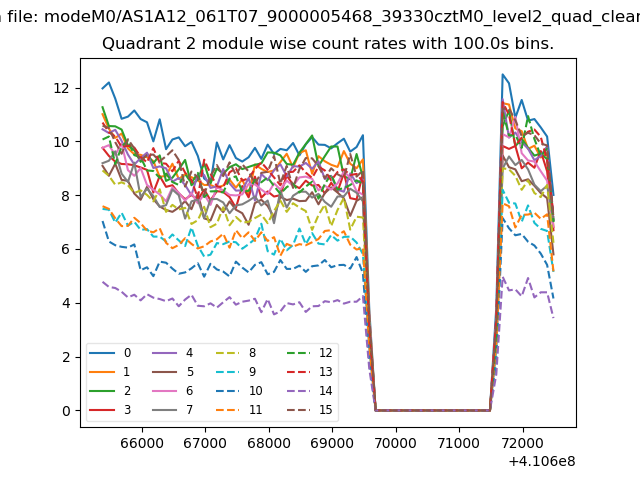
| Module-wise count rates for Quadrant B Data is divided into 100 sec bins |
 |
 |
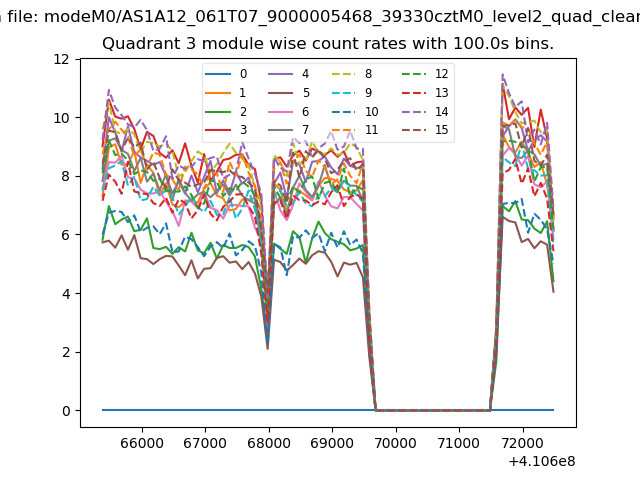
| Module-wise count rates for Quadrant C Data is divided into 100 sec bins |
 |
 |
| Module-wise count rates for Quadrant D Data is divided into 100 sec bins |
 |
 |
| Parameter | Plot |
|---|---|
| CZT HV Monitor | 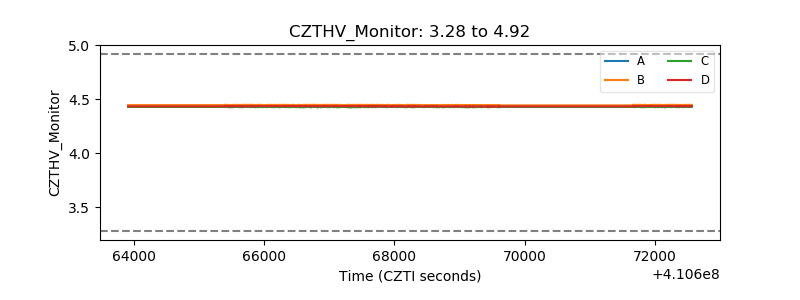 |
| D_VDD | 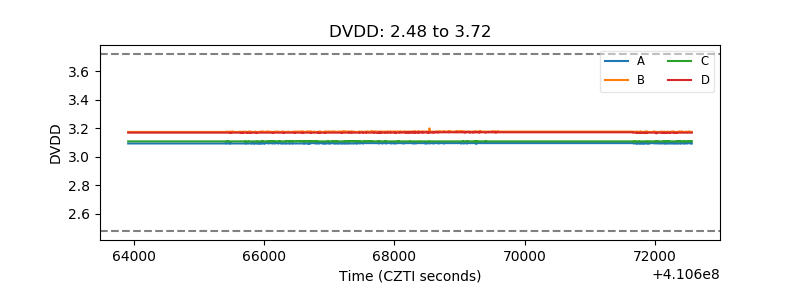 |
| Temperature 1 | 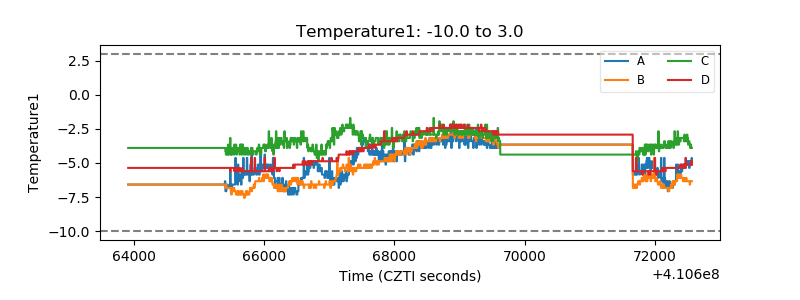 |
| Veto HV Monitor | 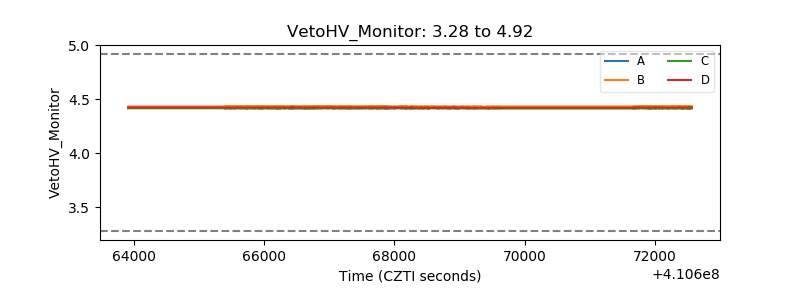 |
| Veto LLD | 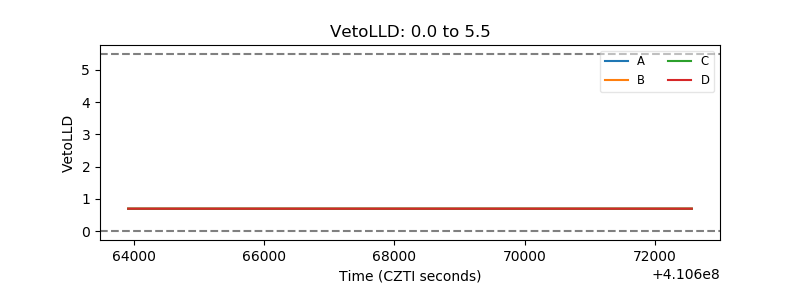 |
| Alpha Counter |  |
| _CPM_Rate | 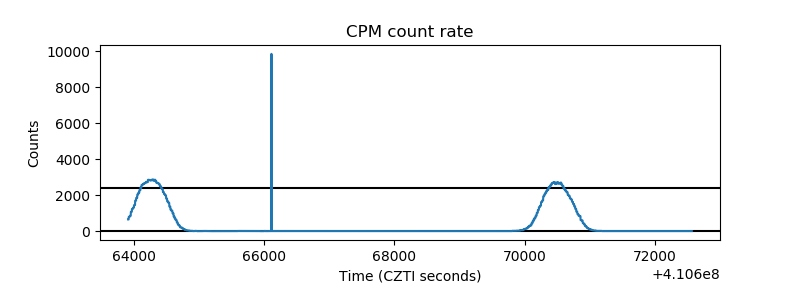 |
| CZT Counter | 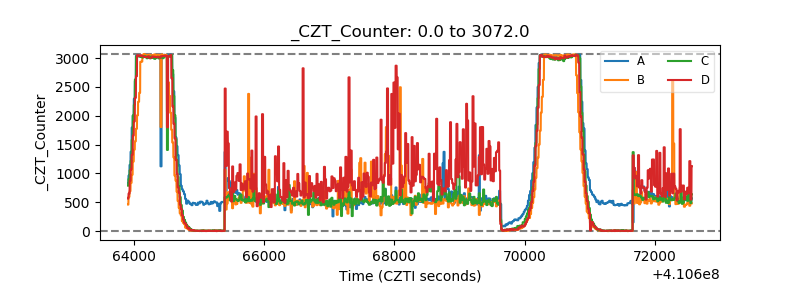 |
| +2.5 Volts monitor | 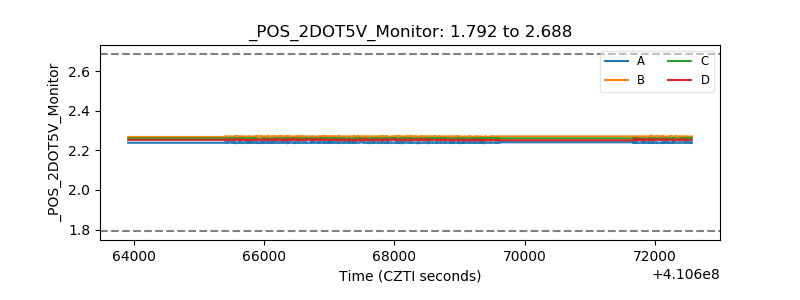 |
| +5 Volts monitor | 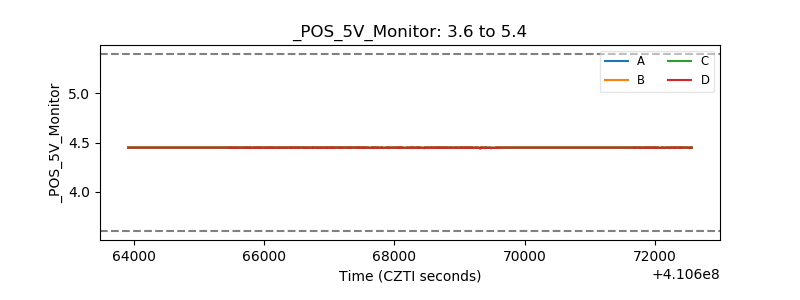 |
| _ROLL_ROT | 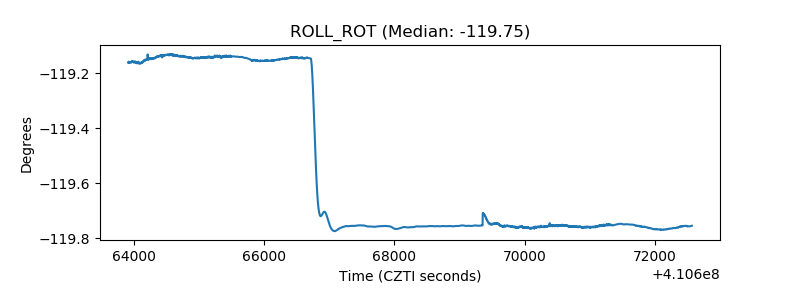 |
| _Roll_DEC | 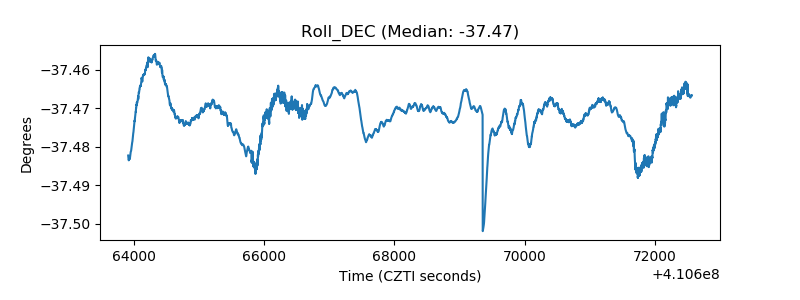 |
| _Roll_RA | 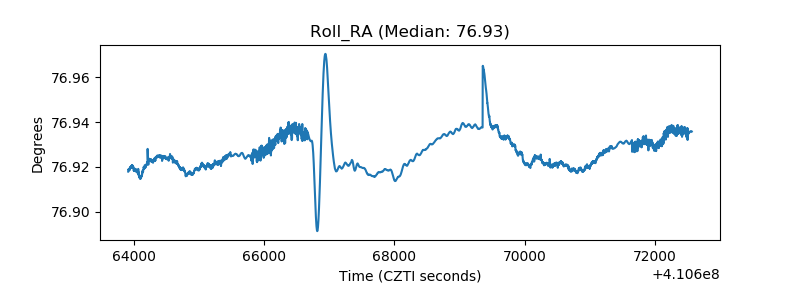 |
| Veto Counter | 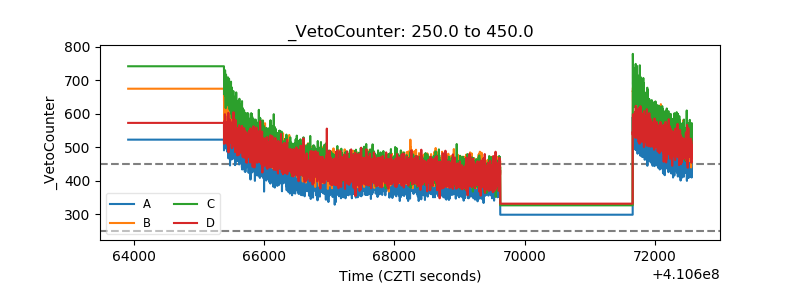 |