| Param | Original file | Final file |
|---|---|---|
| Filename | modeM0/AS1A12_061T07_9000005468_39331cztM0_level2.fits | modeM0/AS1A12_061T07_9000005468_39331cztM0_level2_quad_clean.evt |
| Size (bytes) | 381,389,760 | 95,633,280 |
| Size | 363.7 MB | 91.2 MB |
| Events in quadrant A | 3,212,252 | 648,719 |
| Events in quadrant B | 3,163,842 | 662,255 |
| Events in quadrant C | 2,822,574 | 649,611 |
| Events in quadrant D | 4,532,665 | 586,918 |
| Mode M9 | |||
|---|---|---|---|
| Quadrant | BADHDUFLAG | Total packets | Discarded packets |
| A | 0 | 34 | 0 |
| B | 0 | 34 | 0 |
| C | 0 | 34 | 0 |
| D | 0 | 35 | 0 |
| Mode SS | |||
|---|---|---|---|
| Quadrant | BADHDUFLAG | Total packets | Discarded packets |
| A | 0 | 100 | 0 |
| B | 0 | 100 | 0 |
| C | 0 | 100 | 0 |
| D | 0 | 100 | 0 |
| Mode M0 | |||
|---|---|---|---|
| Quadrant | BADHDUFLAG | Total packets | Discarded packets |
| A | 0 | 12520 | 3 |
| B | 0 | 12294 | 2 |
| C | 0 | 11171 | 2 |
| D | 0 | 17063 | 2 |
| Quadrant | Total seconds | Saturated seconds | Saturation percentage |
|---|---|---|---|
| A | 4975 | 77 | 1.547739% |
| B | 4975 | 233 | 4.683417% |
| C | 4975 | 28 | 0.562814% |
| D | 4975 | 105 | 2.110553% |
Noise dominated data is calculated using 1-second bins in cleaned event files. If a bin has >2000 counts, and if more than 50% of those come from <1% of pixels, then it is considered to be noise-dominated and hence unusable.
| Quadrant | # 1 sec bins | Bins with >0 counts | Bins with >2000 counts | High rate bins dominated by noise | Noise dominated (total time) | Noise dominated (detector-on time) | Marked lightcurve |
|---|---|---|---|---|---|---|---|
| A | 7098 | 4976 | 52 | 52 | 0.73% | 1.05% | 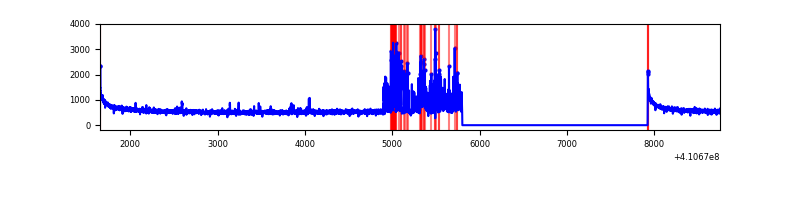 |
| B | 7098 | 4976 | 163 | 163 | 2.30% | 3.28% | 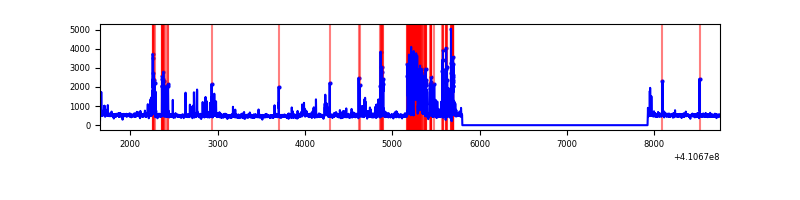 |
| C | 7098 | 4976 | 10 | 10 | 0.14% | 0.20% | 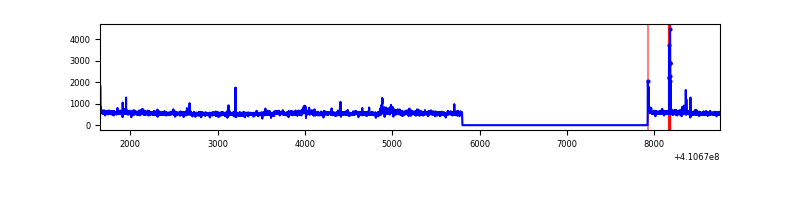 |
| D | 7098 | 4976 | 118 | 118 | 1.66% | 2.37% |  |
Top three noisy pixels from each quadrant. If the there are fewer than three noisy pixels in the level2.evt file, extra rows are filled as -1
| Pixel properties | Quadrant properties | ||||||
|---|---|---|---|---|---|---|---|
| Quadrant | DetID | PixID | Counts | Sigma | Mean | Median | Sigma |
| A | 13 | 248 | 426004 | 3491.66 | 611 | 600 | 121.8 |
| A | 10 | 83 | 402439 | 3298.24 | 611 | 600 | 121.8 |
| A | 15 | 223 | 15614 | 123.23 | 611 | 600 | 121.8 |
| B | 5 | 255 | 596554 | 5217.05 | 606 | 591 | 114.2 |
| B | 5 | 172 | 182166 | 1589.5 | 606 | 591 | 114.2 |
| B | 12 | 111 | 14264 | 119.69 | 606 | 591 | 114.2 |
| C | 15 | 214 | 230100 | 1625.58 | 612 | 618 | 141.2 |
| C | 9 | 187 | 101844 | 717.05 | 612 | 618 | 141.2 |
| C | 14 | 254 | 74006 | 519.86 | 612 | 618 | 141.2 |
| D | 12 | 235 | 1914379 | 13224.37 | 601 | 585 | 144.7 |
| D | 2 | 16 | 138377 | 952.15 | 601 | 585 | 144.7 |
| D | 13 | 249 | 67810 | 464.53 | 601 | 585 | 144.7 |
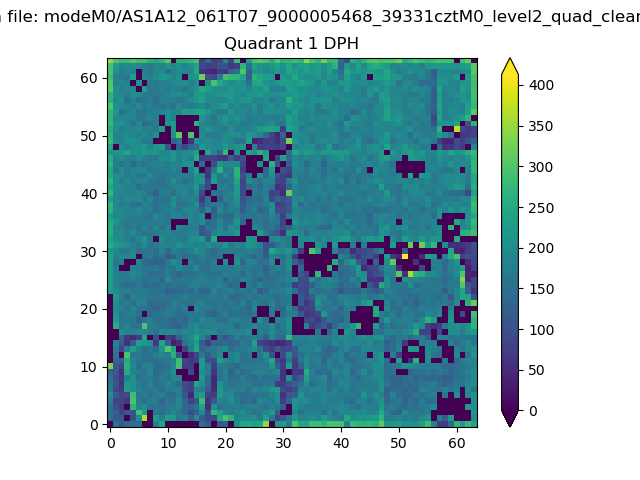
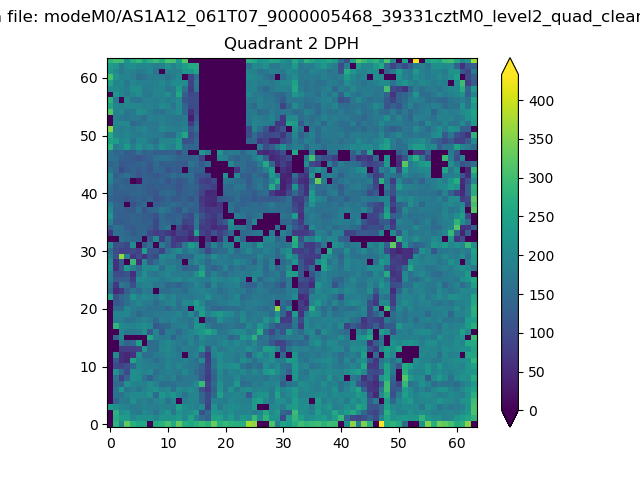
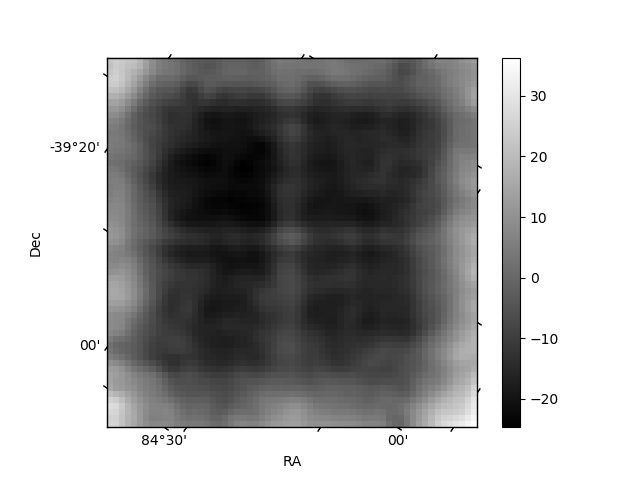
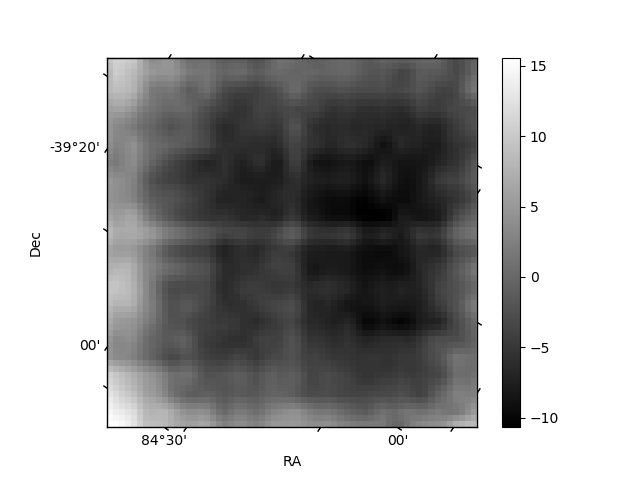
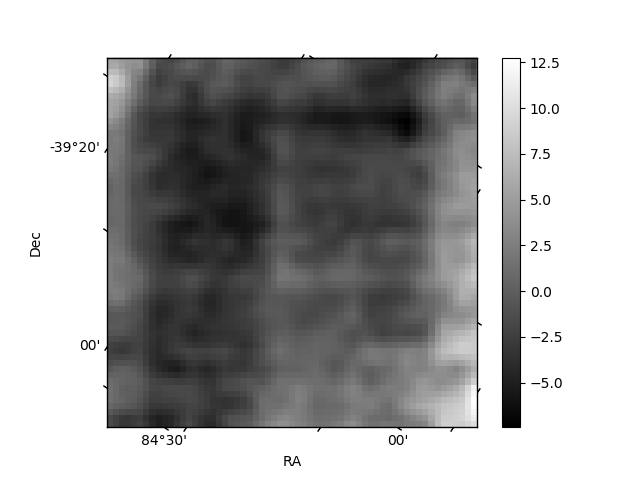
Histogram calculated using DETX and DETY for each event in the final _common_clean file
| Quadrant A | 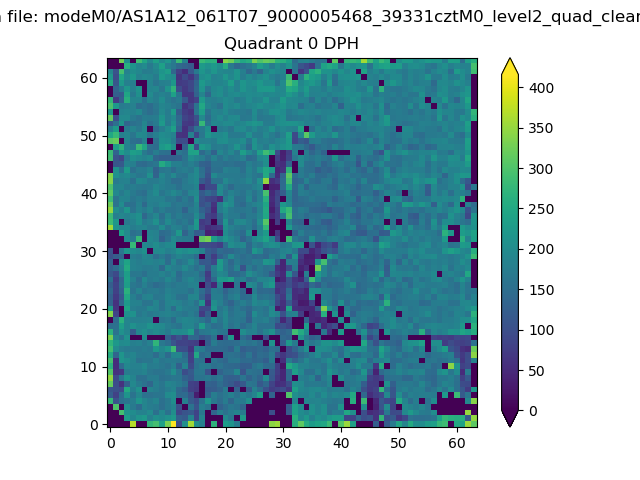 |
 |
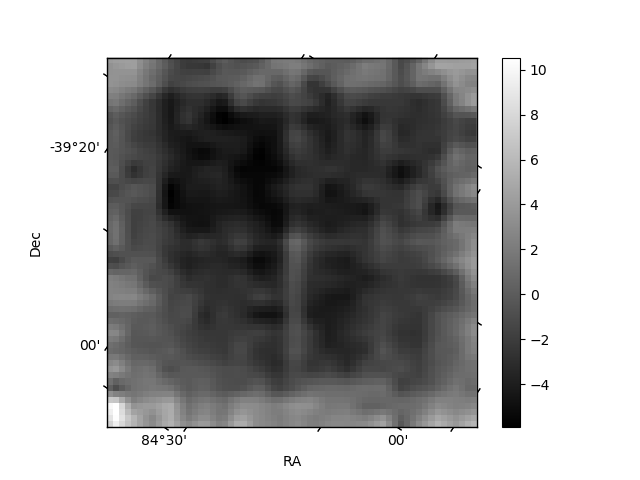
Quadrant B |
|---|---|---|---|
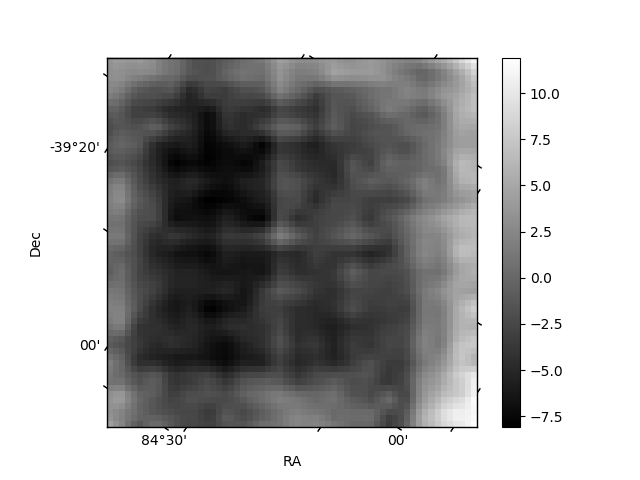
| Quadrant D | 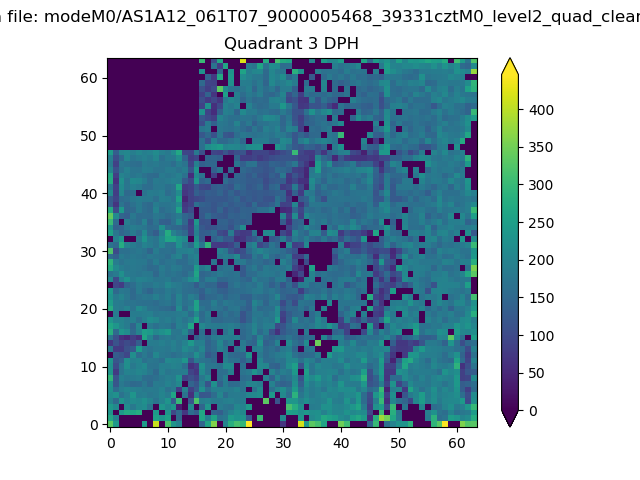 |
 |
Quadrant C |
| Plot type | Count rate plots | Images |
|---|---|---|
| Comparison with Poisson distribution Blue bars denote a histogram of data divided into 1 sec bins. Red curve is a Poisson curve with rate = median count rate of data. |
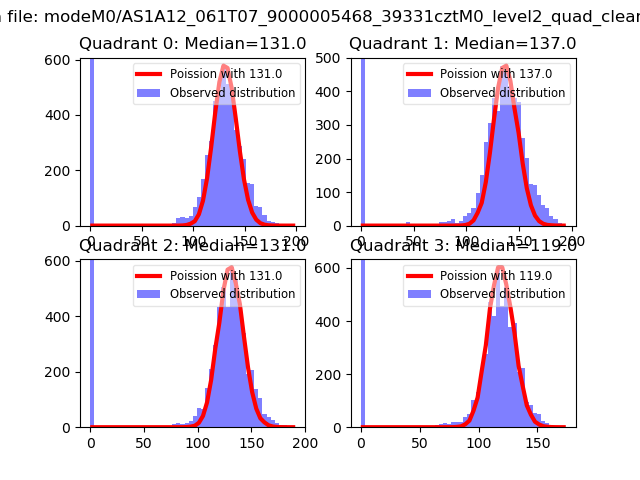 |
 |
| Quadrant-wise count rates Data is divided into 100 sec bins |
 |
|
| Module-wise count rates for Quadrant A Data is divided into 100 sec bins |
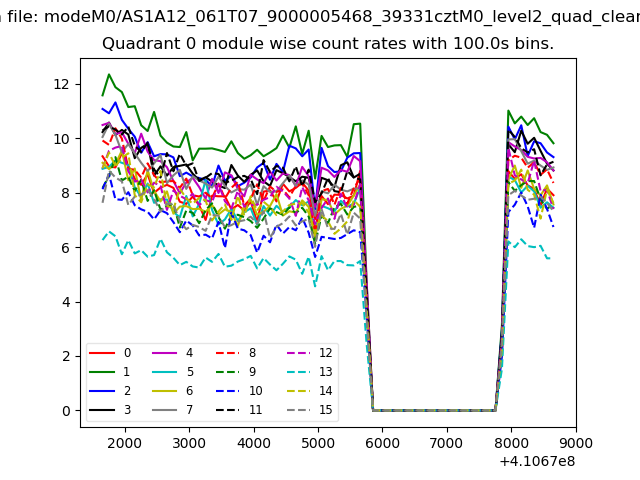 |
 |
| Module-wise count rates for Quadrant B Data is divided into 100 sec bins |
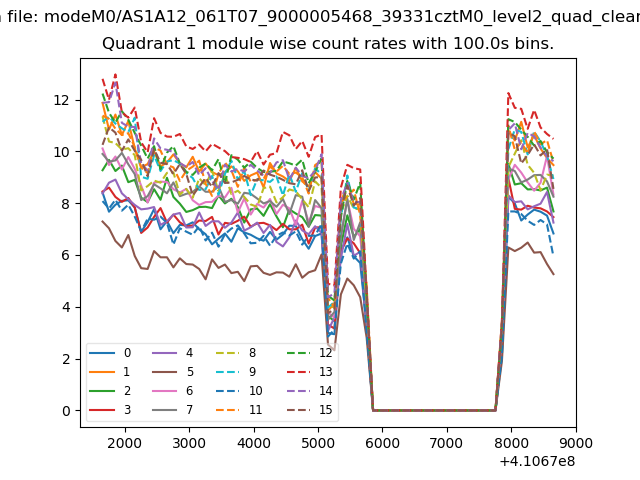 |
 |
| Module-wise count rates for Quadrant C Data is divided into 100 sec bins |
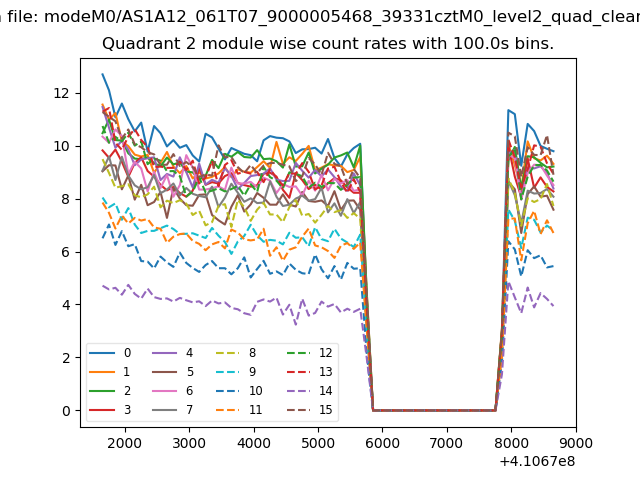 |
 |
| Module-wise count rates for Quadrant D Data is divided into 100 sec bins |
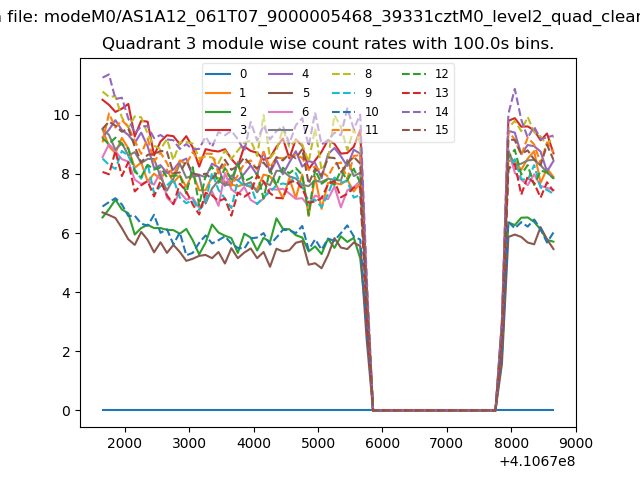 |
 |
| Parameter | Plot |
|---|---|
| CZT HV Monitor | 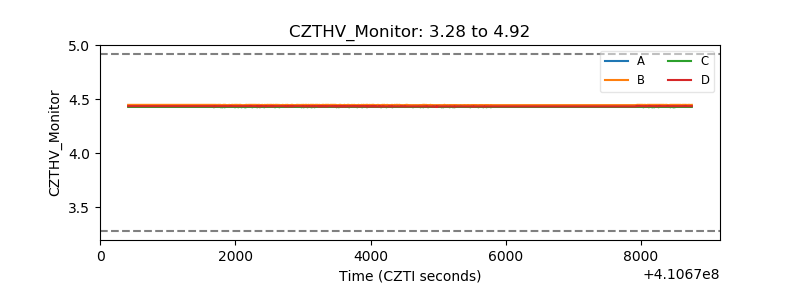 |
| D_VDD | 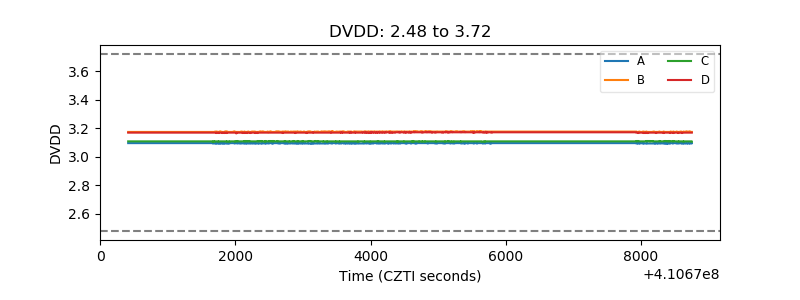 |
| Temperature 1 | 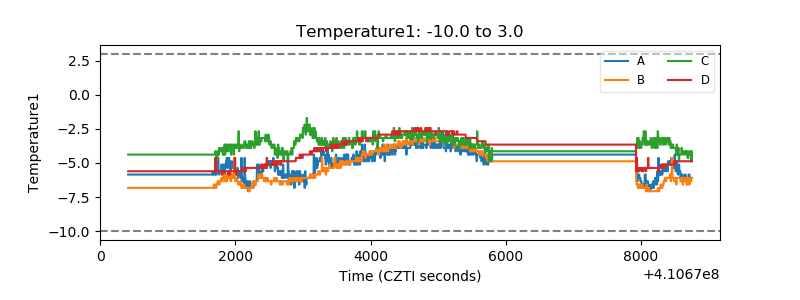 |
| Veto HV Monitor | 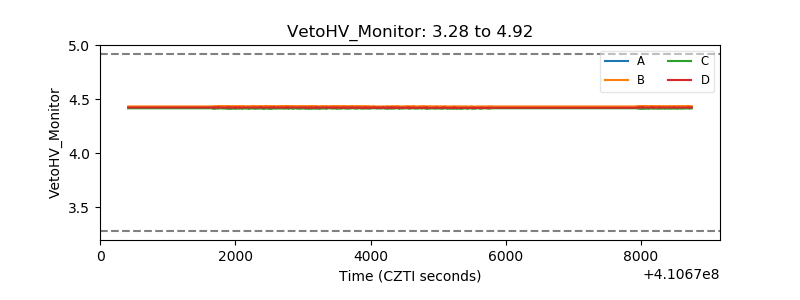 |
| Veto LLD | 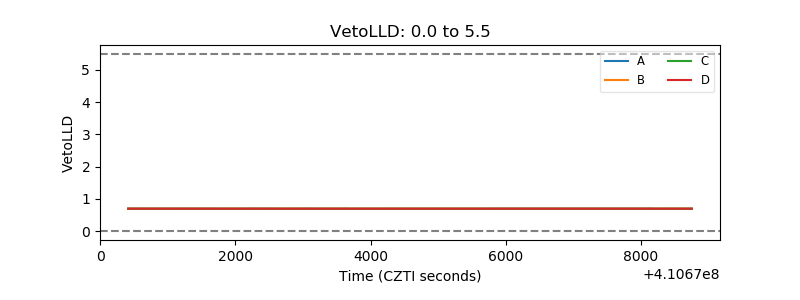 |
| Alpha Counter | 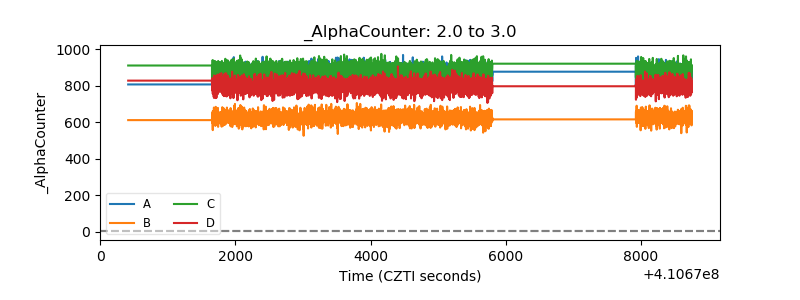 |
| _CPM_Rate | 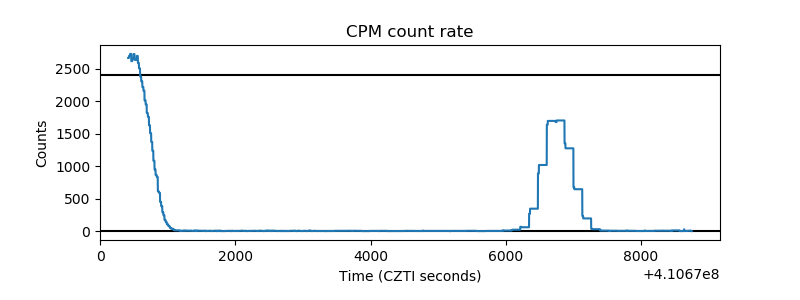 |
| CZT Counter | 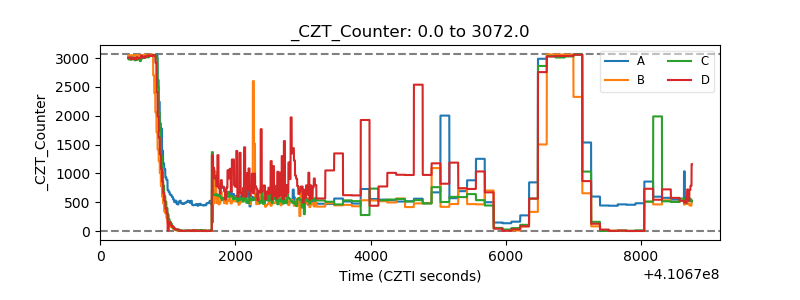 |
| +2.5 Volts monitor | 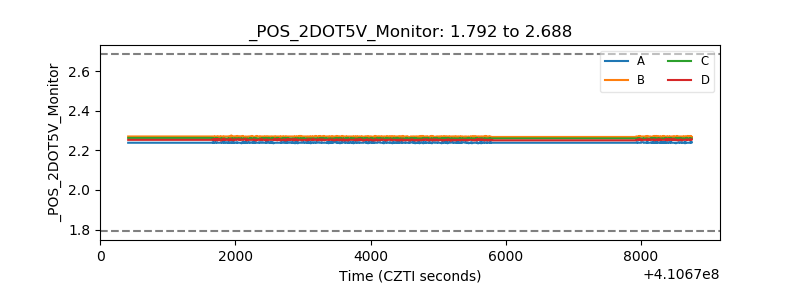 |
| +5 Volts monitor | 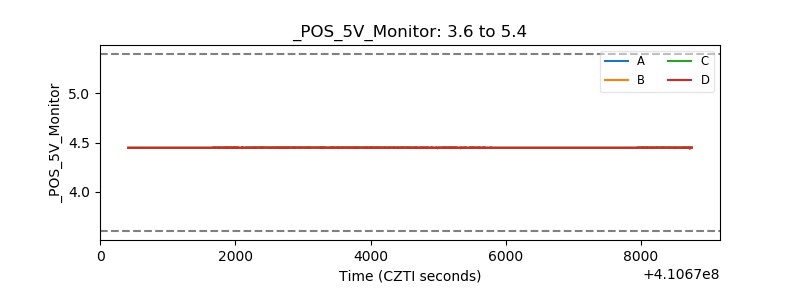 |
| _ROLL_ROT | 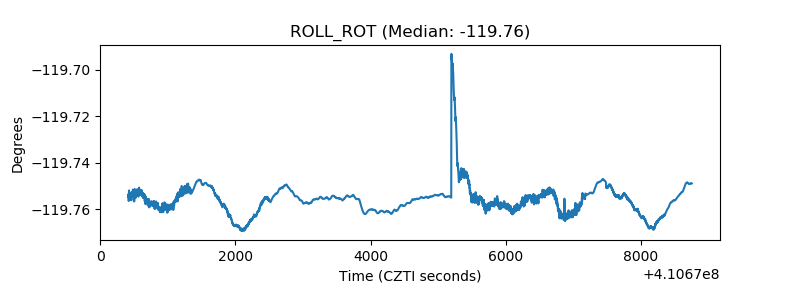 |
| _Roll_DEC | 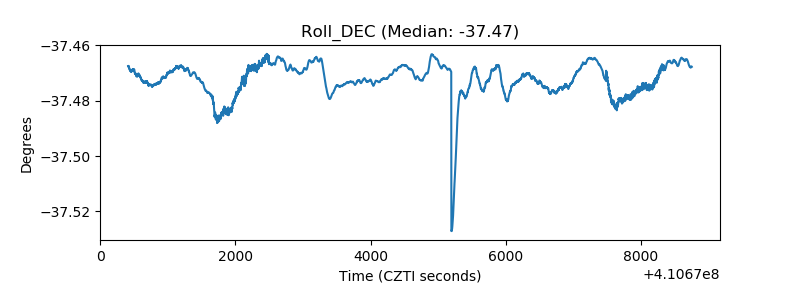 |
| _Roll_RA | 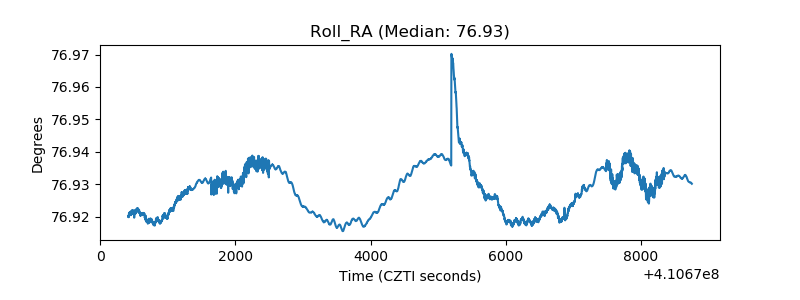 |
| Veto Counter | 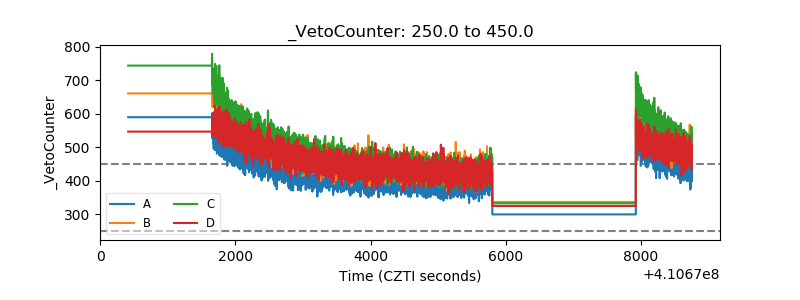 |