| Param | Original file | Final file |
|---|---|---|
| Filename | modeM0/AS1A12_061T07_9000005468_39332cztM0_level2.fits | modeM0/AS1A12_061T07_9000005468_39332cztM0_level2_quad_clean.evt |
| Size (bytes) | 332,147,520 | 90,000,000 |
| Size | 316.8 MB | 85.8 MB |
| Events in quadrant A | 2,668,507 | 607,822 |
| Events in quadrant B | 2,378,252 | 634,148 |
| Events in quadrant C | 2,602,257 | 604,446 |
| Events in quadrant D | 4,273,525 | 543,283 |
| Mode M9 | |||
|---|---|---|---|
| Quadrant | BADHDUFLAG | Total packets | Discarded packets |
| A | 0 | 33 | 0 |
| B | 0 | 33 | 0 |
| C | 0 | 33 | 0 |
| D | 0 | 34 | 0 |
| Mode SS | |||
|---|---|---|---|
| Quadrant | BADHDUFLAG | Total packets | Discarded packets |
| A | 0 | 98 | 0 |
| B | 0 | 98 | 0 |
| C | 0 | 98 | 0 |
| D | 0 | 98 | 0 |
| Mode M0 | |||
|---|---|---|---|
| Quadrant | BADHDUFLAG | Total packets | Discarded packets |
| A | 0 | 10606 | 3 |
| B | 0 | 9844 | 2 |
| C | 0 | 10348 | 2 |
| D | 0 | 16046 | 2 |
| Quadrant | Total seconds | Saturated seconds | Saturation percentage |
|---|---|---|---|
| A | 4784 | 15 | 0.313545% |
| B | 4784 | 13 | 0.271739% |
| C | 4784 | 22 | 0.459866% |
| D | 4784 | 138 | 2.884615% |
Noise dominated data is calculated using 1-second bins in cleaned event files. If a bin has >2000 counts, and if more than 50% of those come from <1% of pixels, then it is considered to be noise-dominated and hence unusable.
| Quadrant | # 1 sec bins | Bins with >0 counts | Bins with >2000 counts | High rate bins dominated by noise | Noise dominated (total time) | Noise dominated (detector-on time) | Marked lightcurve |
|---|---|---|---|---|---|---|---|
| A | 6937 | 4785 | 6 | 6 | 0.09% | 0.13% | 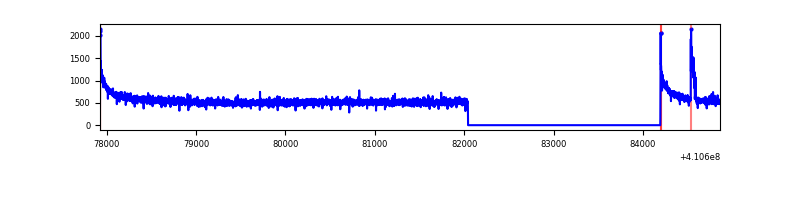 |
| B | 6937 | 4785 | 3 | 3 | 0.04% | 0.06% | 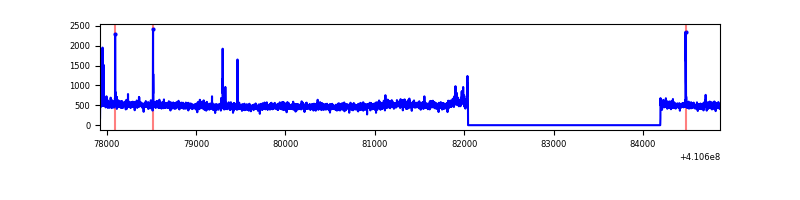 |
| C | 6937 | 4785 | 11 | 11 | 0.16% | 0.23% | 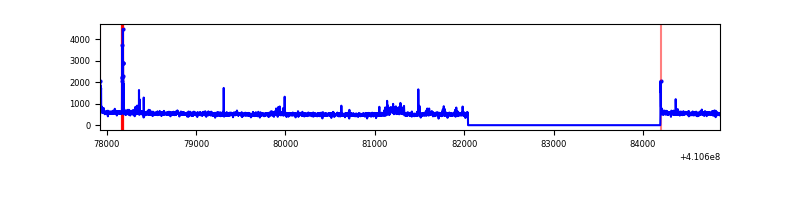 |
| D | 6937 | 4785 | 130 | 130 | 1.87% | 2.72% | 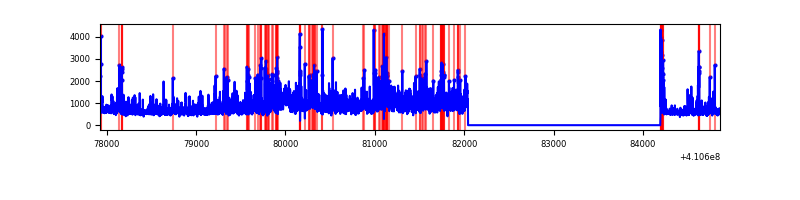 |
Top three noisy pixels from each quadrant. If the there are fewer than three noisy pixels in the level2.evt file, extra rows are filled as -1
| Pixel properties | Quadrant properties | ||||||
|---|---|---|---|---|---|---|---|
| Quadrant | DetID | PixID | Counts | Sigma | Mean | Median | Sigma |
| A | 10 | 83 | 392768 | 3369.4 | 578 | 570 | 116.4 |
| A | 2 | 247 | 37187 | 314.58 | 578 | 570 | 116.4 |
| A | 13 | 254 | 6898 | 54.36 | 578 | 570 | 116.4 |
| B | 5 | 184 | 46016 | 416.68 | 577 | 564 | 109.1 |
| B | 5 | 172 | 36955 | 333.61 | 577 | 564 | 109.1 |
| B | 5 | 255 | 24692 | 221.19 | 577 | 564 | 109.1 |
| C | 15 | 214 | 222453 | 1682.81 | 571 | 576 | 131.8 |
| C | 14 | 254 | 83208 | 626.72 | 571 | 576 | 131.8 |
| C | 0 | 239 | 22836 | 168.83 | 571 | 576 | 131.8 |
| D | 12 | 235 | 1558524 | 11392.44 | 561 | 547 | 136.8 |
| D | 2 | 153 | 234388 | 1709.92 | 561 | 547 | 136.8 |
| D | 13 | 249 | 105725 | 769.1 | 561 | 547 | 136.8 |
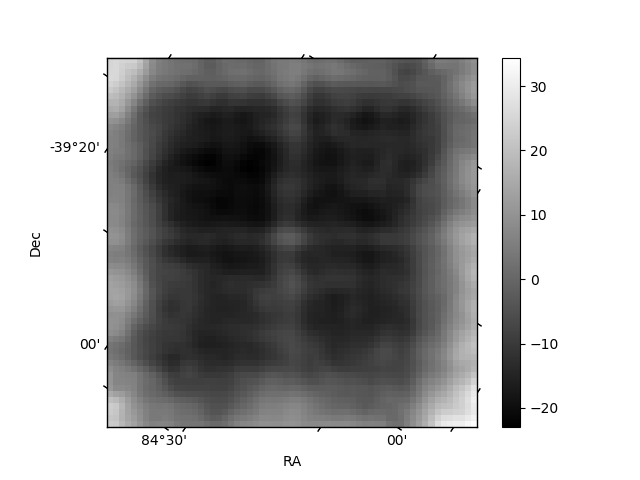
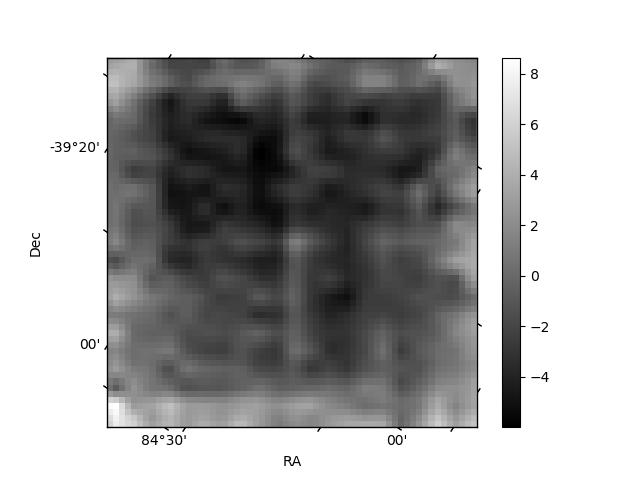
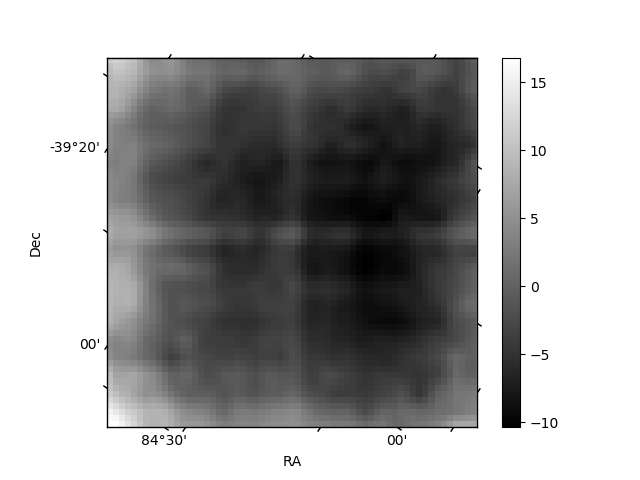
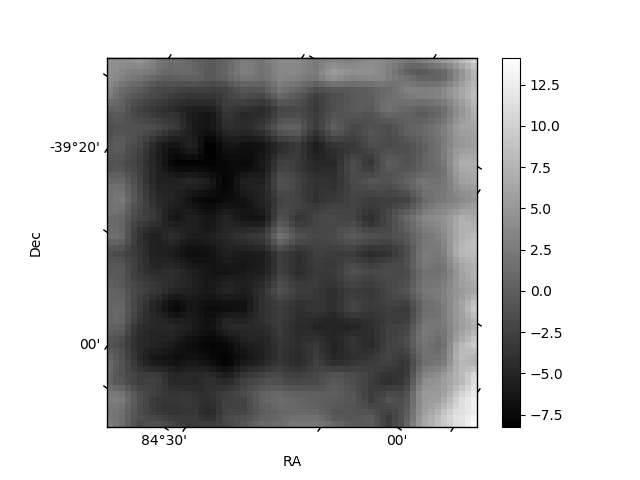
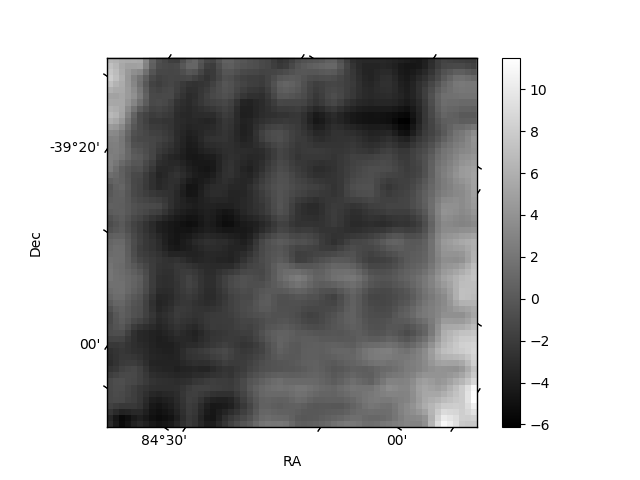
Histogram calculated using DETX and DETY for each event in the final _common_clean file
| Quadrant A | 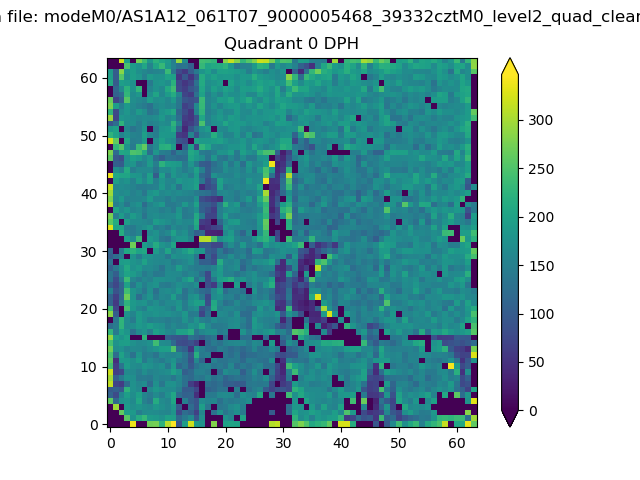 |
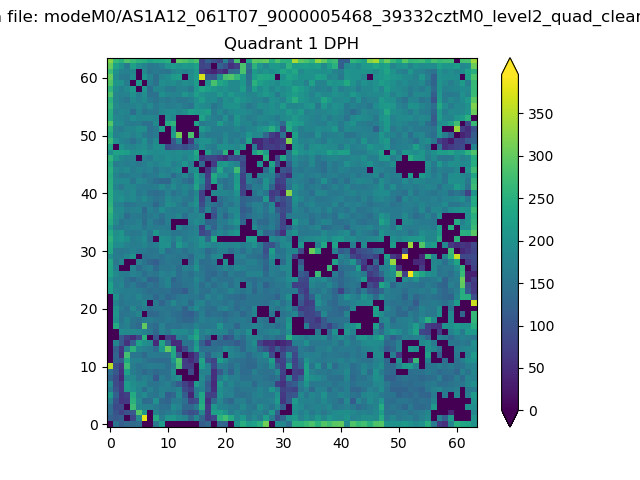 |
Quadrant B |
|---|---|---|---|
| Quadrant D | 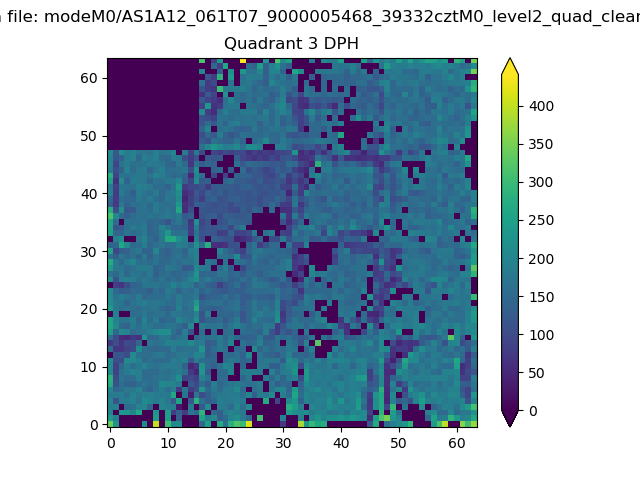 |
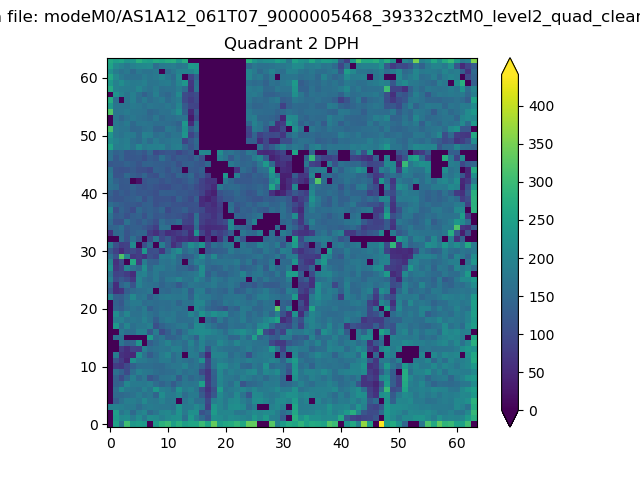 |
Quadrant C |
| Plot type | Count rate plots | Images |
|---|---|---|
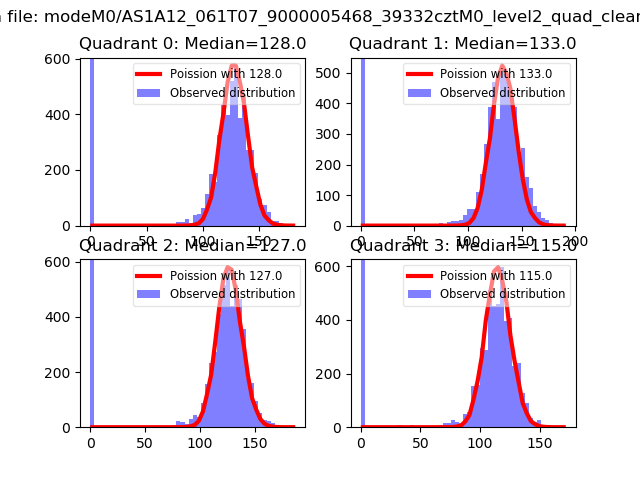
| Comparison with Poisson distribution Blue bars denote a histogram of data divided into 1 sec bins. Red curve is a Poisson curve with rate = median count rate of data. |
 |
 |
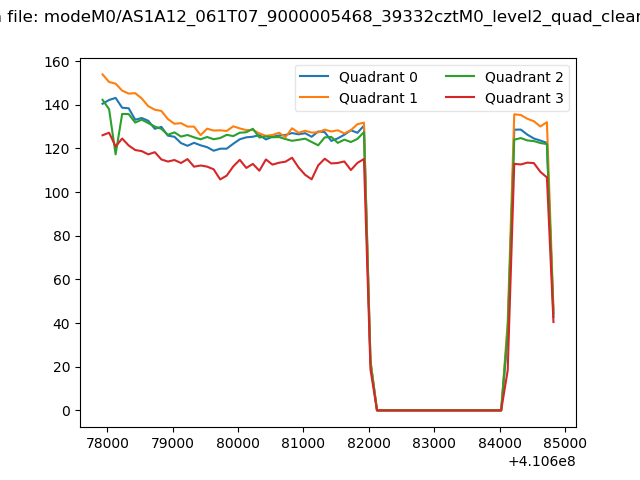
| Quadrant-wise count rates Data is divided into 100 sec bins |
 |
|
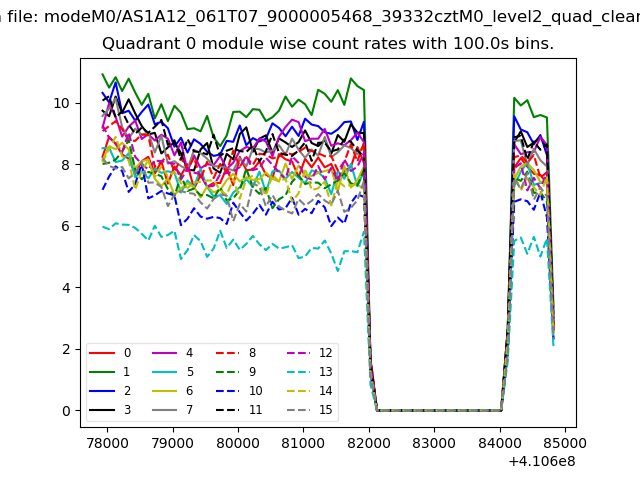
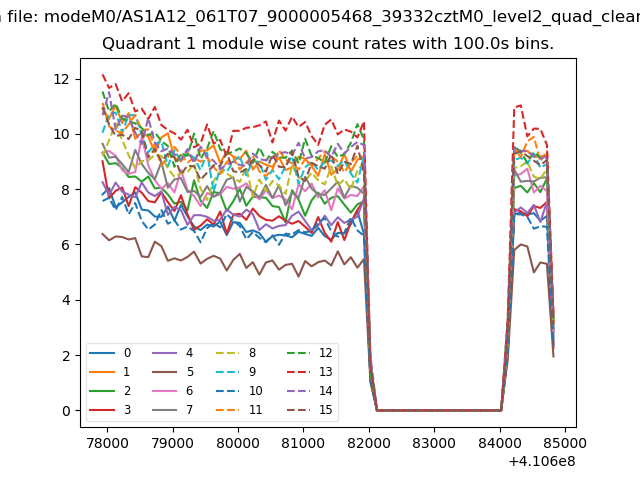
| Module-wise count rates for Quadrant A Data is divided into 100 sec bins |
 |
 |
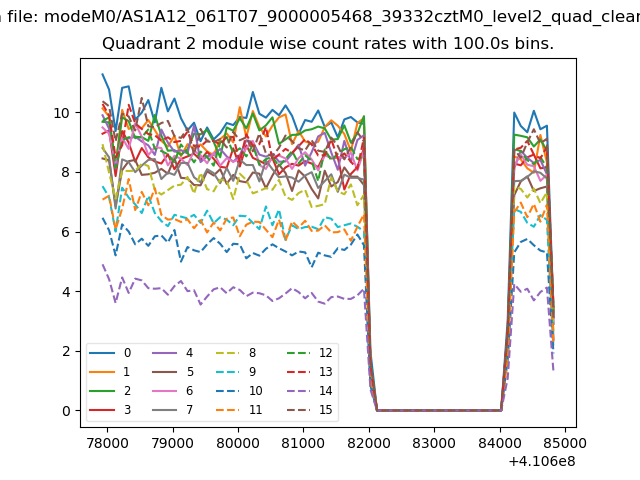
| Module-wise count rates for Quadrant B Data is divided into 100 sec bins |
 |
 |
| Module-wise count rates for Quadrant C Data is divided into 100 sec bins |
 |
 |
| Module-wise count rates for Quadrant D Data is divided into 100 sec bins |
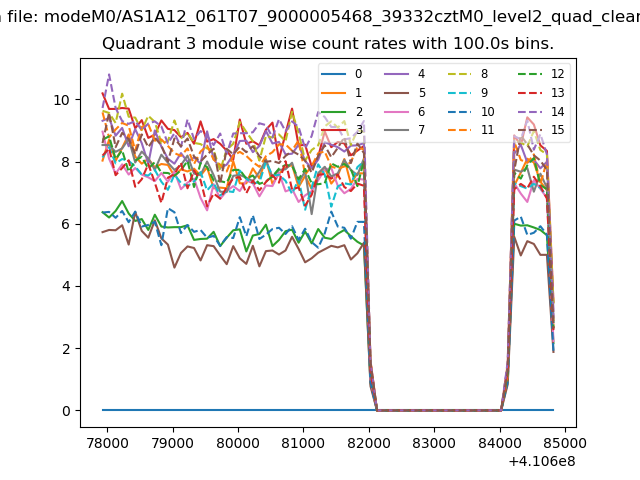 |
 |
| Parameter | Plot |
|---|---|
| CZT HV Monitor | 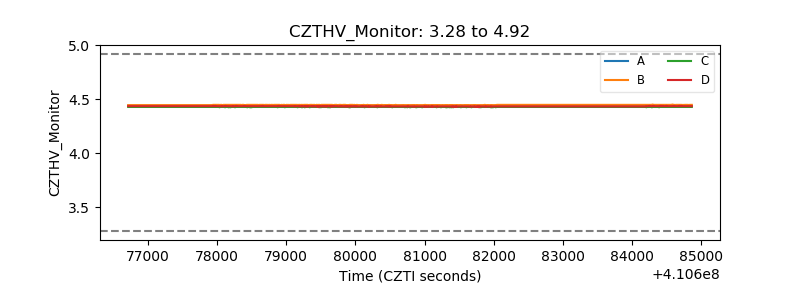 |
| D_VDD | 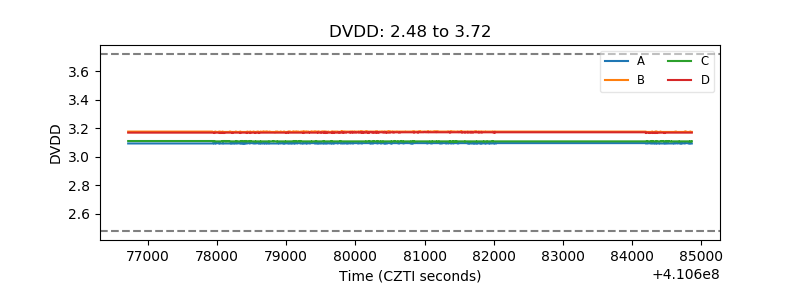 |
| Temperature 1 | 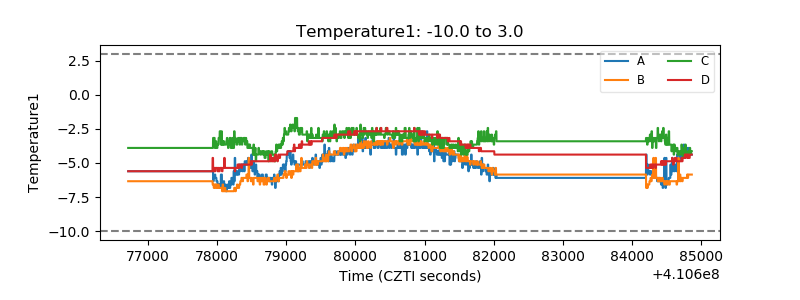 |
| Veto HV Monitor | 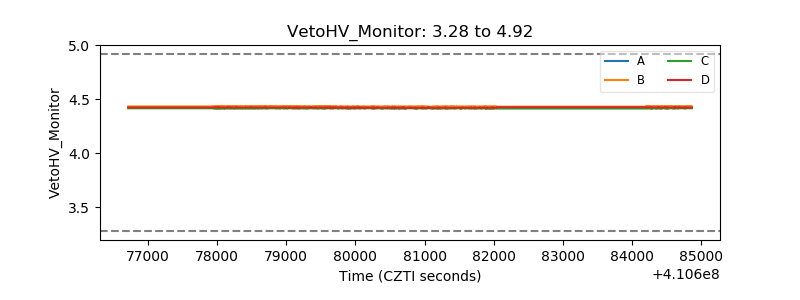 |
| Veto LLD | 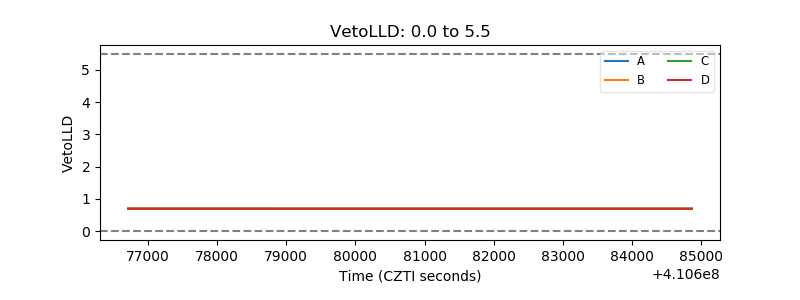 |
| Alpha Counter | 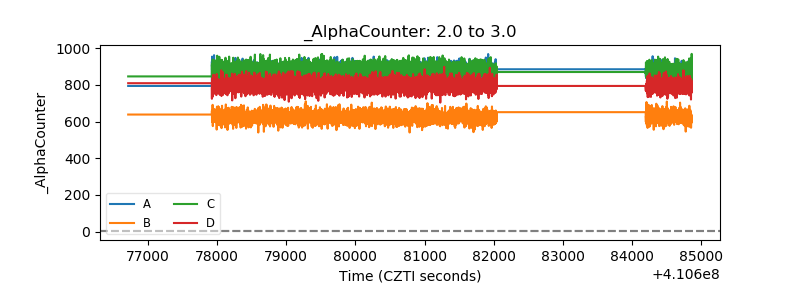 |
| _CPM_Rate | 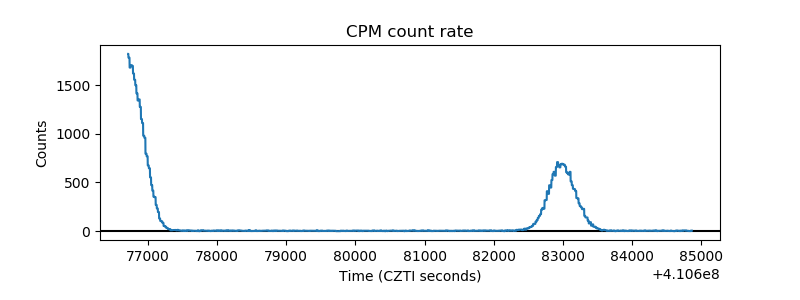 |
| CZT Counter | 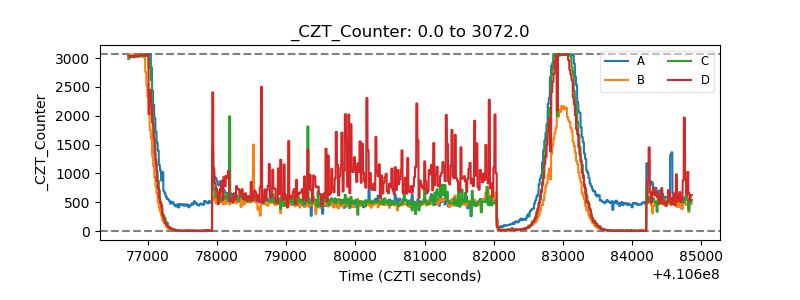 |
| +2.5 Volts monitor | 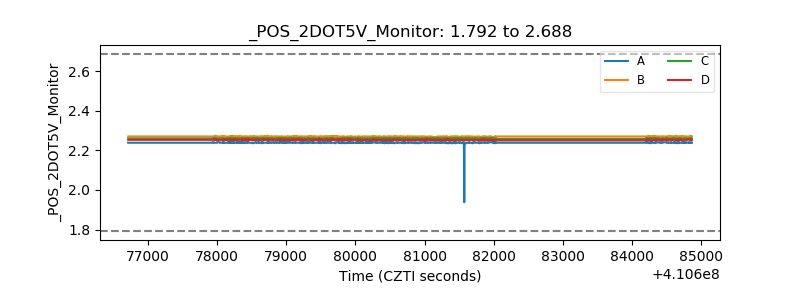 |
| +5 Volts monitor | 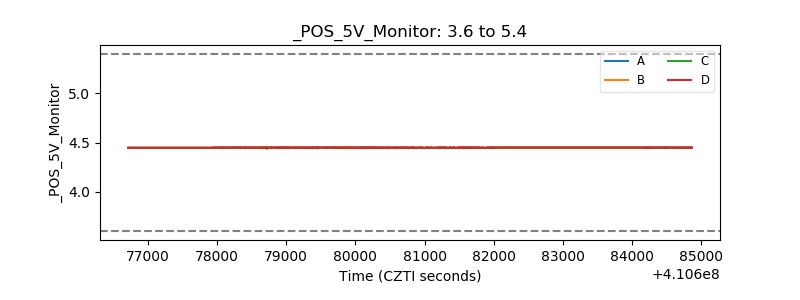 |
| _ROLL_ROT | 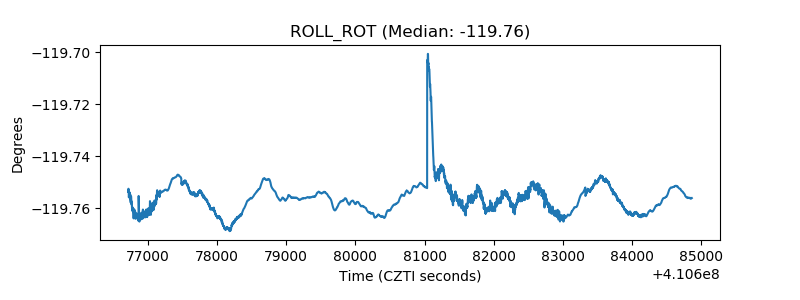 |
| _Roll_DEC | 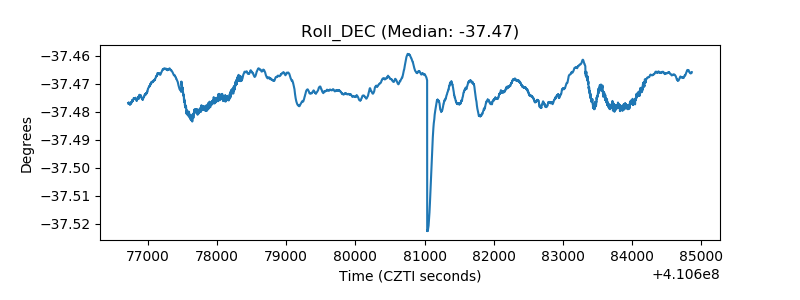 |
| _Roll_RA | 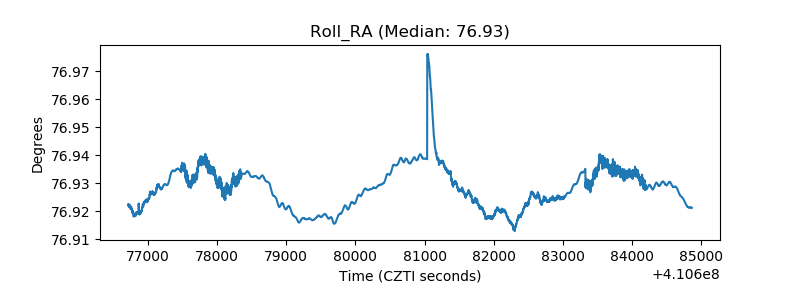 |
| Veto Counter | 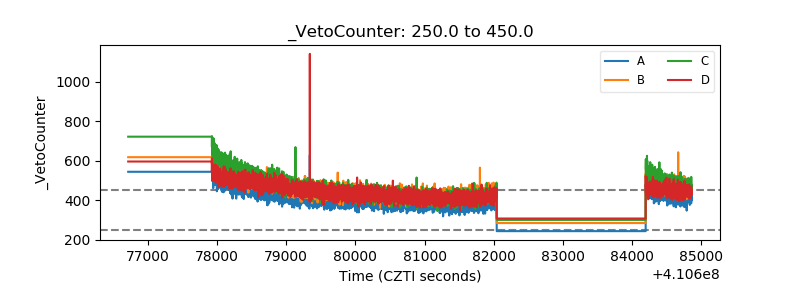 |