| Param | Original file | Final file |
|---|---|---|
| Filename | modeM0/AS1A12_061T07_9000005468_39333cztM0_level2.fits | modeM0/AS1A12_061T07_9000005468_39333cztM0_level2_quad_clean.evt |
| Size (bytes) | 395,035,200 | 94,199,040 |
| Size | 376.7 MB | 89.8 MB |
| Events in quadrant A | 3,030,347 | 637,022 |
| Events in quadrant B | 2,509,357 | 662,192 |
| Events in quadrant C | 2,751,353 | 636,318 |
| Events in quadrant D | 5,918,139 | 543,935 |
| Mode M9 | |||
|---|---|---|---|
| Quadrant | BADHDUFLAG | Total packets | Discarded packets |
| A | 0 | 41 | 0 |
| B | 0 | 41 | 0 |
| C | 0 | 41 | 0 |
| D | 0 | 41 | 0 |
| Mode SS | |||
|---|---|---|---|
| Quadrant | BADHDUFLAG | Total packets | Discarded packets |
| A | 0 | 112 | 0 |
| B | 0 | 112 | 0 |
| C | 0 | 112 | 0 |
| D | 0 | 112 | 0 |
| Mode M0 | |||
|---|---|---|---|
| Quadrant | BADHDUFLAG | Total packets | Discarded packets |
| A | 0 | 12102 | 3 |
| B | 0 | 10873 | 2 |
| C | 0 | 11160 | 2 |
| D | 0 | 21326 | 2 |
| Quadrant | Total seconds | Saturated seconds | Saturation percentage |
|---|---|---|---|
| A | 5323 | 41 | 0.770242% |
| B | 5323 | 14 | 0.263010% |
| C | 5323 | 7 | 0.131505% |
| D | 5323 | 508 | 9.543491% |
Noise dominated data is calculated using 1-second bins in cleaned event files. If a bin has >2000 counts, and if more than 50% of those come from <1% of pixels, then it is considered to be noise-dominated and hence unusable.
| Quadrant | # 1 sec bins | Bins with >0 counts | Bins with >2000 counts | High rate bins dominated by noise | Noise dominated (total time) | Noise dominated (detector-on time) | Marked lightcurve |
|---|---|---|---|---|---|---|---|
| A | 9510 | 5325 | 26 | 26 | 0.27% | 0.49% | 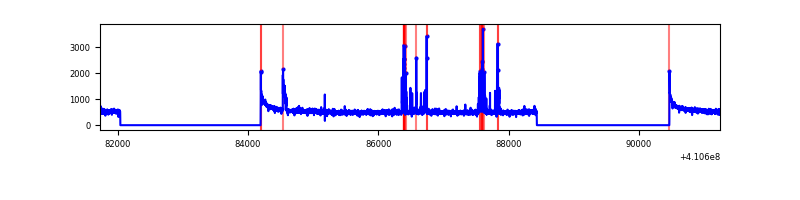 |
| B | 9510 | 5325 | 4 | 4 | 0.04% | 0.08% | 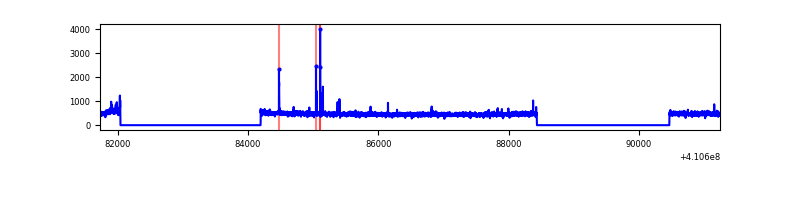 |
| C | 9510 | 5325 | 2 | 2 | 0.02% | 0.04% | 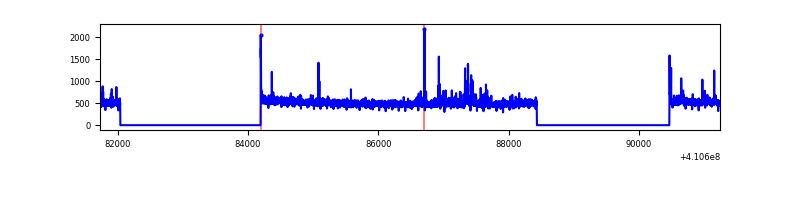 |
| D | 9510 | 5325 | 547 | 547 | 5.75% | 10.27% | 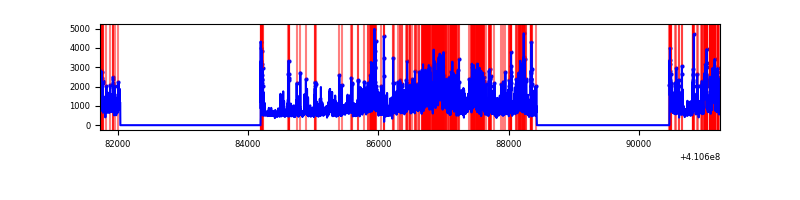 |
Top three noisy pixels from each quadrant. If the there are fewer than three noisy pixels in the level2.evt file, extra rows are filled as -1
| Pixel properties | Quadrant properties | ||||||
|---|---|---|---|---|---|---|---|
| Quadrant | DetID | PixID | Counts | Sigma | Mean | Median | Sigma |
| A | 10 | 83 | 421300 | 3377.51 | 619 | 609 | 124.6 |
| A | 13 | 248 | 176432 | 1411.59 | 619 | 609 | 124.6 |
| A | 2 | 247 | 37346 | 294.94 | 619 | 609 | 124.6 |
| B | 5 | 172 | 61166 | 510.6 | 618 | 600 | 118.6 |
| B | 12 | 111 | 15024 | 121.6 | 618 | 600 | 118.6 |
| B | 11 | 111 | 13649 | 110.01 | 618 | 600 | 118.6 |
| C | 15 | 214 | 245234 | 1725.94 | 609 | 614 | 141.7 |
| C | 9 | 187 | 84303 | 590.47 | 609 | 614 | 141.7 |
| C | 12 | 249 | 16958 | 115.32 | 609 | 614 | 141.7 |
| D | 12 | 235 | 2314226 | 16158.16 | 587 | 573 | 143.2 |
| D | 12 | 227 | 684160 | 4774.06 | 587 | 573 | 143.2 |
| D | 2 | 249 | 265400 | 1849.51 | 587 | 573 | 143.2 |
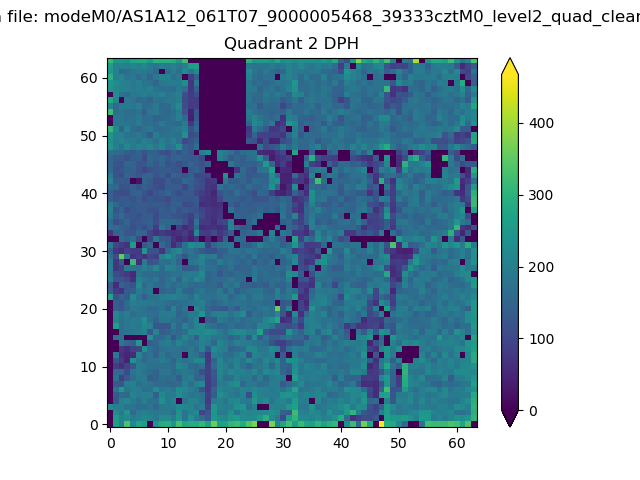
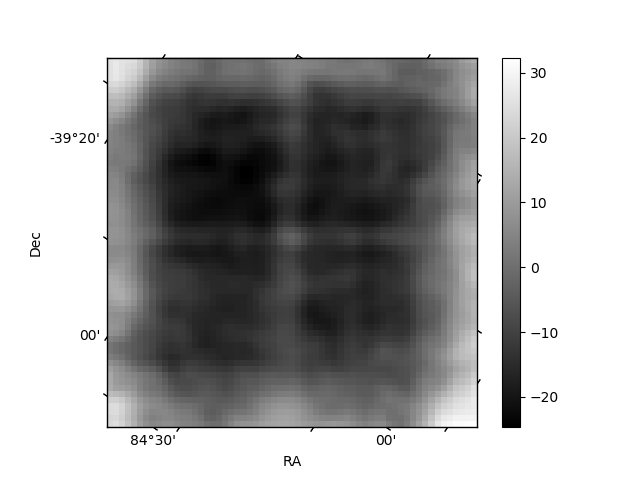
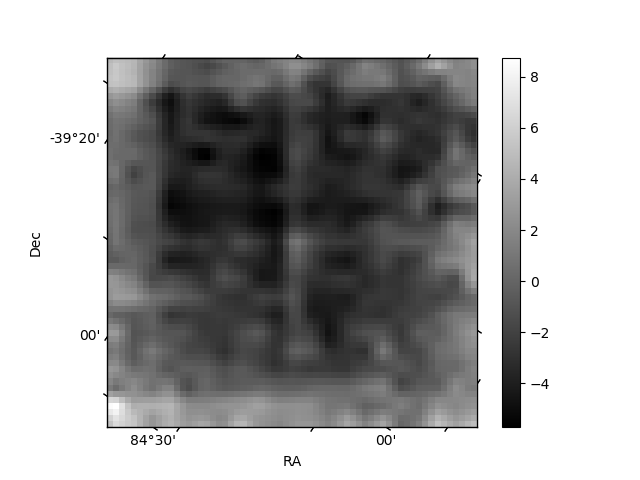
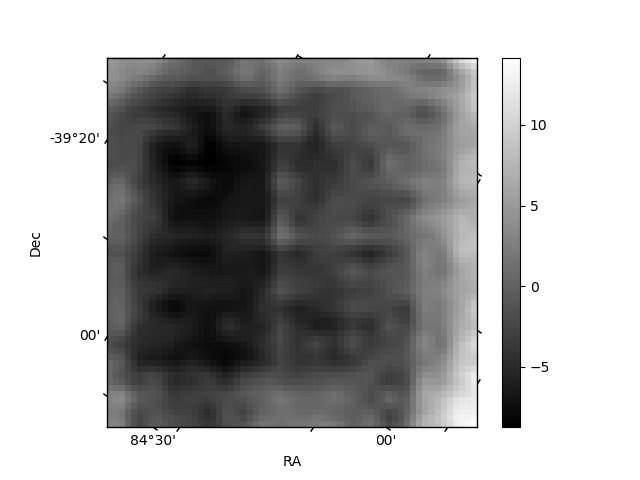
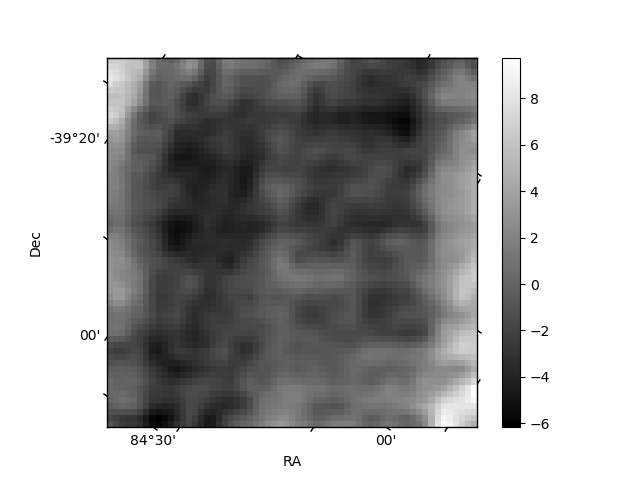
Histogram calculated using DETX and DETY for each event in the final _common_clean file
| Quadrant A | 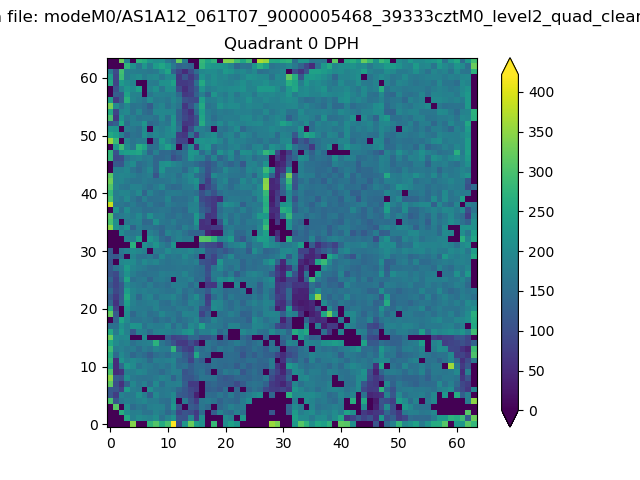 |
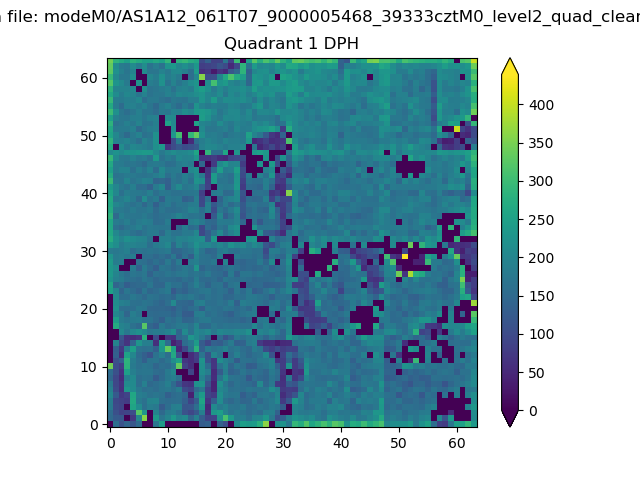 |
Quadrant B |
|---|---|---|---|
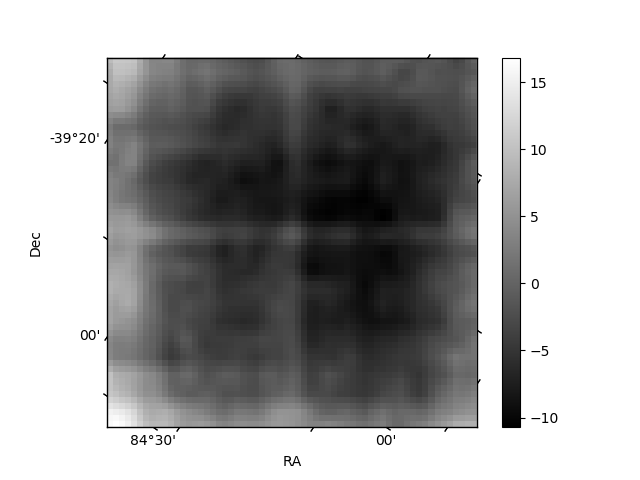
| Quadrant D | 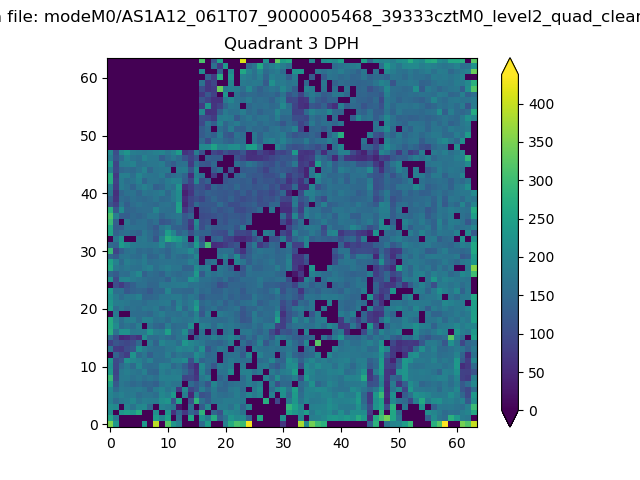 |
 |
Quadrant C |
| Plot type | Count rate plots | Images |
|---|---|---|
| Comparison with Poisson distribution Blue bars denote a histogram of data divided into 1 sec bins. Red curve is a Poisson curve with rate = median count rate of data. |
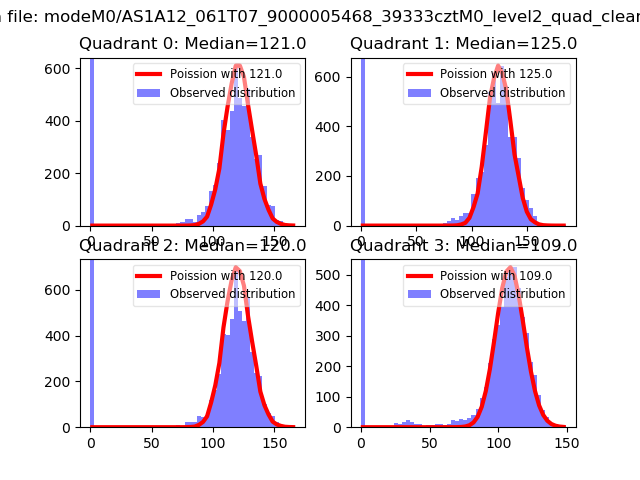 |
 |
| Quadrant-wise count rates Data is divided into 100 sec bins |
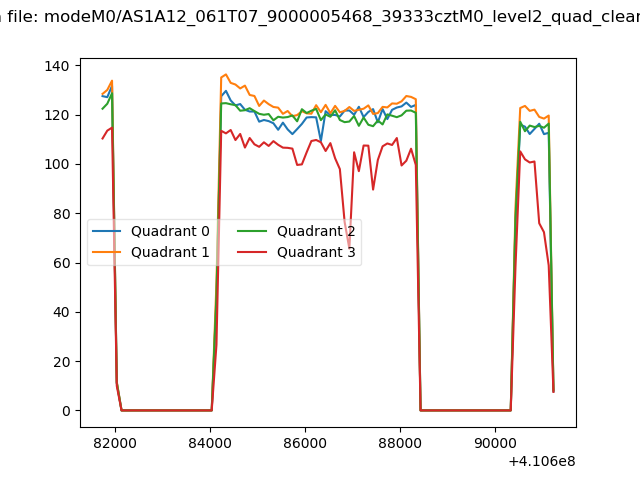 |
|
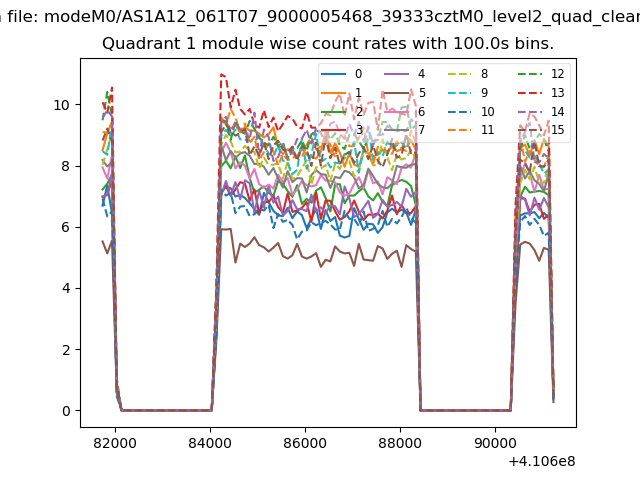
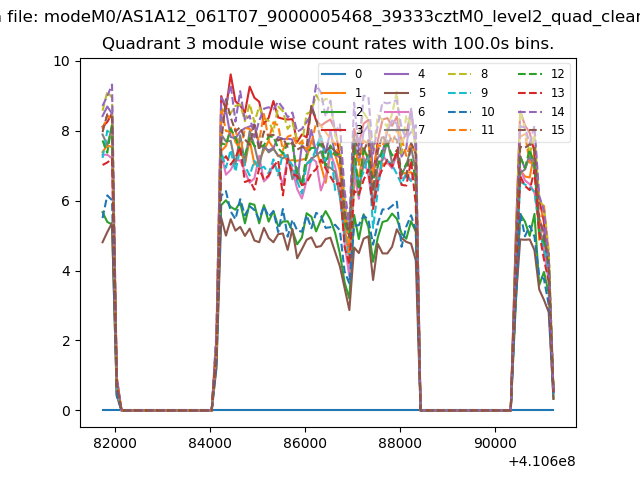
| Module-wise count rates for Quadrant A Data is divided into 100 sec bins |
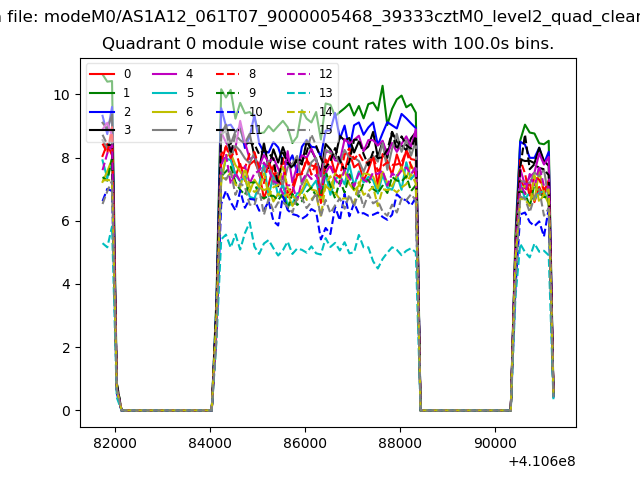 |
 |
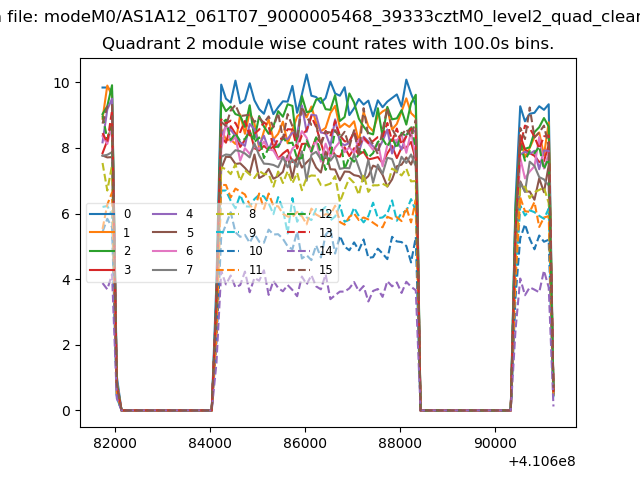
| Module-wise count rates for Quadrant B Data is divided into 100 sec bins |
 |
 |
| Module-wise count rates for Quadrant C Data is divided into 100 sec bins |
 |
 |
| Module-wise count rates for Quadrant D Data is divided into 100 sec bins |
 |
 |
| Parameter | Plot |
|---|---|
| CZT HV Monitor | 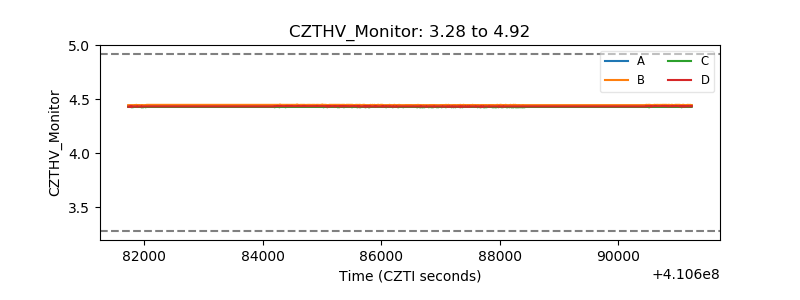 |
| D_VDD | 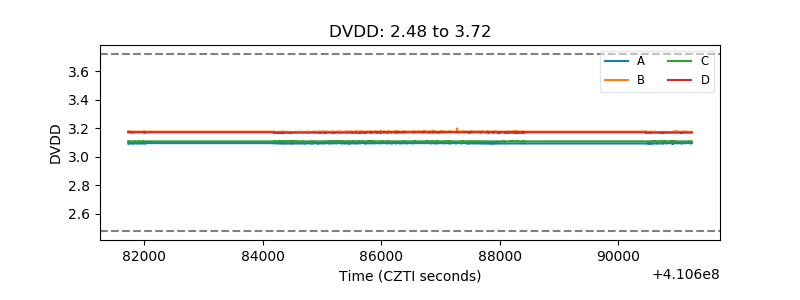 |
| Temperature 1 | 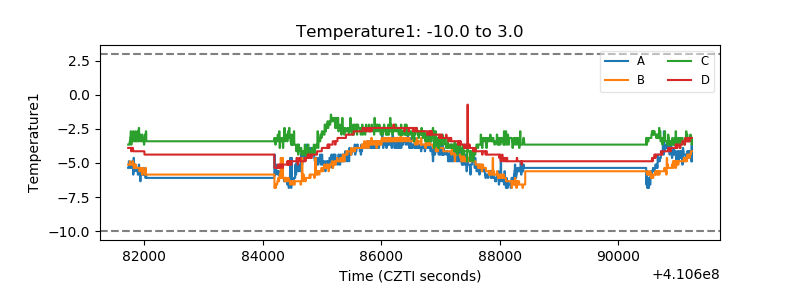 |
| Veto HV Monitor | 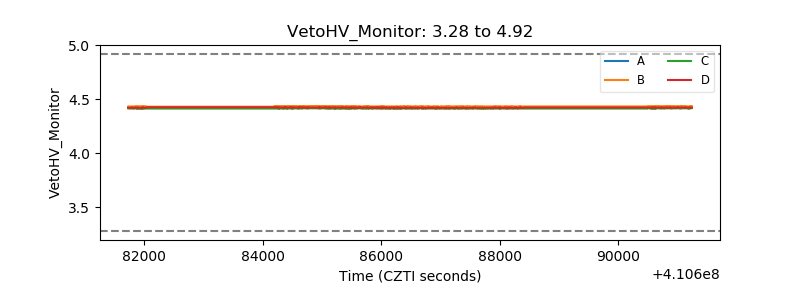 |
| Veto LLD | 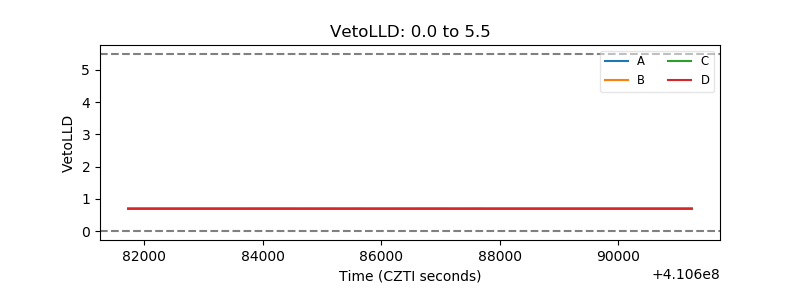 |
| Alpha Counter | 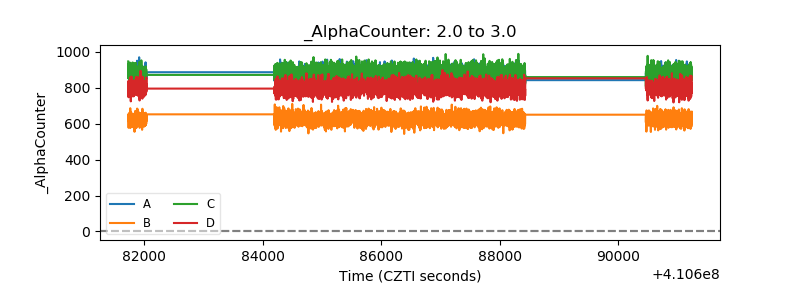 |
| _CPM_Rate |  |
| CZT Counter | 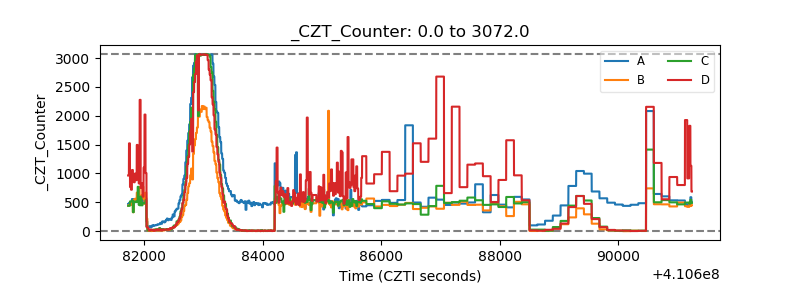 |
| +2.5 Volts monitor | 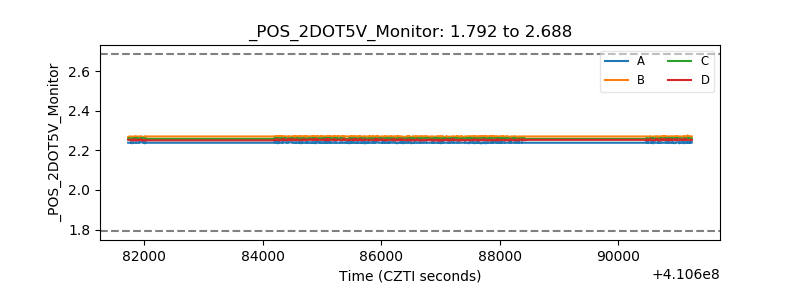 |
| +5 Volts monitor | 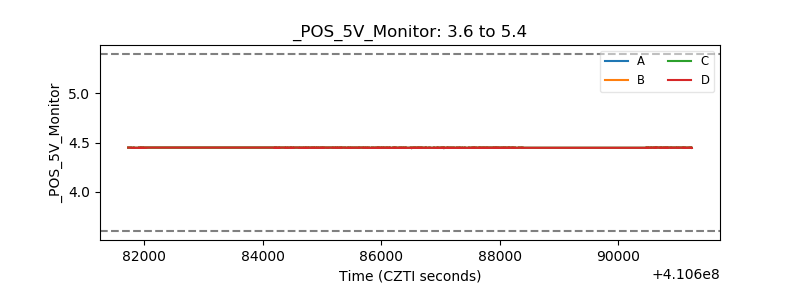 |
| _ROLL_ROT | 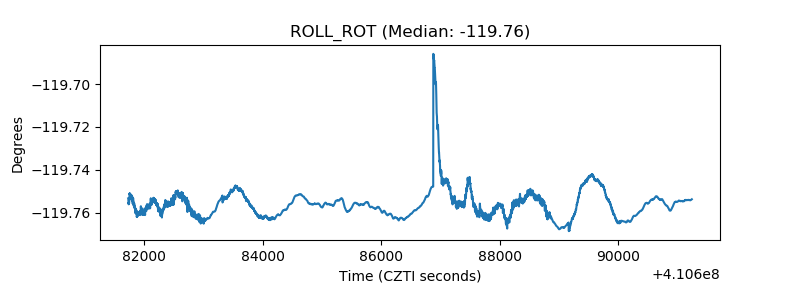 |
| _Roll_DEC | 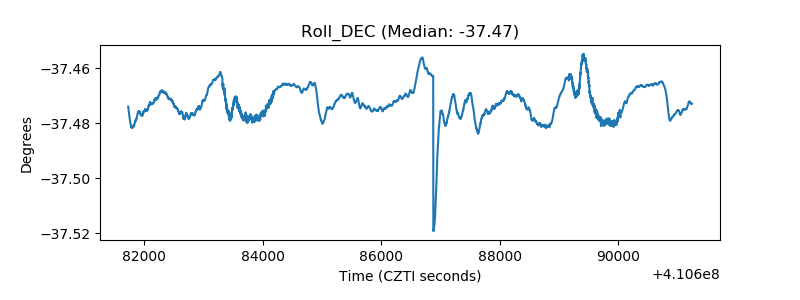 |
| _Roll_RA | 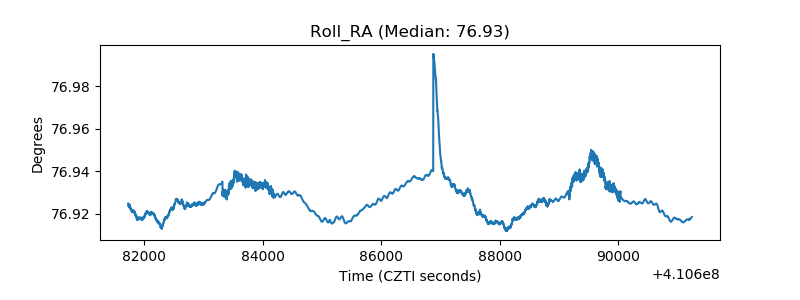 |
| Veto Counter | 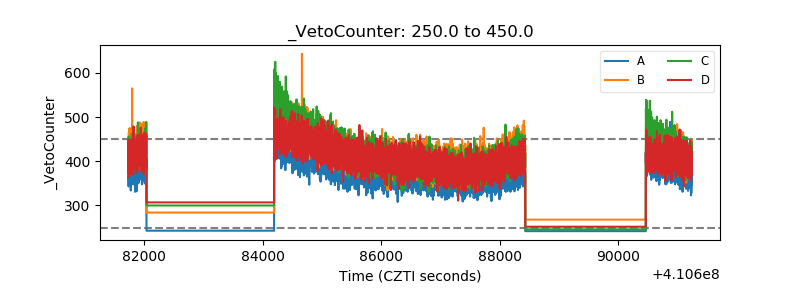 |