| Param | Original file | Final file |
|---|---|---|
| Filename | modeM0/AS1A12_061T07_9000005468_39334cztM0_level2.fits | modeM0/AS1A12_061T07_9000005468_39334cztM0_level2_quad_clean.evt |
| Size (bytes) | 274,340,160 | 65,756,160 |
| Size | 261.6 MB | 62.7 MB |
| Events in quadrant A | 2,141,203 | 440,468 |
| Events in quadrant B | 1,817,980 | 455,404 |
| Events in quadrant C | 1,856,929 | 439,246 |
| Events in quadrant D | 4,036,729 | 382,478 |
| Mode M9 | |||
|---|---|---|---|
| Quadrant | BADHDUFLAG | Total packets | Discarded packets |
| A | 0 | 16 | 0 |
| B | 0 | 16 | 0 |
| C | 0 | 16 | 0 |
| D | 0 | 17 | 0 |
| Mode SS | |||
|---|---|---|---|
| Quadrant | BADHDUFLAG | Total packets | Discarded packets |
| A | 0 | 78 | 0 |
| B | 0 | 78 | 0 |
| C | 0 | 78 | 0 |
| D | 0 | 78 | 0 |
| Mode M0 | |||
|---|---|---|---|
| Quadrant | BADHDUFLAG | Total packets | Discarded packets |
| A | 0 | 8719 | 1 |
| B | 0 | 8026 | 1 |
| C | 0 | 7911 | 1 |
| D | 0 | 14809 | 1 |
| Quadrant | Total seconds | Saturated seconds | Saturation percentage |
|---|---|---|---|
| A | 3873 | 57 | 1.471727% |
| B | 3873 | 7 | 0.180738% |
| C | 3873 | 3 | 0.077459% |
| D | 3873 | 324 | 8.365608% |
Noise dominated data is calculated using 1-second bins in cleaned event files. If a bin has >2000 counts, and if more than 50% of those come from <1% of pixels, then it is considered to be noise-dominated and hence unusable.
| Quadrant | # 1 sec bins | Bins with >0 counts | Bins with >2000 counts | High rate bins dominated by noise | Noise dominated (total time) | Noise dominated (detector-on time) | Marked lightcurve |
|---|---|---|---|---|---|---|---|
| A | 3873 | 3873 | 37 | 37 | 0.96% | 0.96% | 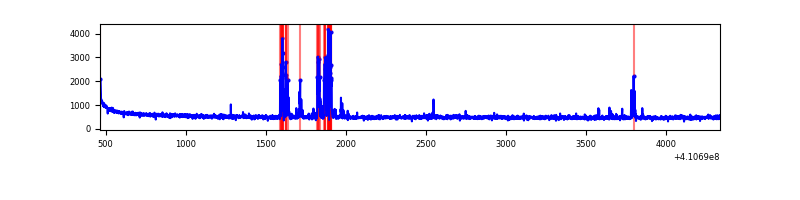 |
| B | 3873 | 3873 | 0 | 0 | 0.00% | 0.00% | 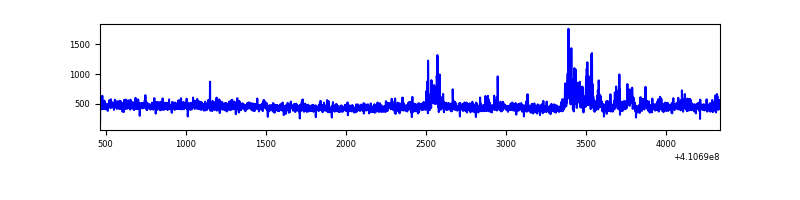 |
| C | 3873 | 3873 | 0 | 0 | 0.00% | 0.00% | 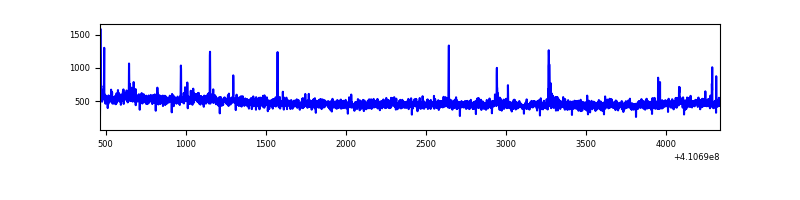 |
| D | 3873 | 3873 | 293 | 293 | 7.57% | 7.57% | 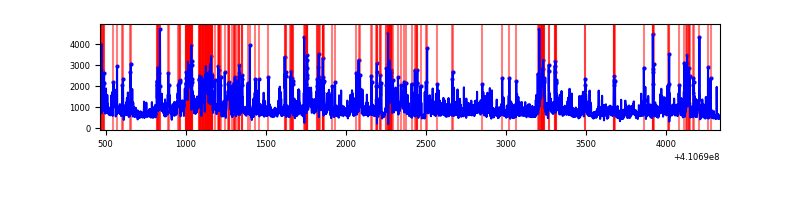 |
Top three noisy pixels from each quadrant. If the there are fewer than three noisy pixels in the level2.evt file, extra rows are filled as -1
| Pixel properties | Quadrant properties | ||||||
|---|---|---|---|---|---|---|---|
| Quadrant | DetID | PixID | Counts | Sigma | Mean | Median | Sigma |
| A | 10 | 83 | 272290 | 3102.85 | 431 | 422 | 87.6 |
| A | 13 | 248 | 200311 | 2281.35 | 431 | 422 | 87.6 |
| A | 3 | 137 | 4737 | 49.25 | 431 | 422 | 87.6 |
| B | 5 | 255 | 115627 | 1366.49 | 428 | 416 | 84.3 |
| B | 12 | 111 | 10621 | 121.04 | 428 | 416 | 84.3 |
| B | 5 | 172 | 10536 | 120.03 | 428 | 416 | 84.3 |
| C | 15 | 214 | 174397 | 1780.0 | 418 | 422 | 97.7 |
| C | 9 | 187 | 25451 | 256.08 | 418 | 422 | 97.7 |
| C | 12 | 249 | 12774 | 126.38 | 418 | 422 | 97.7 |
| D | 12 | 235 | 1204965 | 11957.38 | 407 | 396 | 100.7 |
| D | 12 | 227 | 767322 | 7613.03 | 407 | 396 | 100.7 |
| D | 13 | 249 | 215643 | 2136.69 | 407 | 396 | 100.7 |
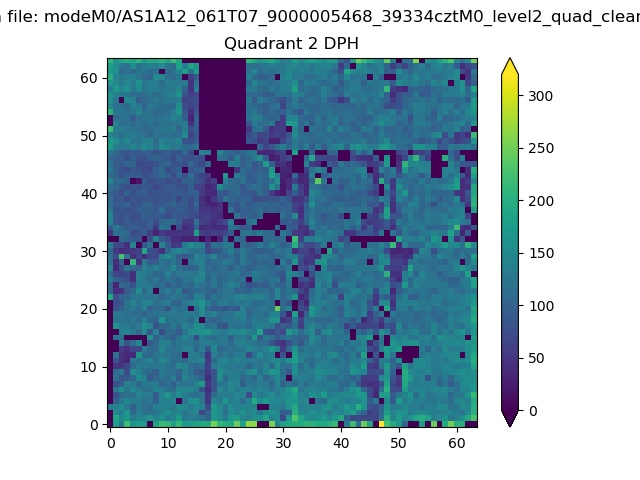
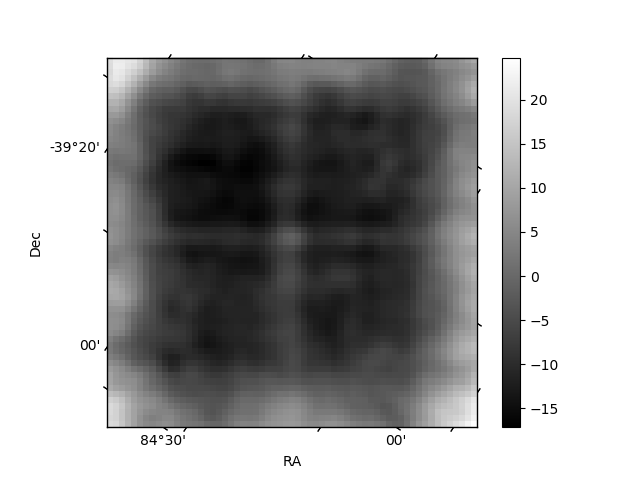
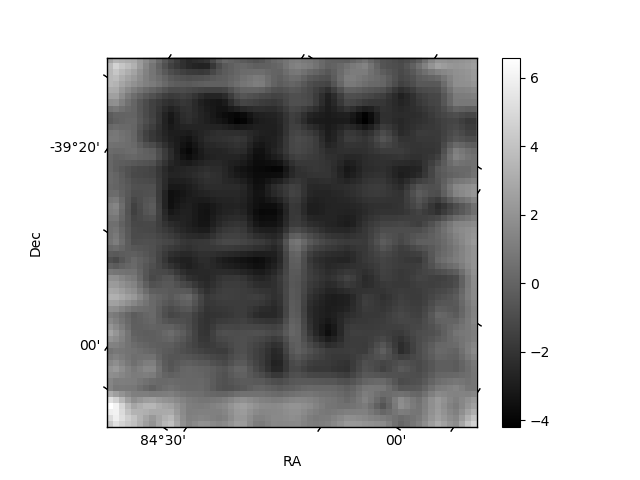
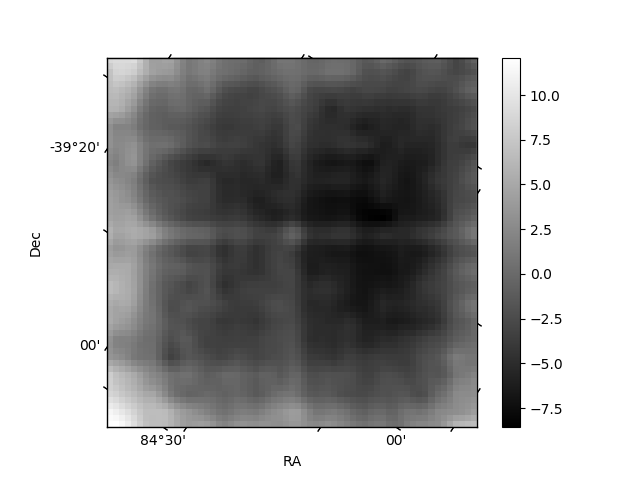
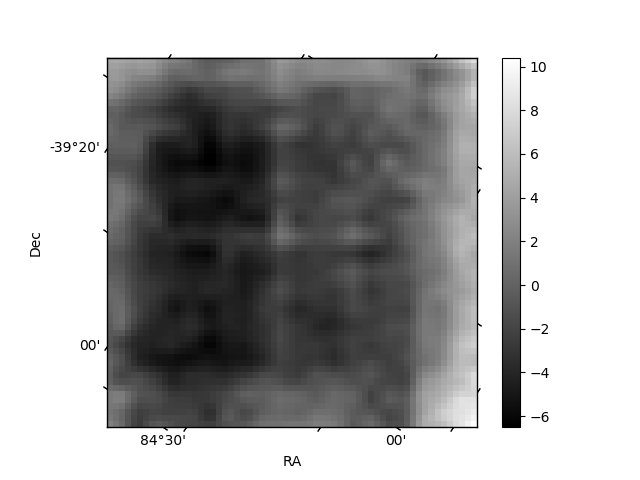
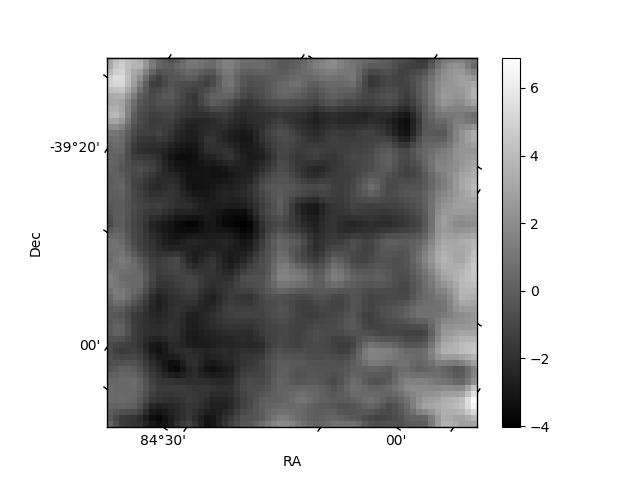
Histogram calculated using DETX and DETY for each event in the final _common_clean file
| Quadrant A | 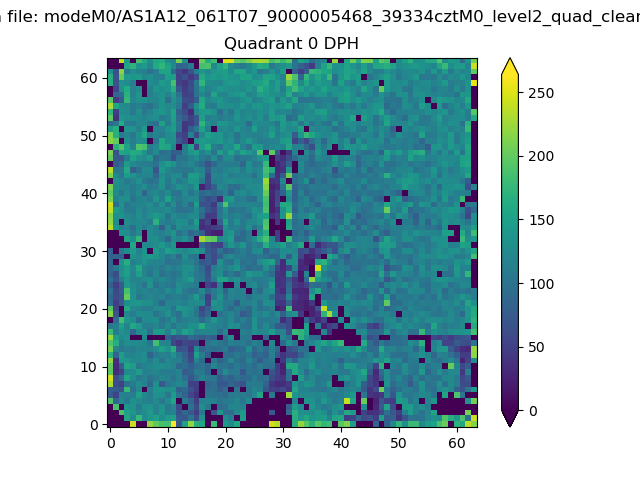 |
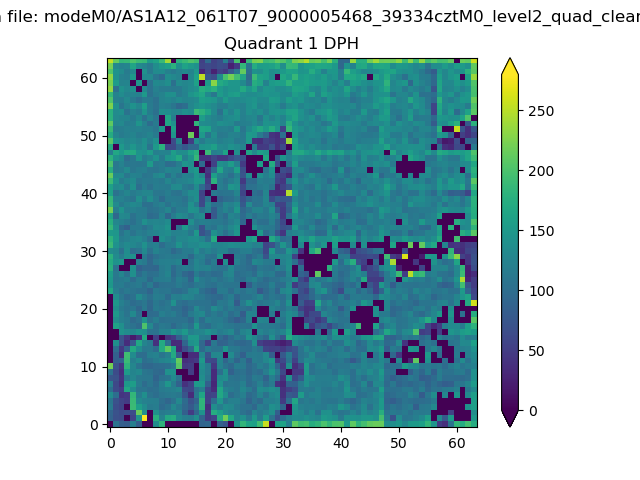 |
Quadrant B |
|---|---|---|---|
| Quadrant D | 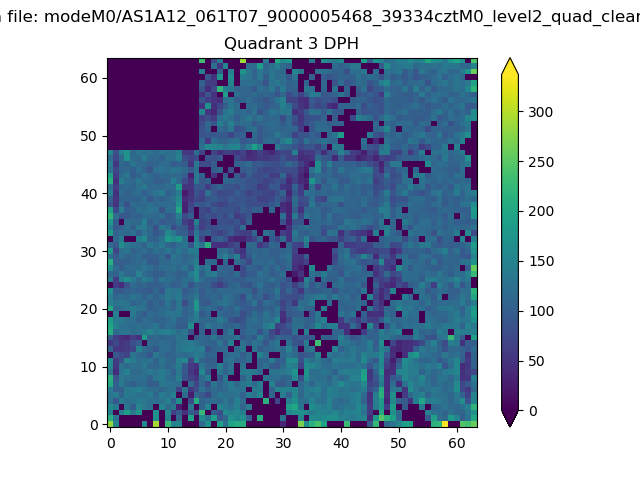 |
 |
Quadrant C |
| Plot type | Count rate plots | Images |
|---|---|---|
| Comparison with Poisson distribution Blue bars denote a histogram of data divided into 1 sec bins. Red curve is a Poisson curve with rate = median count rate of data. |
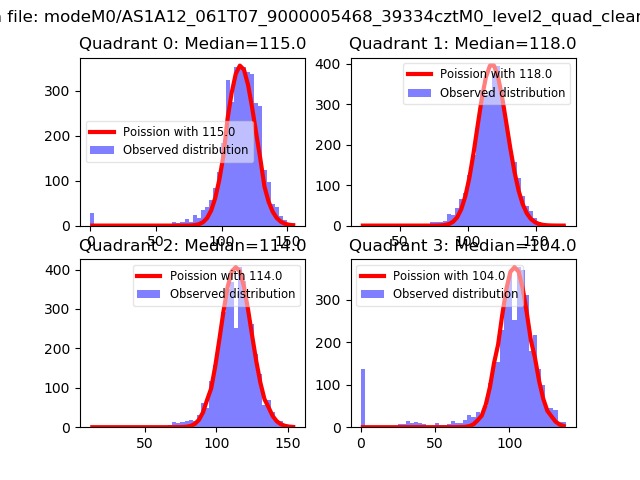 |
 |
| Quadrant-wise count rates Data is divided into 100 sec bins |
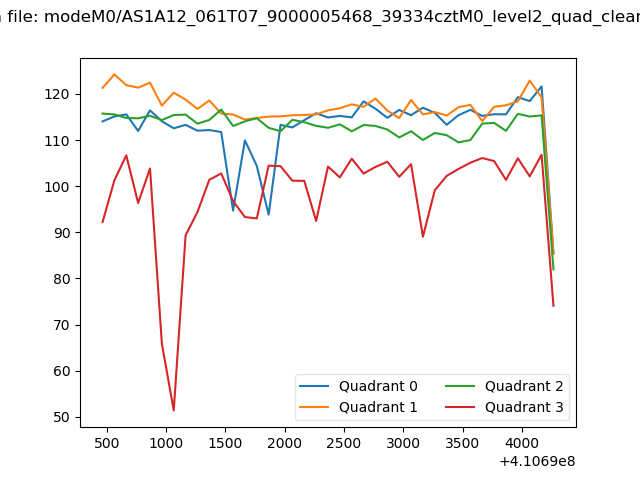 |
|
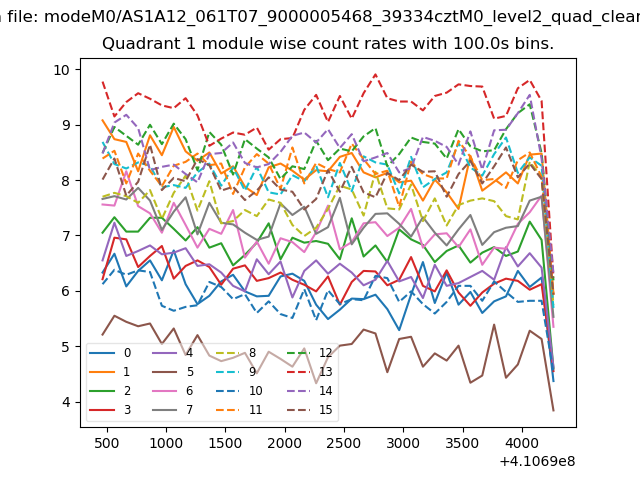
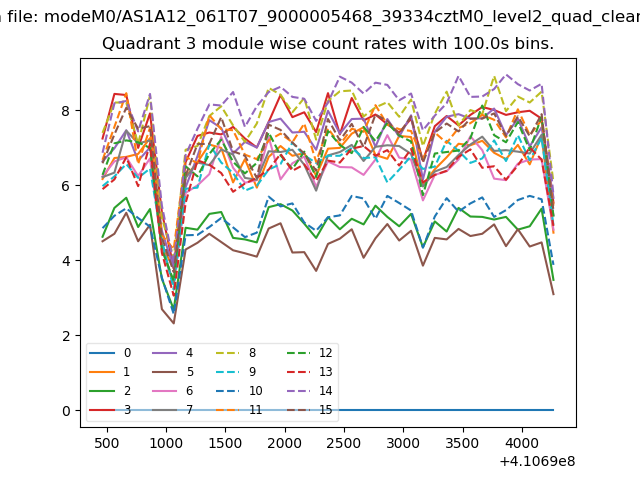
| Module-wise count rates for Quadrant A Data is divided into 100 sec bins |
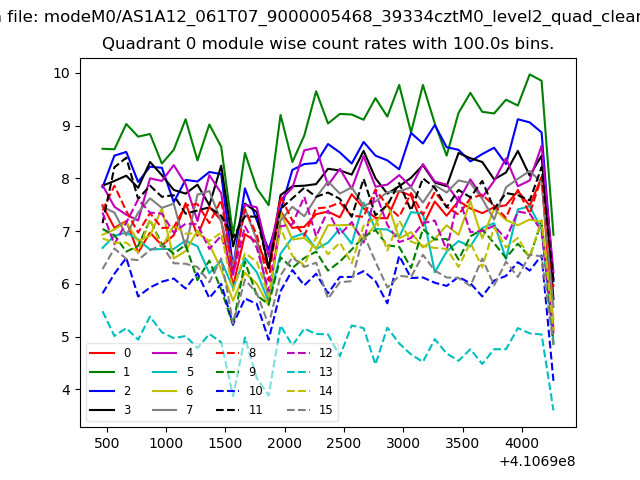 |
 |
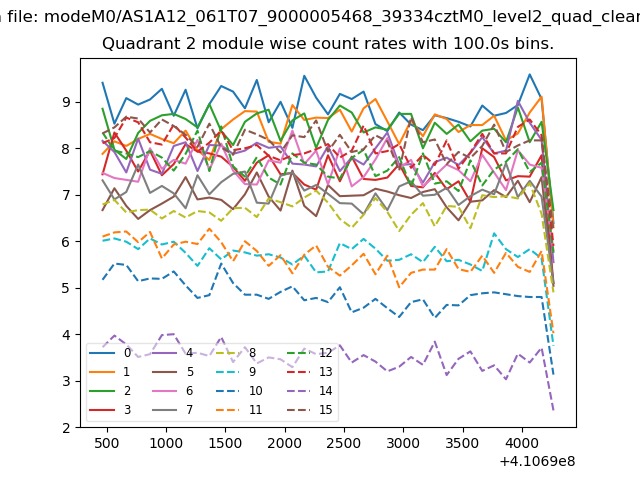
| Module-wise count rates for Quadrant B Data is divided into 100 sec bins |
 |
 |
| Module-wise count rates for Quadrant C Data is divided into 100 sec bins |
 |
 |
| Module-wise count rates for Quadrant D Data is divided into 100 sec bins |
 |
 |
| Parameter | Plot |
|---|---|
| CZT HV Monitor | 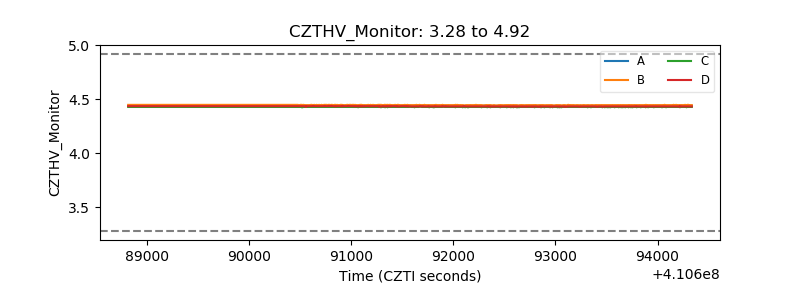 |
| D_VDD | 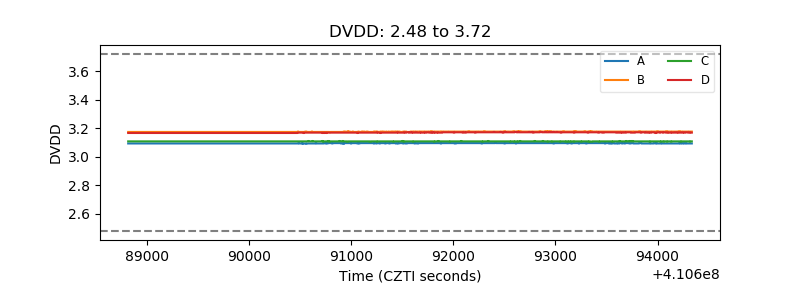 |
| Temperature 1 | 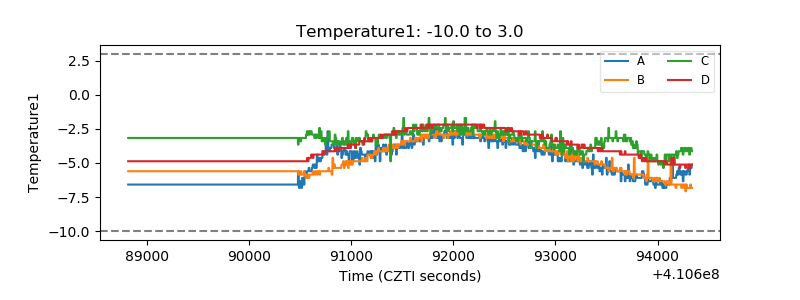 |
| Veto HV Monitor | 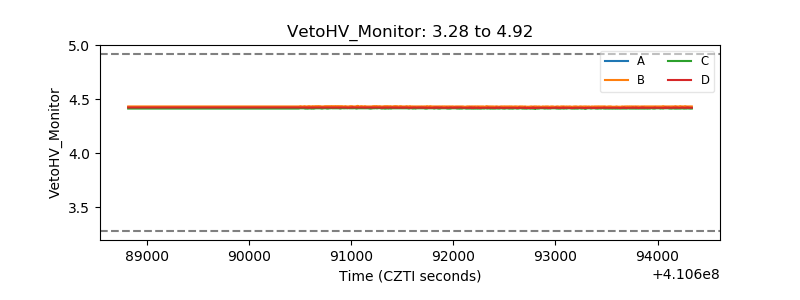 |
| Veto LLD | 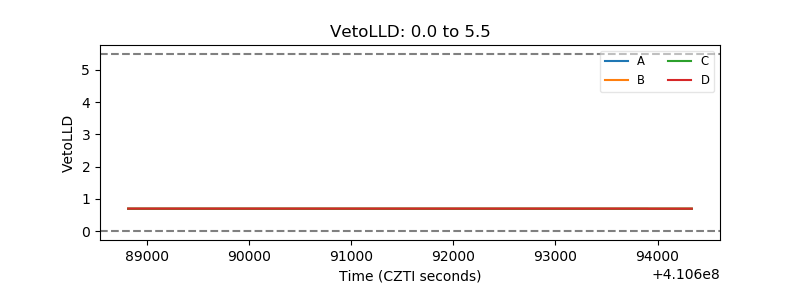 |
| Alpha Counter | 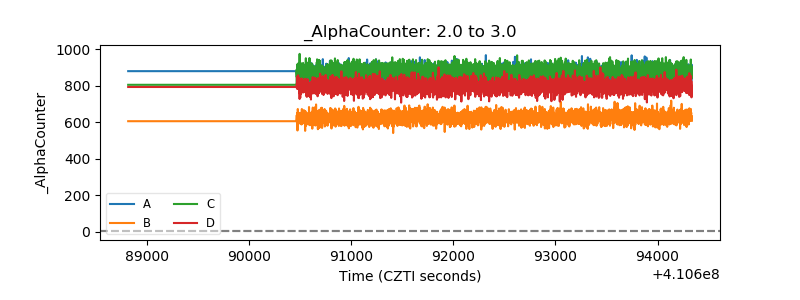 |
| _CPM_Rate | 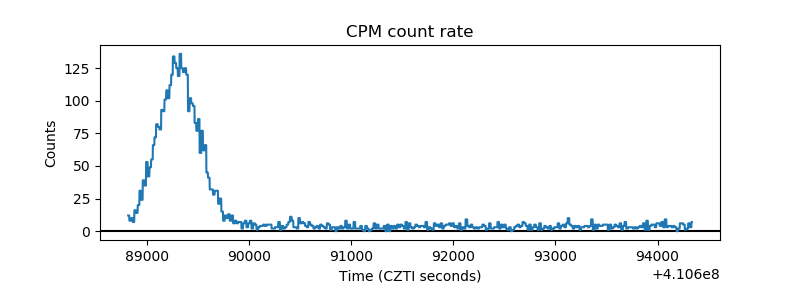 |
| CZT Counter | 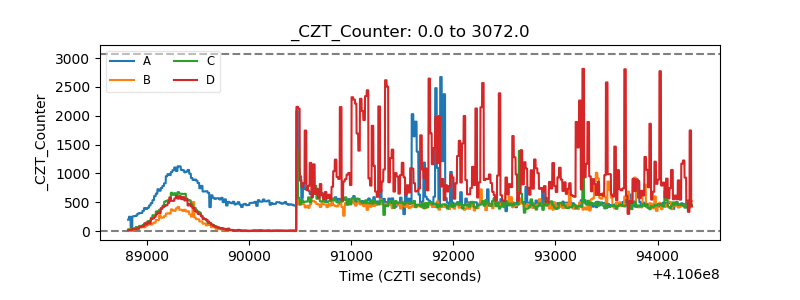 |
| +2.5 Volts monitor | 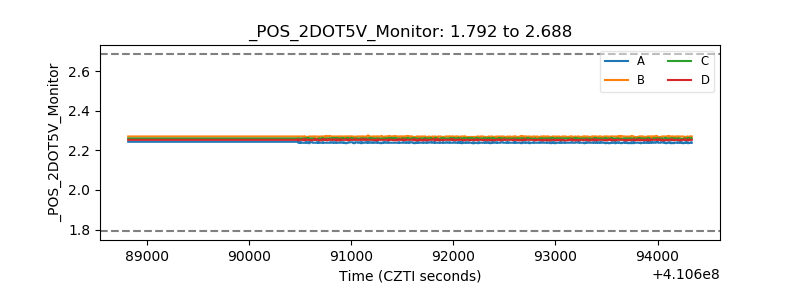 |
| +5 Volts monitor | 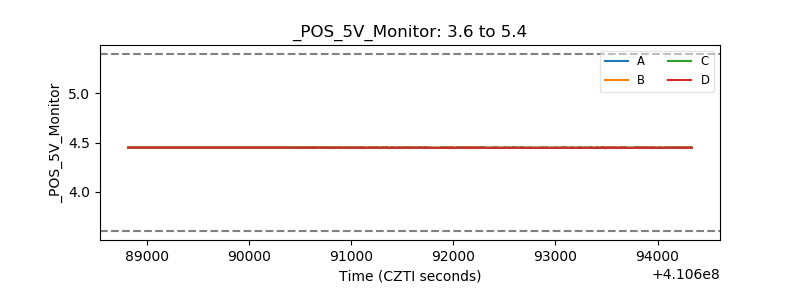 |
| _ROLL_ROT | 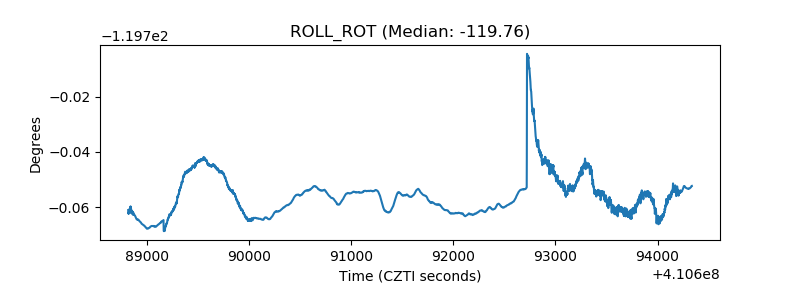 |
| _Roll_DEC | 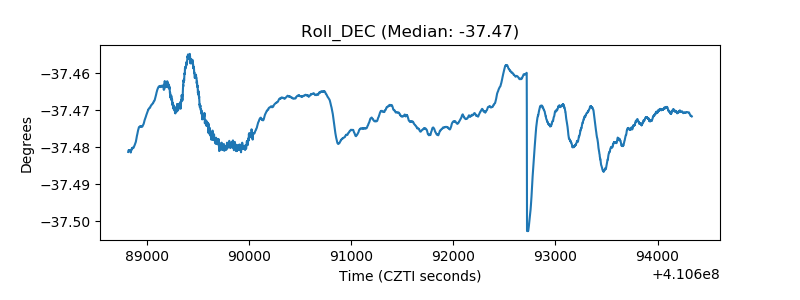 |
| _Roll_RA | 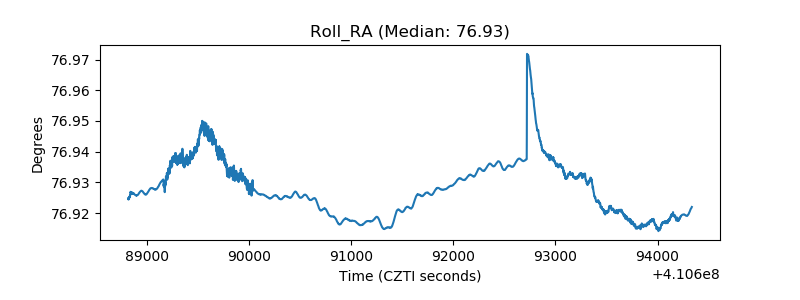 |
| Veto Counter | 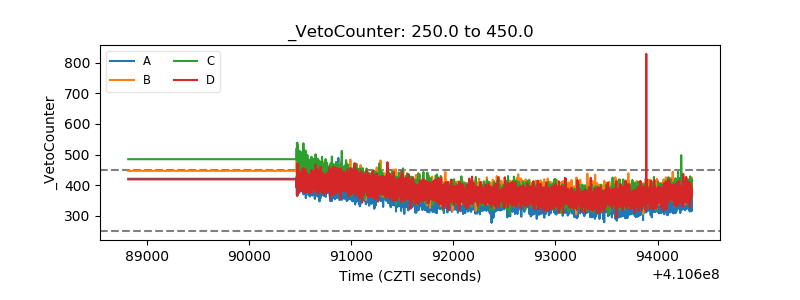 |