| Param | Original file | Final file |
|---|---|---|
| Filename | modeM0/AS1A12_018T01_9000005470_39336cztM0_level2.fits | modeM0/AS1A12_018T01_9000005470_39336cztM0_level2_quad_clean.evt |
| Size (bytes) | 471,922,560 | 96,088,320 |
| Size | 450.1 MB | 91.6 MB |
| Events in quadrant A | 3,119,581 | 664,525 |
| Events in quadrant B | 3,137,763 | 678,130 |
| Events in quadrant C | 2,888,353 | 638,295 |
| Events in quadrant D | 7,861,673 | 513,115 |
| Mode M9 | |||
|---|---|---|---|
| Quadrant | BADHDUFLAG | Total packets | Discarded packets |
| A | 0 | 17 | 0 |
| B | 0 | 17 | 0 |
| C | 0 | 17 | 0 |
| D | 0 | 18 | 0 |
| Mode SS | |||
|---|---|---|---|
| Quadrant | BADHDUFLAG | Total packets | Discarded packets |
| A | 0 | 120 | 0 |
| B | 0 | 120 | 0 |
| C | 0 | 120 | 0 |
| D | 0 | 120 | 0 |
| Mode M0 | |||
|---|---|---|---|
| Quadrant | BADHDUFLAG | Total packets | Discarded packets |
| A | 0 | 12843 | 3 |
| B | 0 | 13427 | 2 |
| C | 0 | 12284 | 2 |
| D | 0 | 27540 | 2 |
| Quadrant | Total seconds | Saturated seconds | Saturation percentage |
|---|---|---|---|
| A | 5944 | 12 | 0.201884% |
| B | 5944 | 66 | 1.110363% |
| C | 5944 | 4 | 0.067295% |
| D | 5944 | 1145 | 19.263122% |
Noise dominated data is calculated using 1-second bins in cleaned event files. If a bin has >2000 counts, and if more than 50% of those come from <1% of pixels, then it is considered to be noise-dominated and hence unusable.
| Quadrant | # 1 sec bins | Bins with >0 counts | Bins with >2000 counts | High rate bins dominated by noise | Noise dominated (total time) | Noise dominated (detector-on time) | Marked lightcurve |
|---|---|---|---|---|---|---|---|
| A | 7226 | 5945 | 12 | 12 | 0.17% | 0.20% | 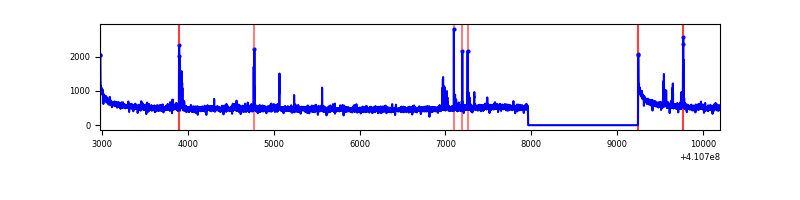 |
| B | 7226 | 5945 | 36 | 36 | 0.50% | 0.61% | 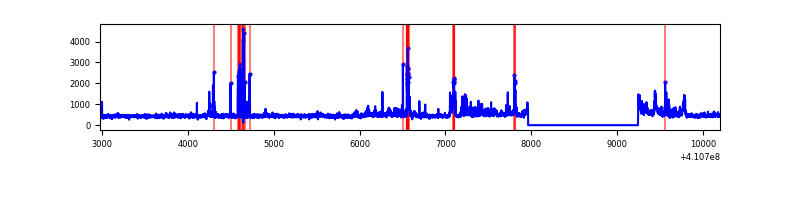 |
| C | 7226 | 5945 | 0 | 0 | 0.00% | 0.00% | 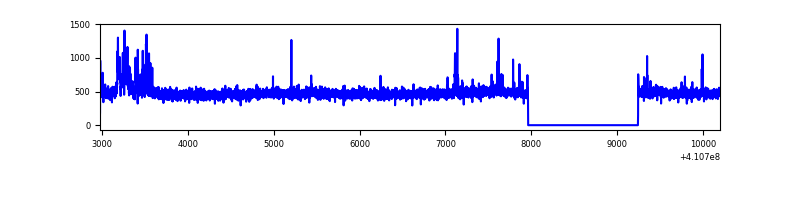 |
| D | 7226 | 5945 | 988 | 988 | 13.67% | 16.62% | 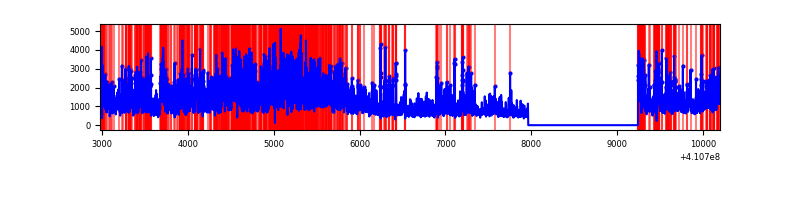 |
Top three noisy pixels from each quadrant. If the there are fewer than three noisy pixels in the level2.evt file, extra rows are filled as -1
| Pixel properties | Quadrant properties | ||||||
|---|---|---|---|---|---|---|---|
| Quadrant | DetID | PixID | Counts | Sigma | Mean | Median | Sigma |
| A | 10 | 83 | 457569 | 3434.55 | 655 | 642 | 133.0 |
| A | 13 | 248 | 86149 | 642.73 | 655 | 642 | 133.0 |
| A | 2 | 79 | 24153 | 176.72 | 655 | 642 | 133.0 |
| B | 5 | 184 | 481105 | 3808.37 | 649 | 631 | 126.2 |
| B | 5 | 172 | 89431 | 703.85 | 649 | 631 | 126.2 |
| B | 12 | 111 | 15874 | 120.82 | 649 | 631 | 126.2 |
| C | 15 | 214 | 269046 | 1799.75 | 638 | 641 | 149.1 |
| C | 9 | 187 | 93889 | 625.26 | 638 | 641 | 149.1 |
| C | 14 | 254 | 13435 | 85.79 | 638 | 641 | 149.1 |
| D | 12 | 235 | 4694467 | 31742.23 | 598 | 580 | 147.9 |
| D | 13 | 249 | 259707 | 1752.34 | 598 | 580 | 147.9 |
| D | 12 | 227 | 232510 | 1568.42 | 598 | 580 | 147.9 |
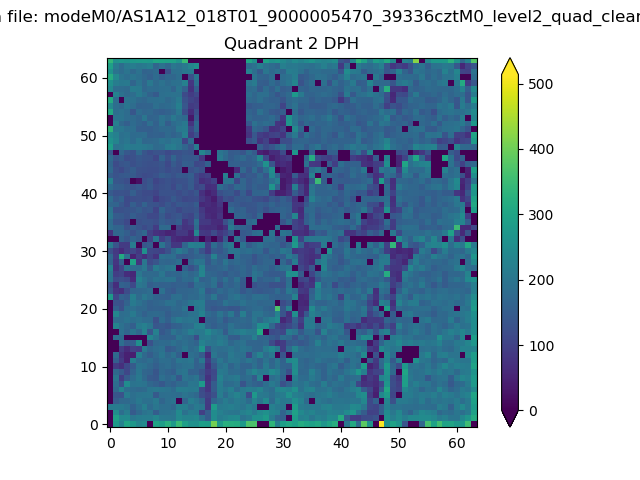
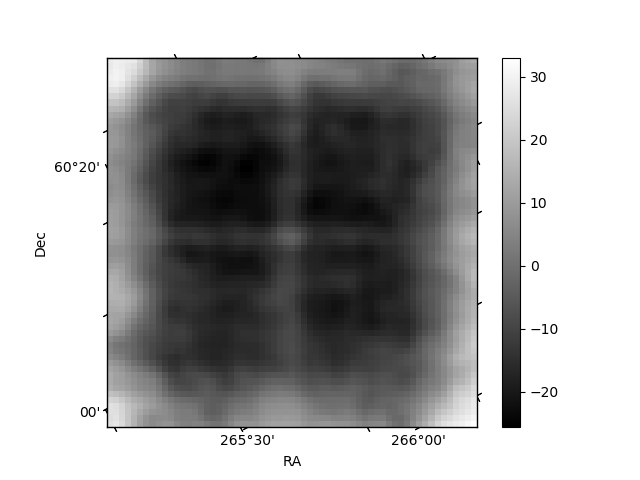
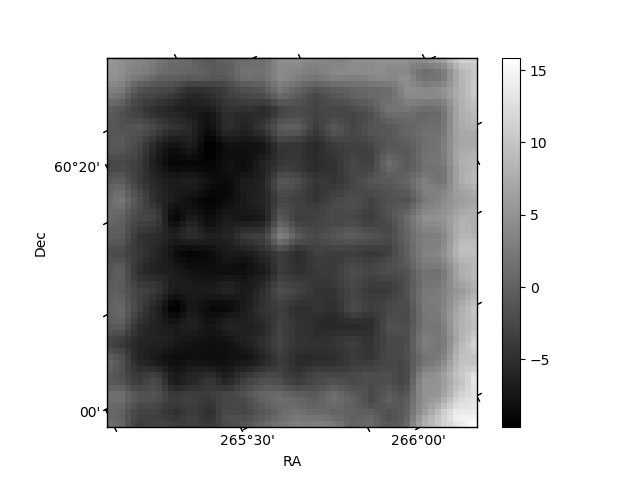
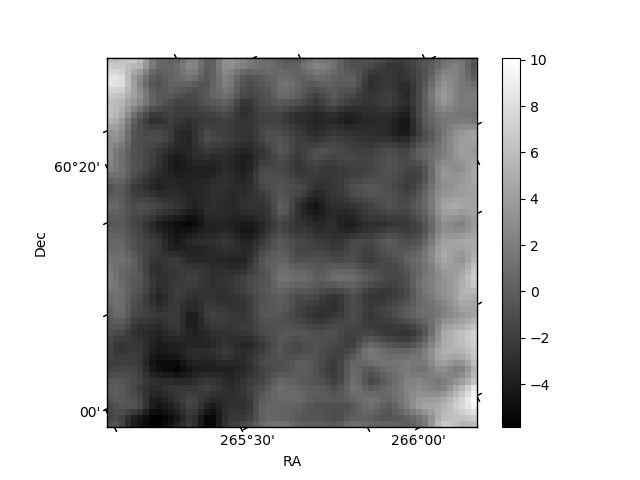
Histogram calculated using DETX and DETY for each event in the final _common_clean file
| Quadrant A | 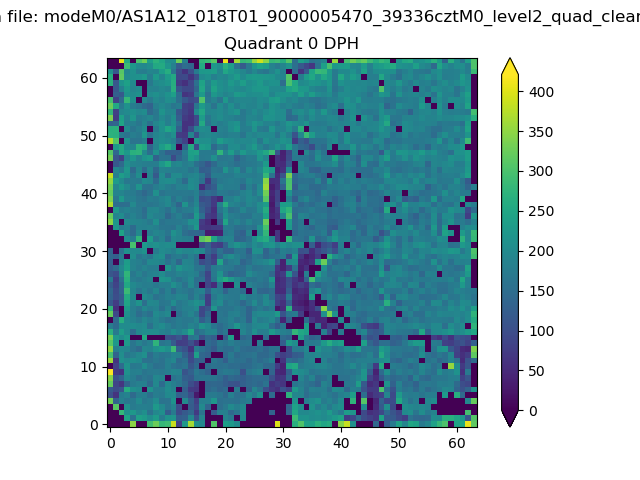 |
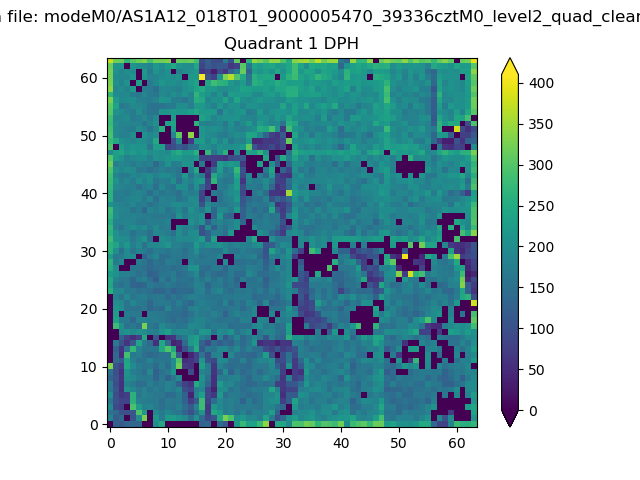 |
Quadrant B |
|---|---|---|---|
| Quadrant D | 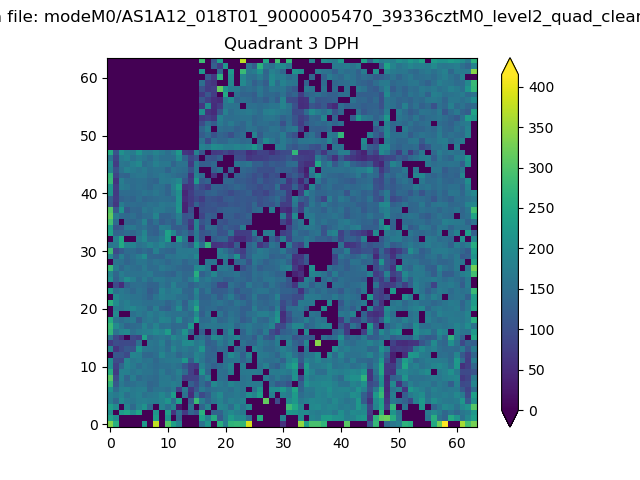 |
 |
Quadrant C |
| Plot type | Count rate plots | Images |
|---|---|---|
| Comparison with Poisson distribution Blue bars denote a histogram of data divided into 1 sec bins. Red curve is a Poisson curve with rate = median count rate of data. |
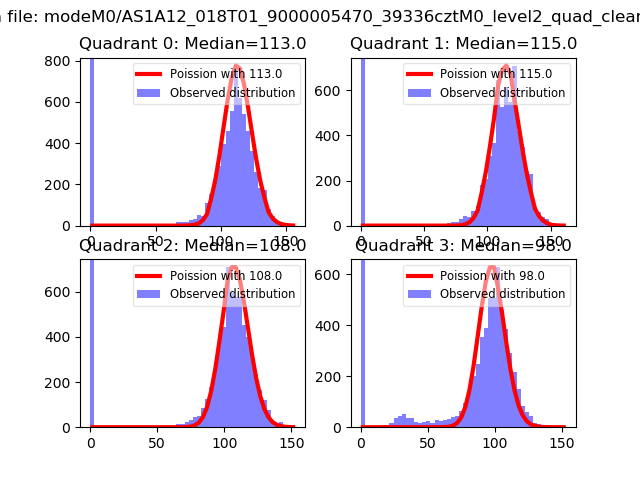 |
 |
| Quadrant-wise count rates Data is divided into 100 sec bins |
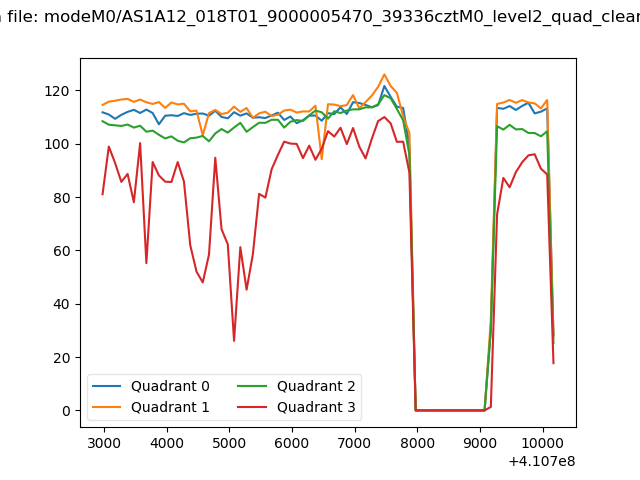 |
|
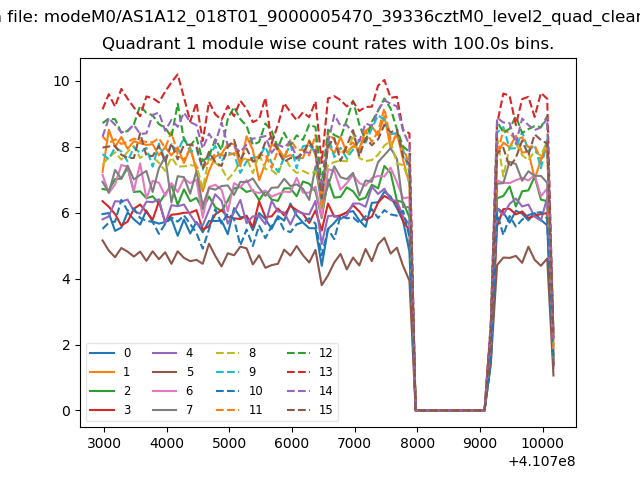
| Module-wise count rates for Quadrant A Data is divided into 100 sec bins |
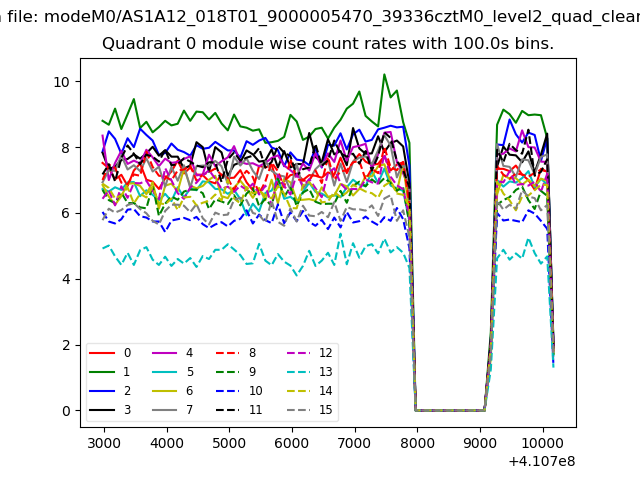 |
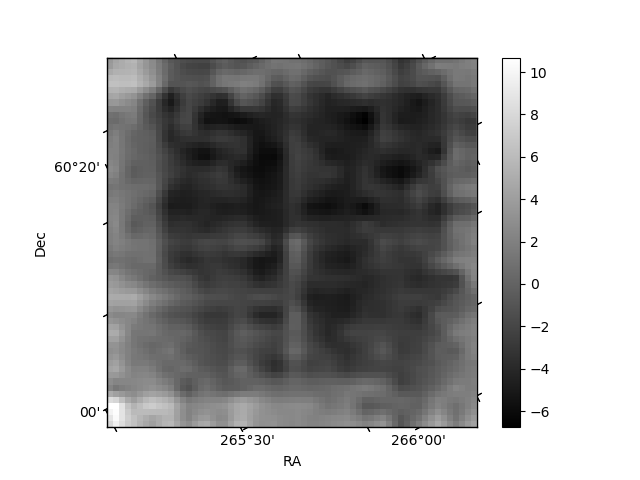 |
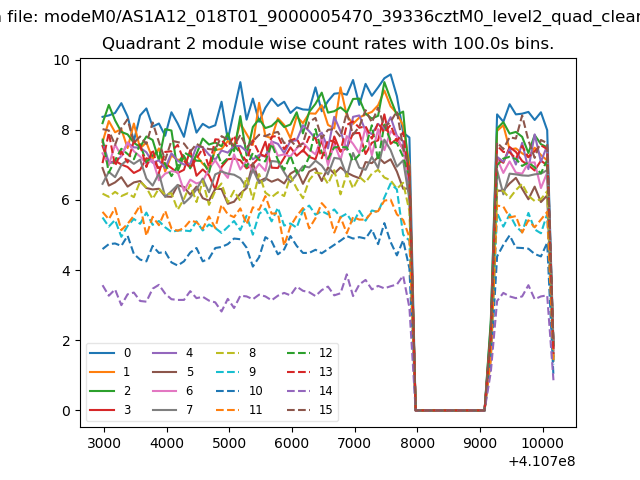
| Module-wise count rates for Quadrant B Data is divided into 100 sec bins |
 |
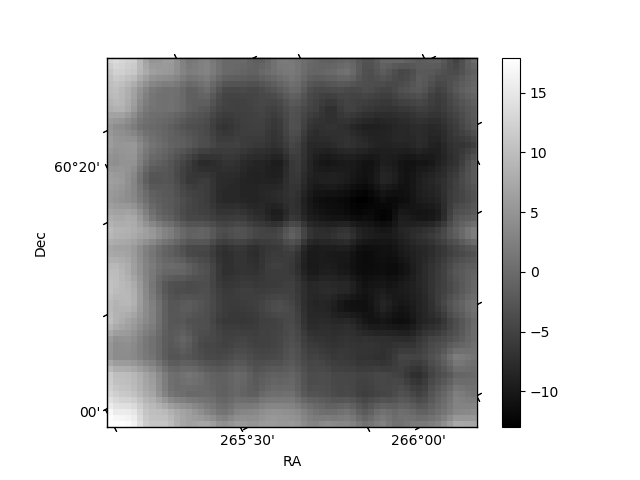 |
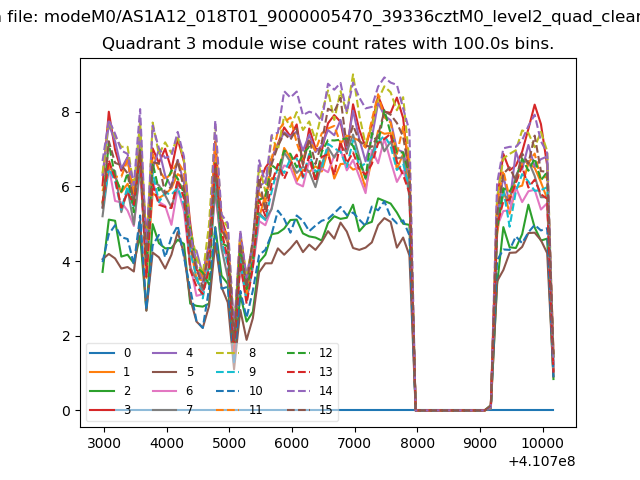
| Module-wise count rates for Quadrant C Data is divided into 100 sec bins |
 |
 |
| Module-wise count rates for Quadrant D Data is divided into 100 sec bins |
 |
 |
| Parameter | Plot |
|---|---|
| CZT HV Monitor | 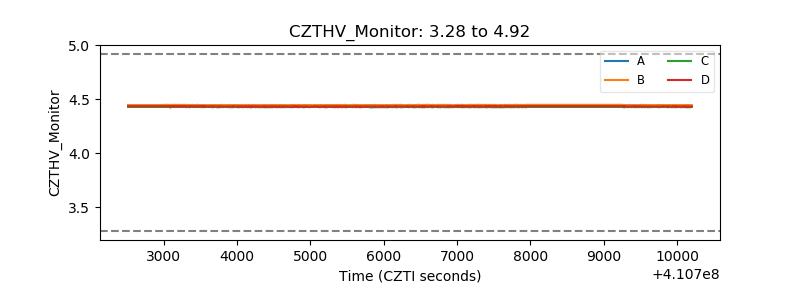 |
| D_VDD | 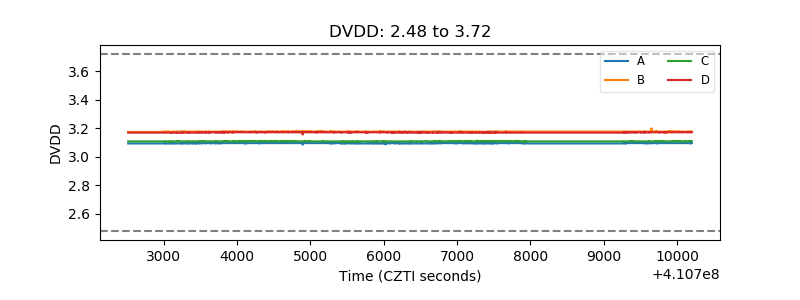 |
| Temperature 1 | 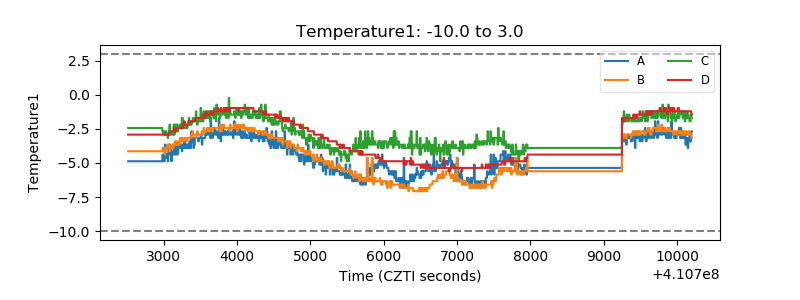 |
| Veto HV Monitor |  |
| Veto LLD | 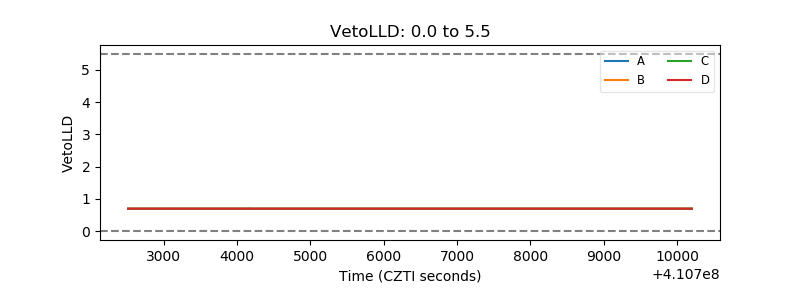 |
| Alpha Counter | 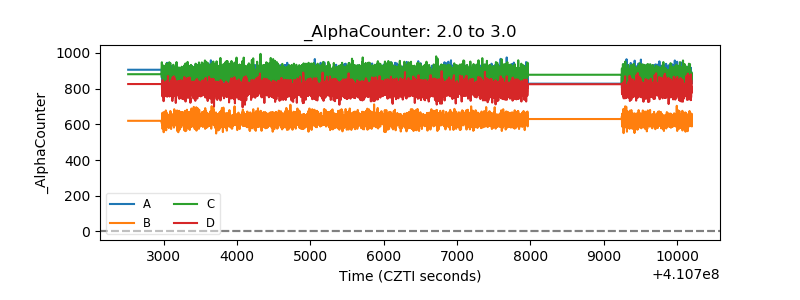 |
| _CPM_Rate |  |
| CZT Counter | 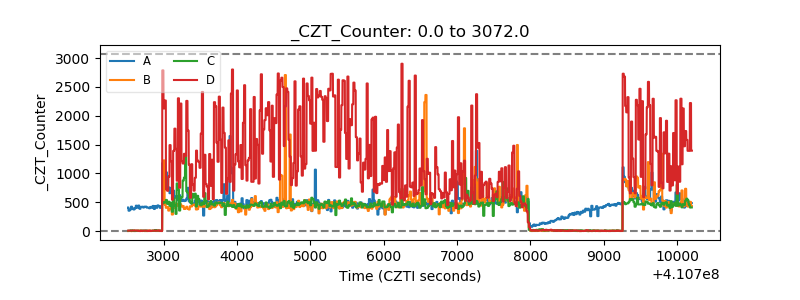 |
| +2.5 Volts monitor | 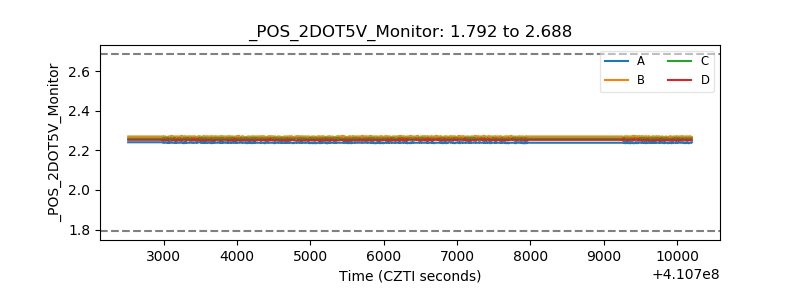 |
| +5 Volts monitor | 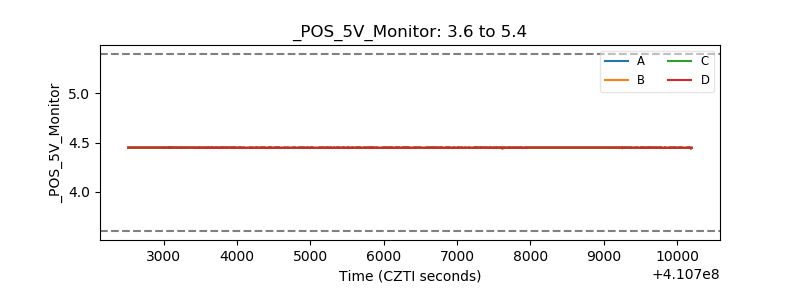 |
| _ROLL_ROT | 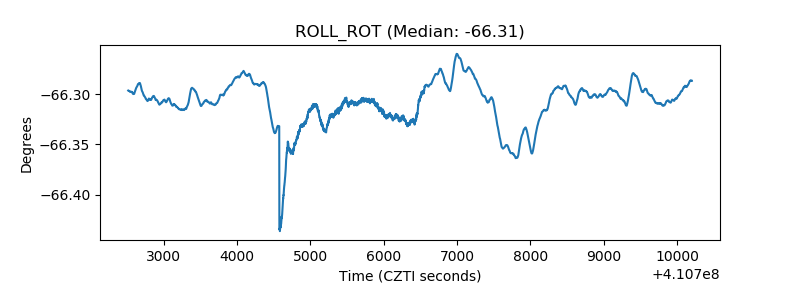 |
| _Roll_DEC | 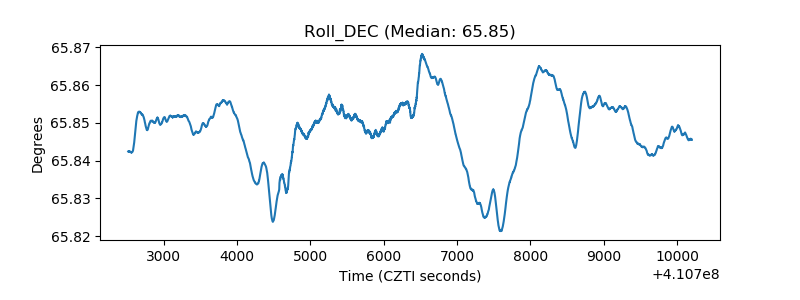 |
| _Roll_RA | 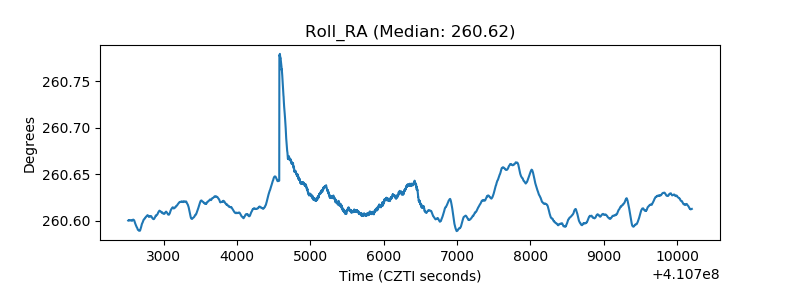 |
| Veto Counter | 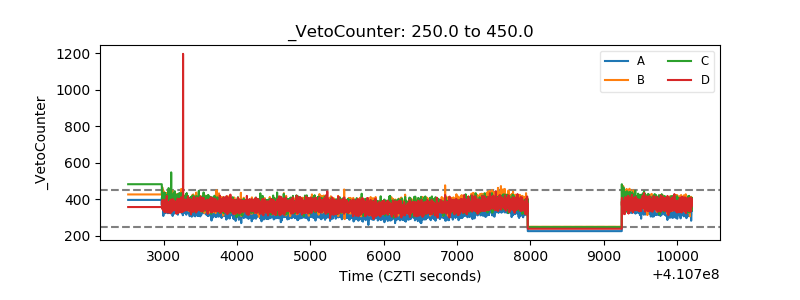 |