| Param | Original file | Final file |
|---|---|---|
| Filename | modeM0/AS1A12_018T01_9000005470_39339cztM0_level2.fits | modeM0/AS1A12_018T01_9000005470_39339cztM0_level2_quad_clean.evt |
| Size (bytes) | 1,184,647,680 | 251,475,840 |
| Size | 1.1 GB | 239.8 MB |
| Events in quadrant A | 7,911,147 | 1,724,655 |
| Events in quadrant B | 7,040,221 | 1,762,774 |
| Events in quadrant C | 7,772,286 | 1,665,018 |
| Events in quadrant D | 19,922,353 | 1,385,589 |
| Mode M9 | |||
|---|---|---|---|
| Quadrant | BADHDUFLAG | Total packets | Discarded packets |
| A | 0 | 43 | 0 |
| B | 0 | 43 | 0 |
| C | 0 | 43 | 0 |
| D | 0 | 43 | 0 |
| Mode SS | |||
|---|---|---|---|
| Quadrant | BADHDUFLAG | Total packets | Discarded packets |
| A | 0 | 316 | 0 |
| B | 0 | 316 | 0 |
| C | 0 | 316 | 0 |
| D | 0 | 316 | 0 |
| Mode M0 | |||
|---|---|---|---|
| Quadrant | BADHDUFLAG | Total packets | Discarded packets |
| A | 0 | 33286 | 4 |
| B | 0 | 32066 | 3 |
| C | 0 | 32738 | 3 |
| D | 0 | 70219 | 3 |
| Quadrant | Total seconds | Saturated seconds | Saturation percentage |
|---|---|---|---|
| A | 15600 | 39 | 0.250000% |
| B | 15600 | 32 | 0.205128% |
| C | 15600 | 34 | 0.217949% |
| D | 15600 | 2291 | 14.685897% |
Noise dominated data is calculated using 1-second bins in cleaned event files. If a bin has >2000 counts, and if more than 50% of those come from <1% of pixels, then it is considered to be noise-dominated and hence unusable.
| Quadrant | # 1 sec bins | Bins with >0 counts | Bins with >2000 counts | High rate bins dominated by noise | Noise dominated (total time) | Noise dominated (detector-on time) | Marked lightcurve |
|---|---|---|---|---|---|---|---|
| A | 19749 | 15603 | 19 | 19 | 0.10% | 0.12% | 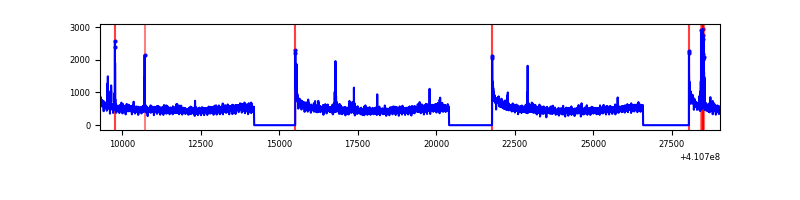 |
| B | 19749 | 15603 | 6 | 6 | 0.03% | 0.04% | 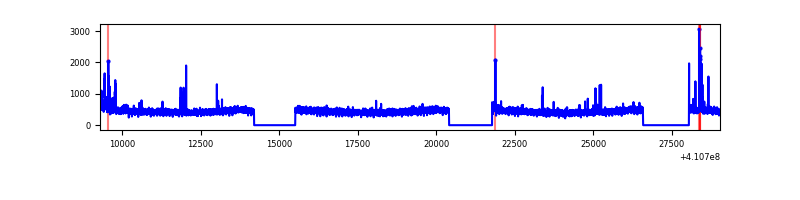 |
| C | 19749 | 15603 | 31 | 31 | 0.16% | 0.20% | 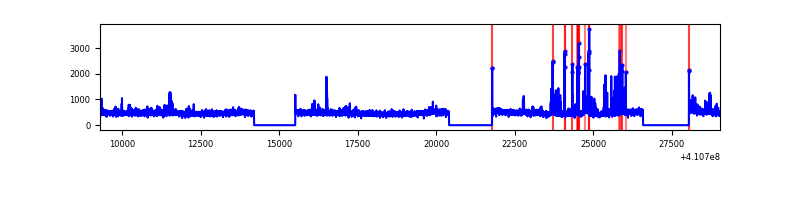 |
| D | 19749 | 15603 | 2073 | 2073 | 10.50% | 13.29% | 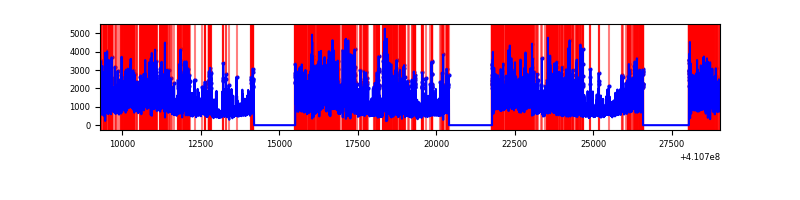 |
Top three noisy pixels from each quadrant. If the there are fewer than three noisy pixels in the level2.evt file, extra rows are filled as -1
| Pixel properties | Quadrant properties | ||||||
|---|---|---|---|---|---|---|---|
| Quadrant | DetID | PixID | Counts | Sigma | Mean | Median | Sigma |
| A | 10 | 83 | 1067522 | 3094.17 | 1714 | 1680 | 344.5 |
| A | 13 | 248 | 158937 | 456.52 | 1714 | 1680 | 344.5 |
| A | 15 | 223 | 28761 | 78.62 | 1714 | 1680 | 344.5 |
| B | 5 | 184 | 254941 | 778.26 | 1706 | 1658 | 325.4 |
| B | 12 | 111 | 42287 | 124.84 | 1706 | 1658 | 325.4 |
| B | 11 | 111 | 38974 | 114.66 | 1706 | 1658 | 325.4 |
| C | 15 | 214 | 694915 | 1777.86 | 1676 | 1685 | 389.9 |
| C | 14 | 254 | 321951 | 821.36 | 1676 | 1685 | 389.9 |
| C | 9 | 187 | 104268 | 263.08 | 1676 | 1685 | 389.9 |
| D | 12 | 235 | 11042265 | 28248.18 | 1594 | 1545 | 390.8 |
| D | 2 | 249 | 749281 | 1913.12 | 1594 | 1545 | 390.8 |
| D | 12 | 227 | 704758 | 1799.2 | 1594 | 1545 | 390.8 |
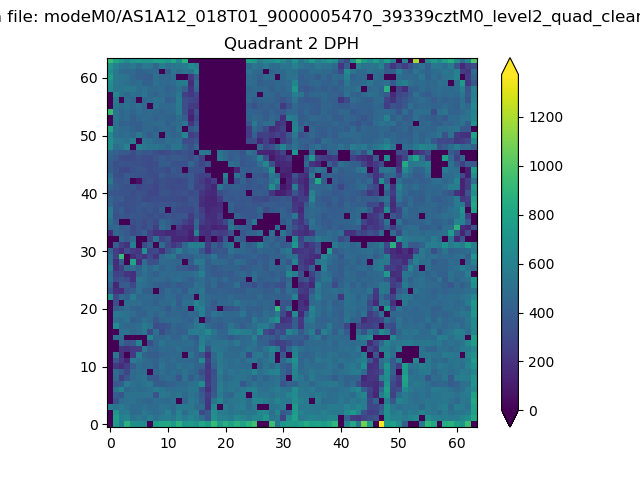
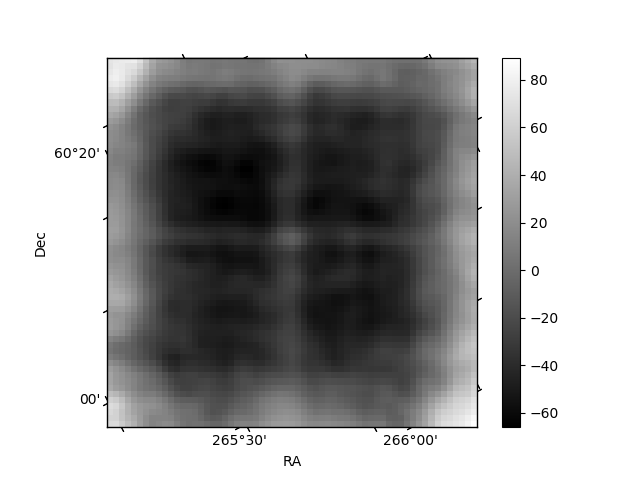
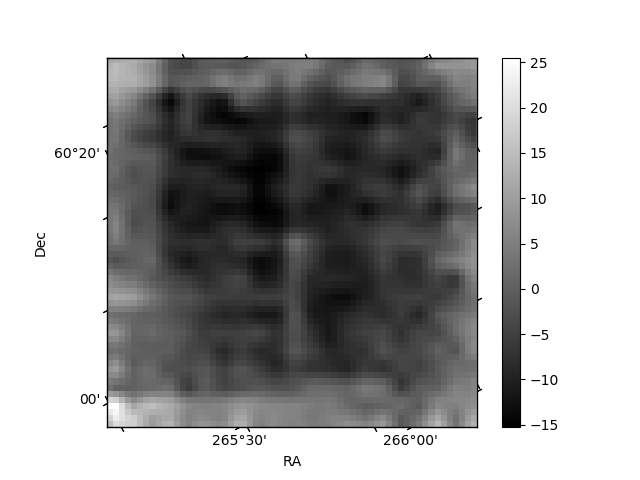
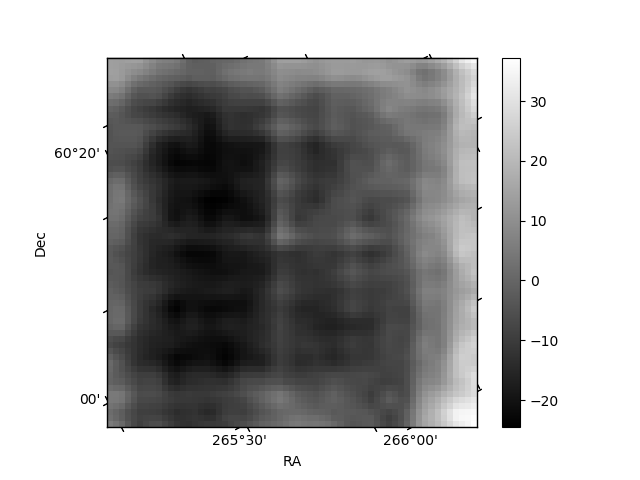
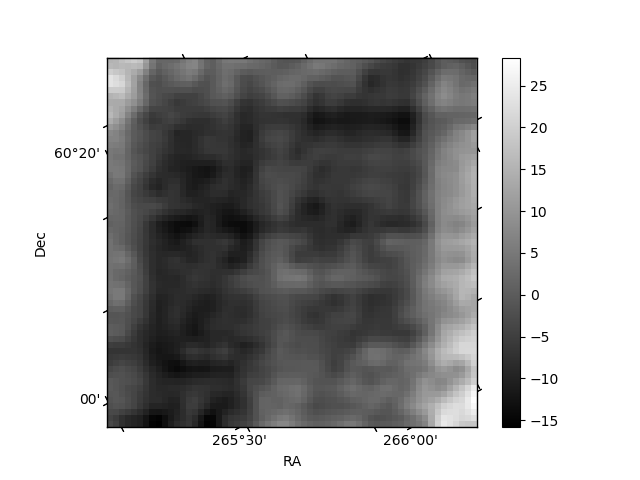
Histogram calculated using DETX and DETY for each event in the final _common_clean file
| Quadrant A | 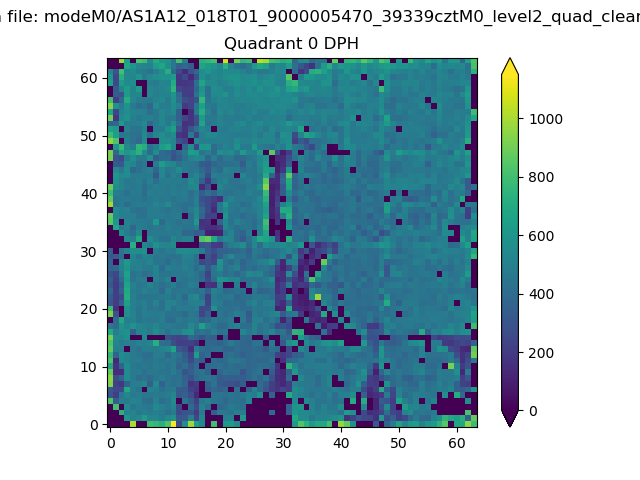 |
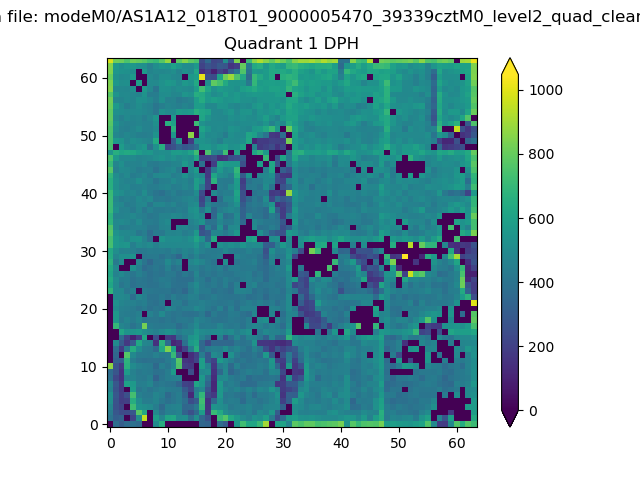 |
Quadrant B |
|---|---|---|---|
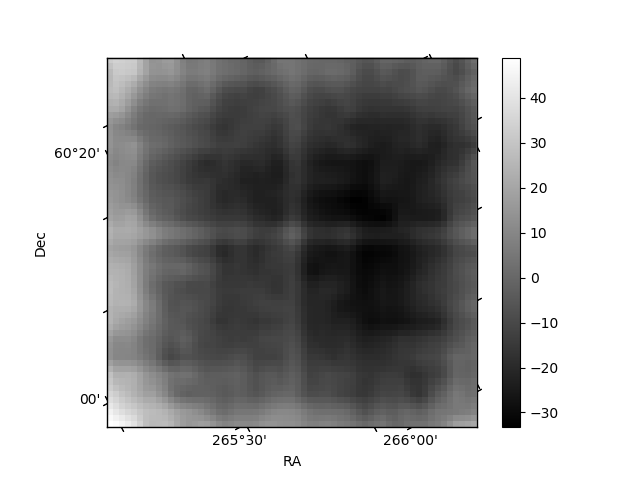
| Quadrant D | 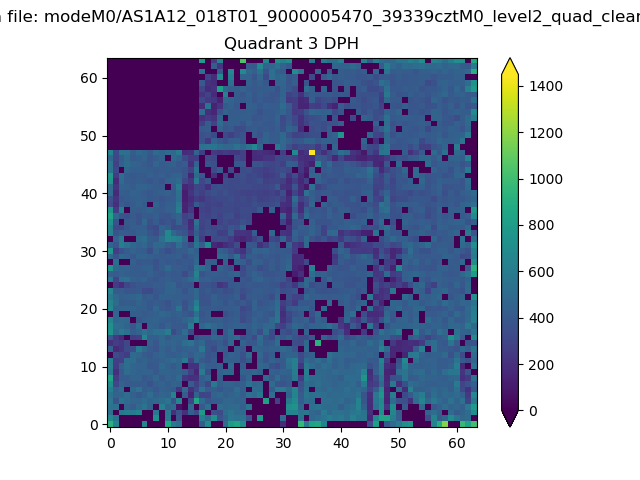 |
 |
Quadrant C |
| Plot type | Count rate plots | Images |
|---|---|---|
| Comparison with Poisson distribution Blue bars denote a histogram of data divided into 1 sec bins. Red curve is a Poisson curve with rate = median count rate of data. |
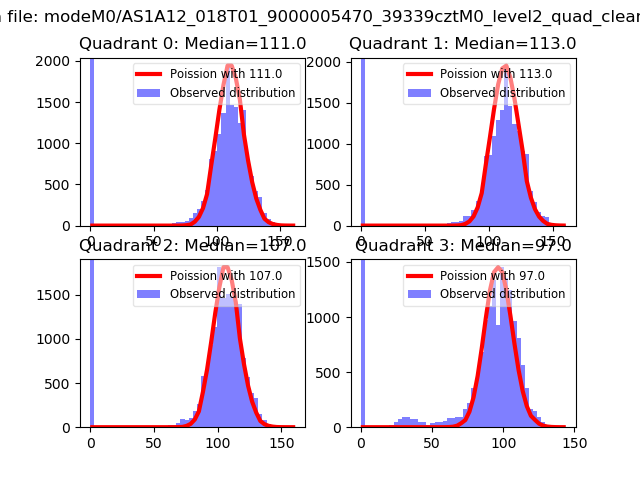 |
 |
| Quadrant-wise count rates Data is divided into 100 sec bins |
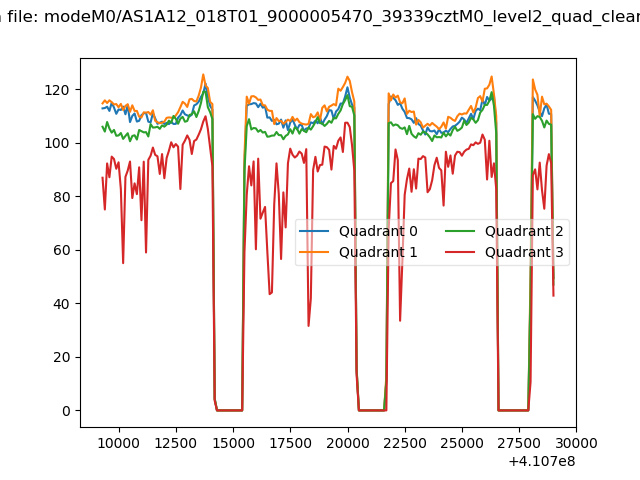 |
|
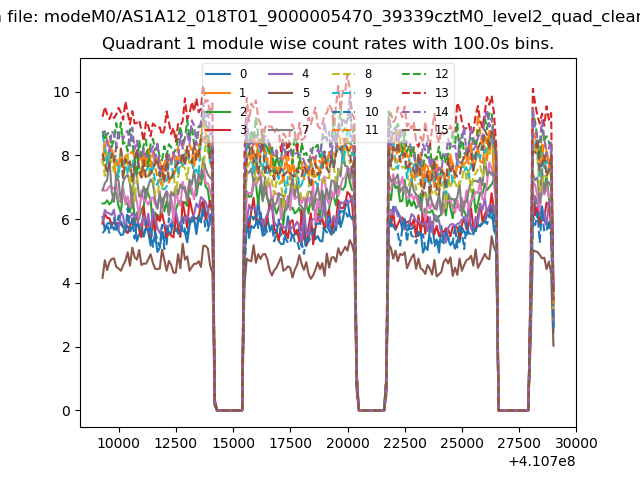
| Module-wise count rates for Quadrant A Data is divided into 100 sec bins |
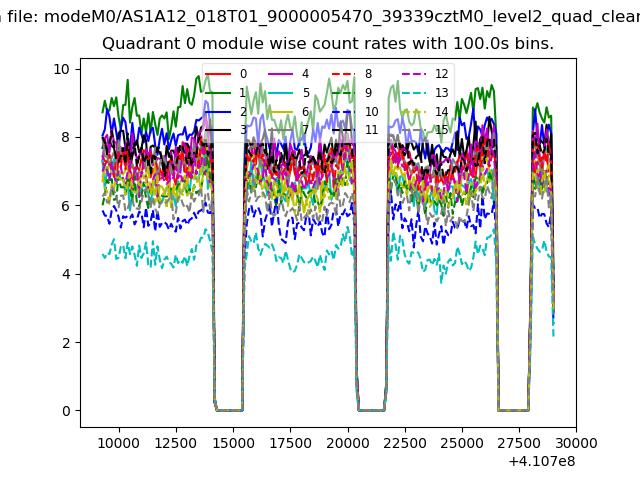 |
 |
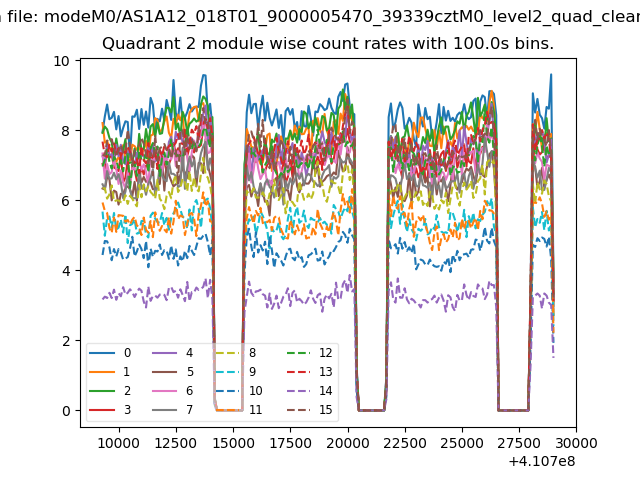
| Module-wise count rates for Quadrant B Data is divided into 100 sec bins |
 |
 |
| Module-wise count rates for Quadrant C Data is divided into 100 sec bins |
 |
 |
| Module-wise count rates for Quadrant D Data is divided into 100 sec bins |
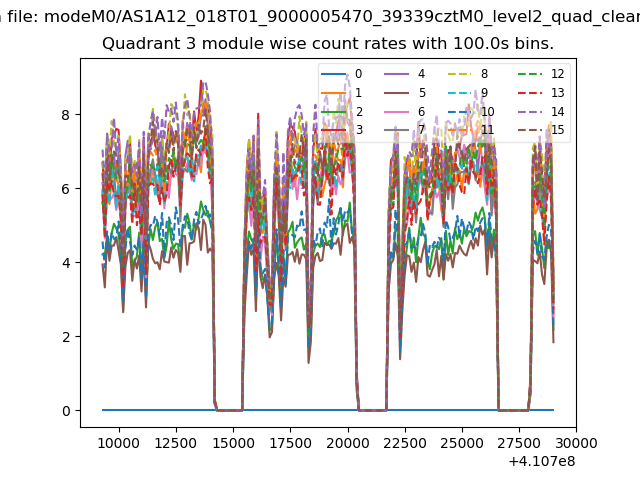 |
 |
| Parameter | Plot |
|---|---|
| CZT HV Monitor | 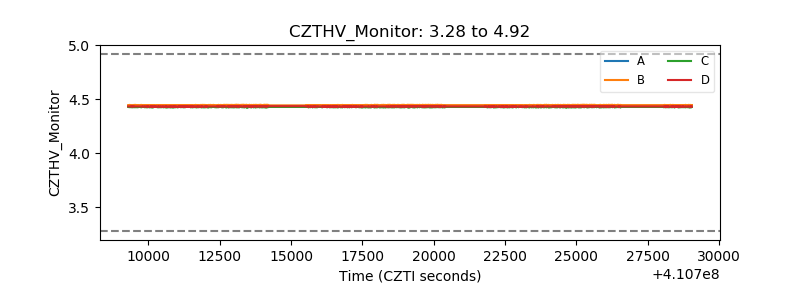 |
| D_VDD | 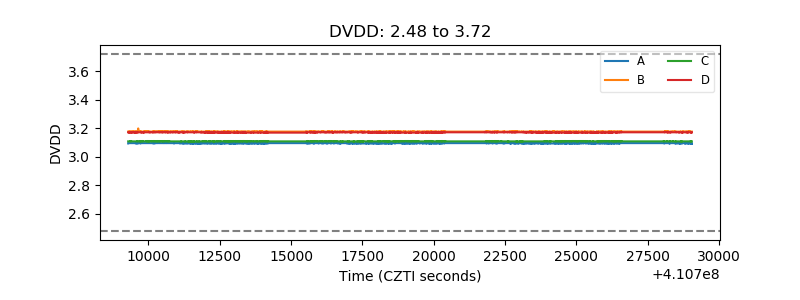 |
| Temperature 1 | 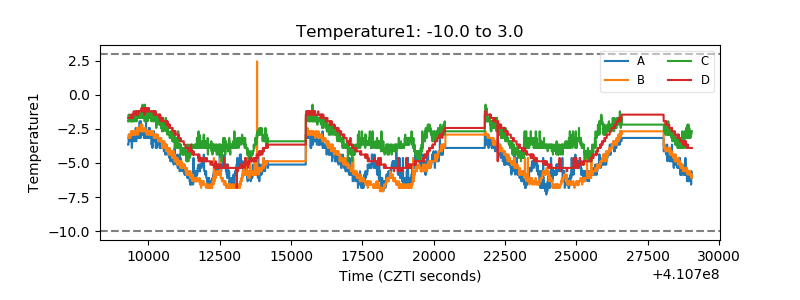 |
| Veto HV Monitor | 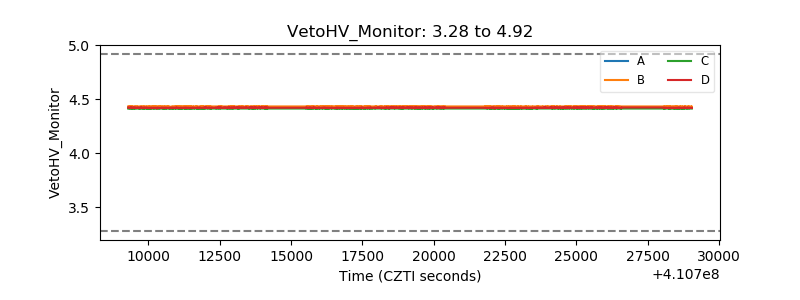 |
| Veto LLD | 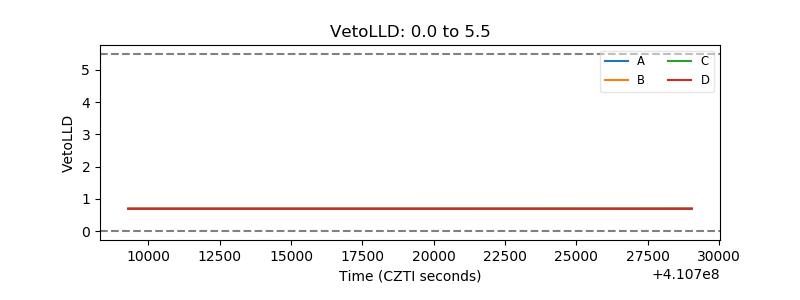 |
| Alpha Counter |  |
| _CPM_Rate | 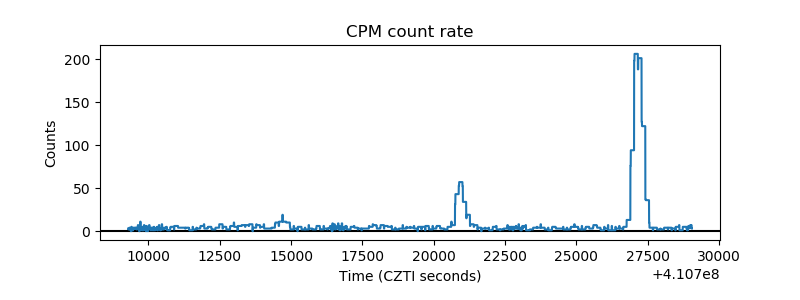 |
| CZT Counter | 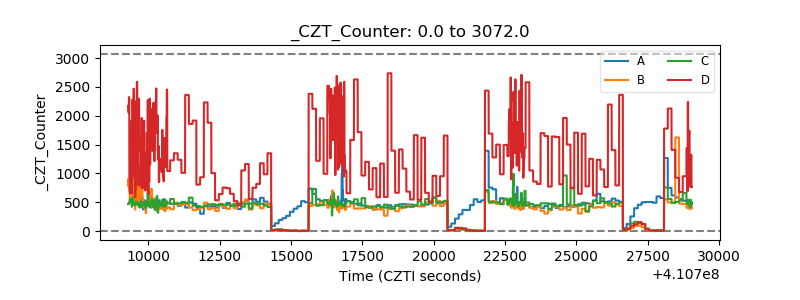 |
| +2.5 Volts monitor | 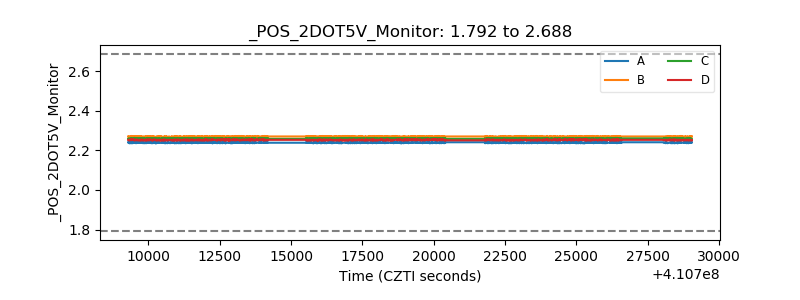 |
| +5 Volts monitor | 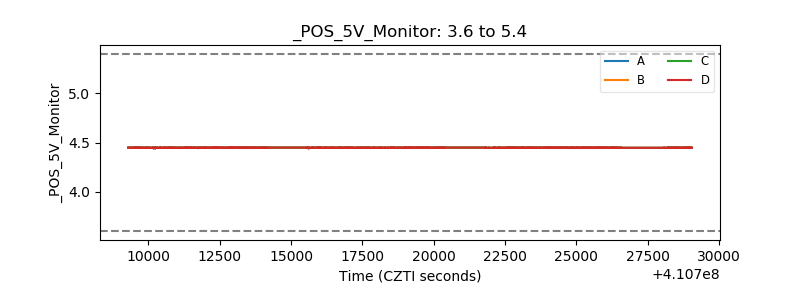 |
| _ROLL_ROT | 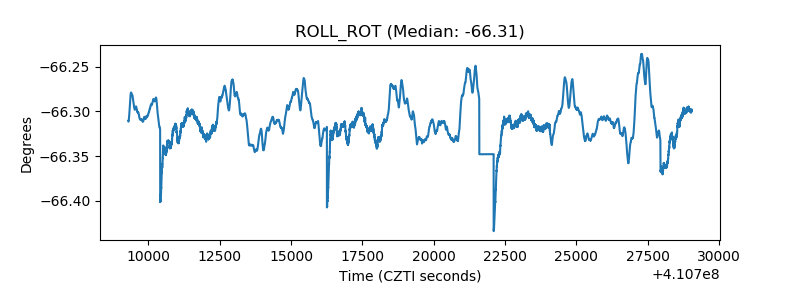 |
| _Roll_DEC | 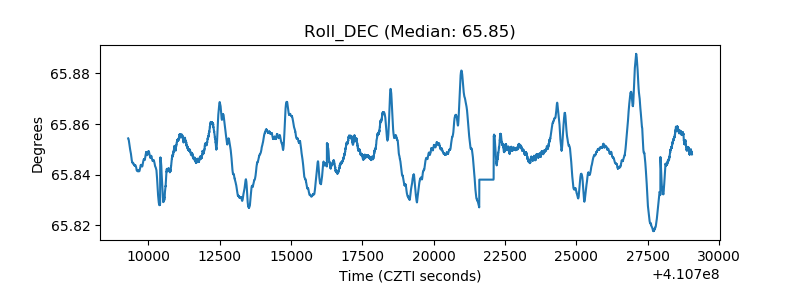 |
| _Roll_RA | 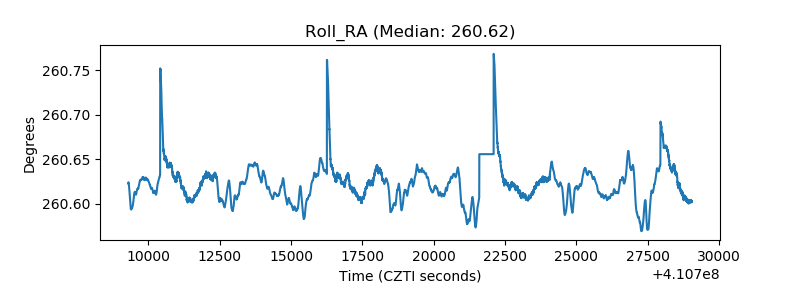 |
| Veto Counter | 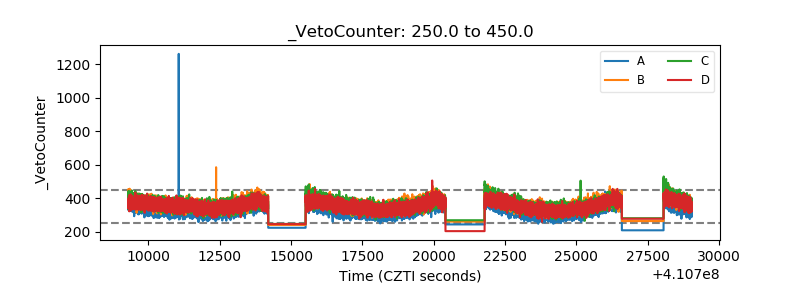 |