| Param | Original file | Final file |
|---|---|---|
| Filename | modeM0/AS1A12_018T01_9000005470_39340cztM0_level2.fits | modeM0/AS1A12_018T01_9000005470_39340cztM0_level2_quad_clean.evt |
| Size (bytes) | 459,797,760 | 92,016,000 |
| Size | 438.5 MB | 87.8 MB |
| Events in quadrant A | 2,943,767 | 627,512 |
| Events in quadrant B | 2,935,986 | 636,013 |
| Events in quadrant C | 3,183,014 | 610,445 |
| Events in quadrant D | 7,515,986 | 514,836 |
| Mode M9 | |||
|---|---|---|---|
| Quadrant | BADHDUFLAG | Total packets | Discarded packets |
| A | 0 | 17 | 0 |
| B | 0 | 17 | 0 |
| C | 0 | 17 | 0 |
| D | 0 | 18 | 0 |
| Mode SS | |||
|---|---|---|---|
| Quadrant | BADHDUFLAG | Total packets | Discarded packets |
| A | 0 | 114 | 0 |
| B | 0 | 114 | 0 |
| C | 0 | 114 | 0 |
| D | 0 | 114 | 0 |
| Mode M0 | |||
|---|---|---|---|
| Quadrant | BADHDUFLAG | Total packets | Discarded packets |
| A | 0 | 12438 | 3 |
| B | 0 | 12662 | 2 |
| C | 0 | 13068 | 2 |
| D | 0 | 26339 | 2 |
| Quadrant | Total seconds | Saturated seconds | Saturation percentage |
|---|---|---|---|
| A | 5686 | 26 | 0.457263% |
| B | 5686 | 129 | 2.268730% |
| C | 5686 | 92 | 1.618009% |
| D | 5686 | 856 | 15.054520% |
Noise dominated data is calculated using 1-second bins in cleaned event files. If a bin has >2000 counts, and if more than 50% of those come from <1% of pixels, then it is considered to be noise-dominated and hence unusable.
| Quadrant | # 1 sec bins | Bins with >0 counts | Bins with >2000 counts | High rate bins dominated by noise | Noise dominated (total time) | Noise dominated (detector-on time) | Marked lightcurve |
|---|---|---|---|---|---|---|---|
| A | 7298 | 5687 | 14 | 14 | 0.19% | 0.25% | 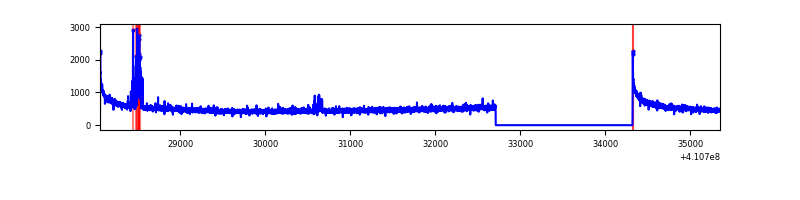 |
| B | 7298 | 5687 | 82 | 82 | 1.12% | 1.44% | 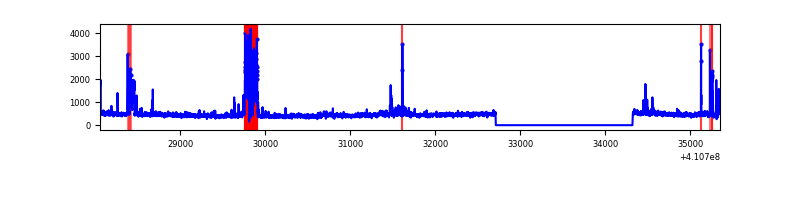 |
| C | 7298 | 5687 | 84 | 84 | 1.15% | 1.48% | 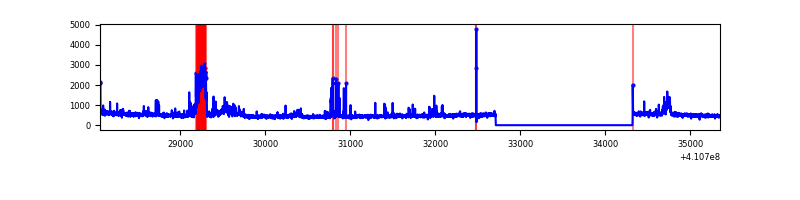 |
| D | 7298 | 5687 | 762 | 762 | 10.44% | 13.40% | 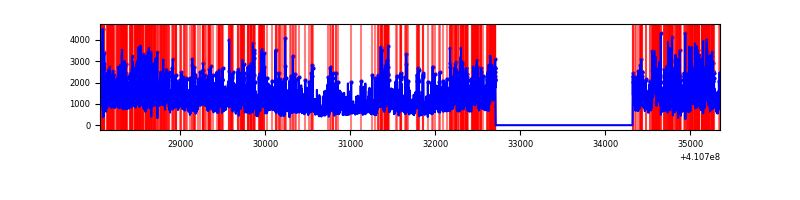 |
Top three noisy pixels from each quadrant. If the there are fewer than three noisy pixels in the level2.evt file, extra rows are filled as -1
| Pixel properties | Quadrant properties | ||||||
|---|---|---|---|---|---|---|---|
| Quadrant | DetID | PixID | Counts | Sigma | Mean | Median | Sigma |
| A | 10 | 83 | 442027 | 3475.45 | 621 | 608 | 127.0 |
| A | 13 | 248 | 76922 | 600.85 | 621 | 608 | 127.0 |
| A | 5 | 98 | 18097 | 137.7 | 621 | 608 | 127.0 |
| B | 5 | 184 | 422612 | 3534.08 | 616 | 598 | 119.4 |
| B | 5 | 172 | 85082 | 707.5 | 616 | 598 | 119.4 |
| B | 12 | 111 | 15193 | 122.22 | 616 | 598 | 119.4 |
| C | 14 | 254 | 463826 | 3262.6 | 609 | 613 | 142.0 |
| C | 15 | 214 | 256676 | 1803.55 | 609 | 613 | 142.0 |
| C | 9 | 187 | 68113 | 475.43 | 609 | 613 | 142.0 |
| D | 12 | 235 | 3955681 | 27928.37 | 579 | 563 | 141.6 |
| D | 12 | 227 | 373860 | 2635.97 | 579 | 563 | 141.6 |
| D | 13 | 249 | 332936 | 2346.99 | 579 | 563 | 141.6 |
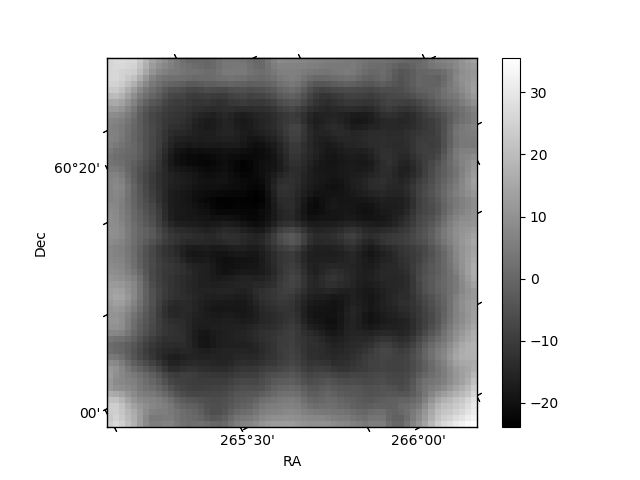
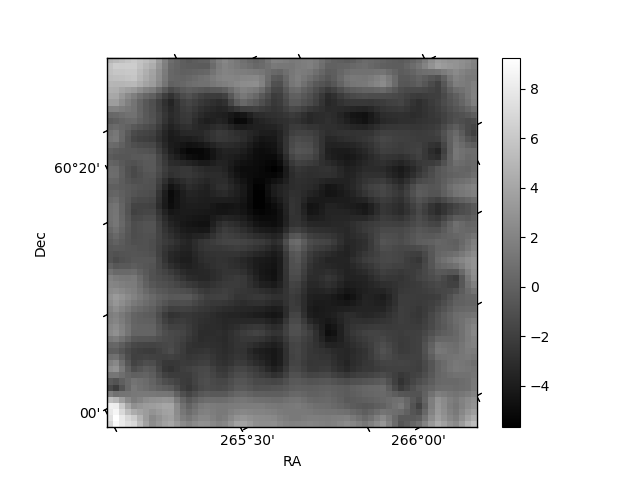
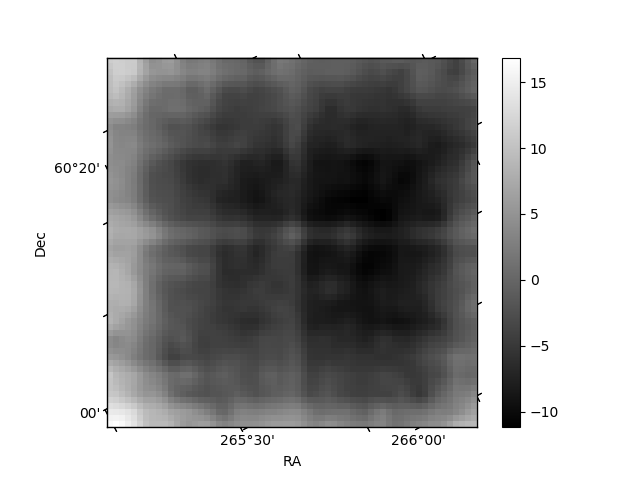
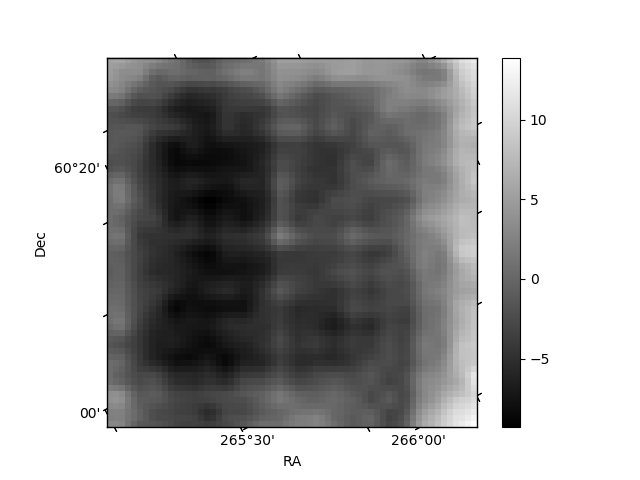
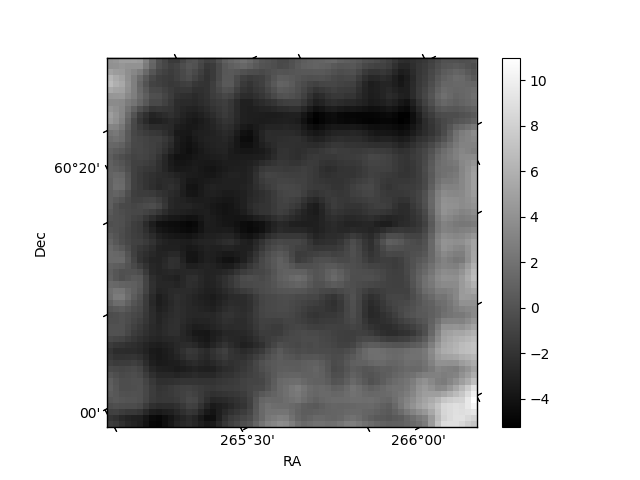
Histogram calculated using DETX and DETY for each event in the final _common_clean file
| Quadrant A | 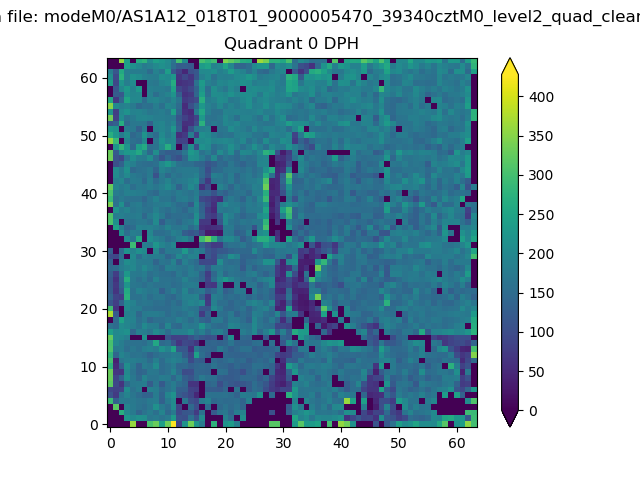 |
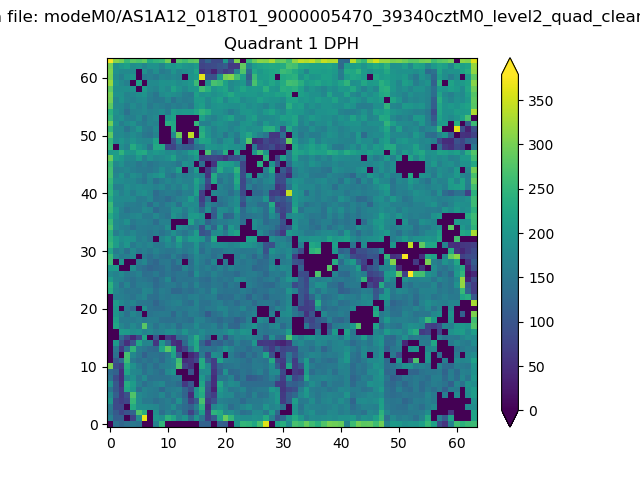 |
Quadrant B |
|---|---|---|---|
| Quadrant D | 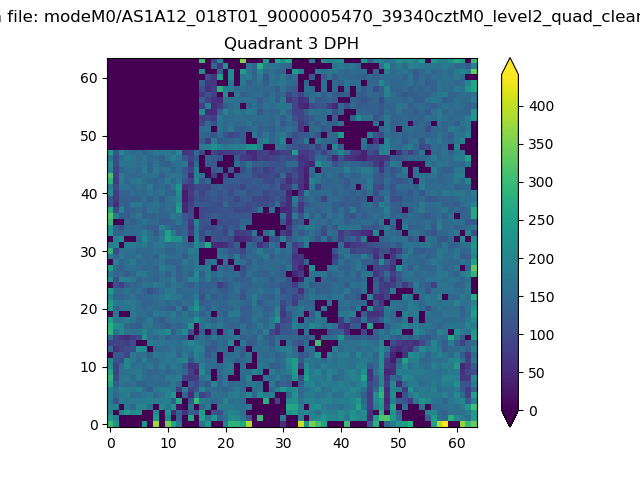 |
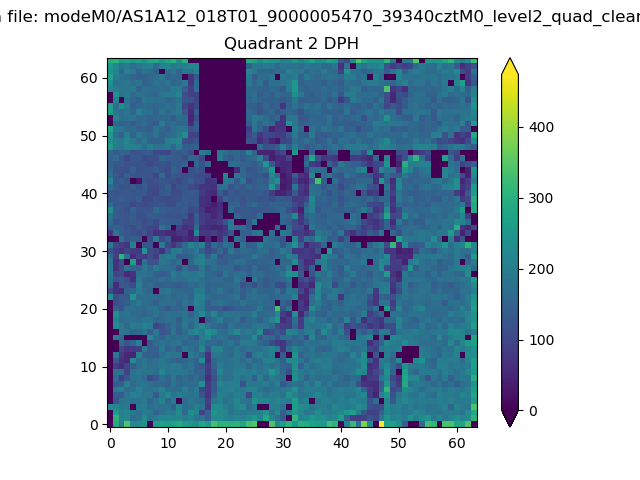 |
Quadrant C |
| Plot type | Count rate plots | Images |
|---|---|---|
| Comparison with Poisson distribution Blue bars denote a histogram of data divided into 1 sec bins. Red curve is a Poisson curve with rate = median count rate of data. |
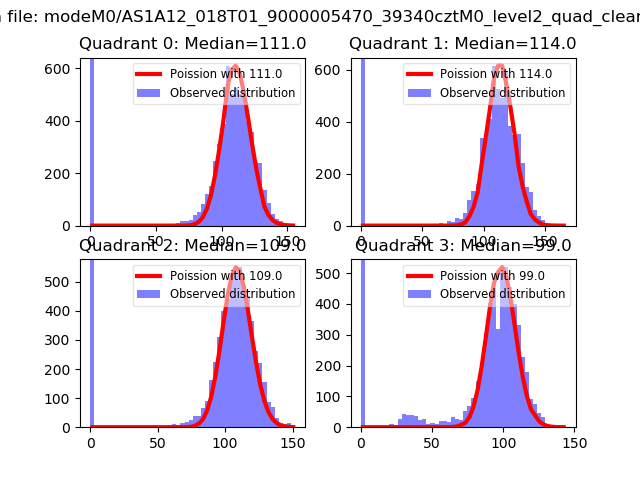 |
 |
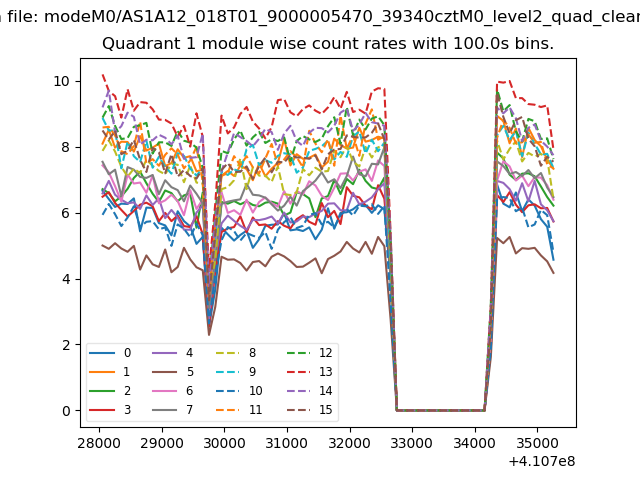
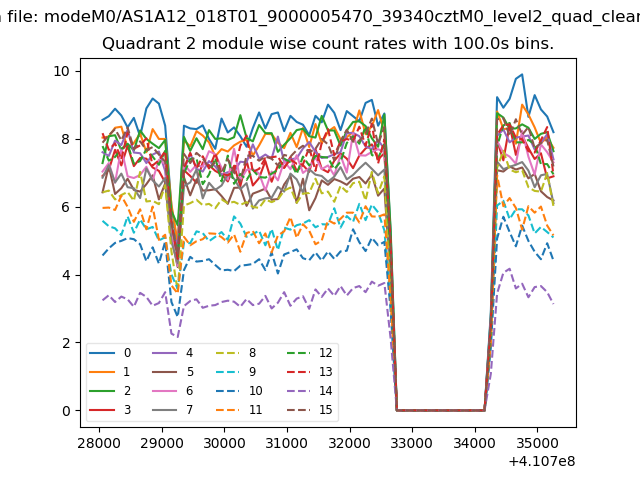
| Quadrant-wise count rates Data is divided into 100 sec bins |
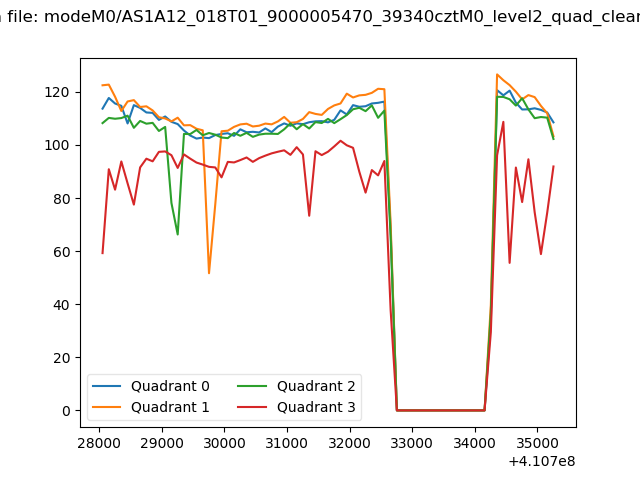 |
|
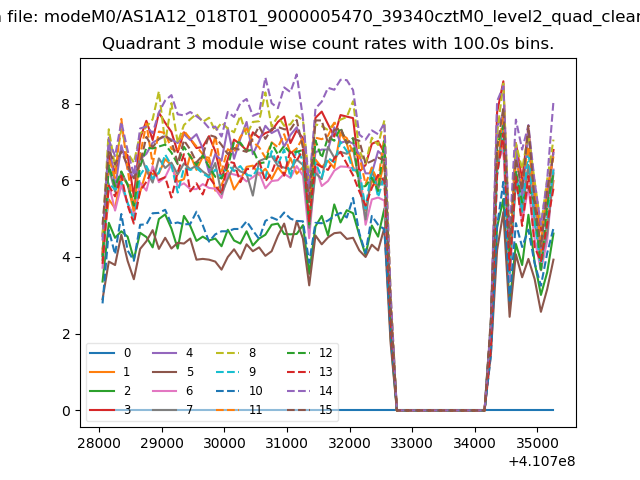
| Module-wise count rates for Quadrant A Data is divided into 100 sec bins |
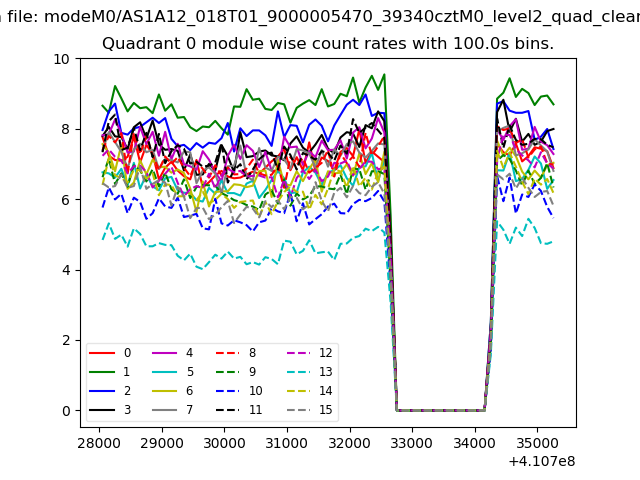 |
 |
| Module-wise count rates for Quadrant B Data is divided into 100 sec bins |
 |
 |
| Module-wise count rates for Quadrant C Data is divided into 100 sec bins |
 |
 |
| Module-wise count rates for Quadrant D Data is divided into 100 sec bins |
 |
 |
| Parameter | Plot |
|---|---|
| CZT HV Monitor |  |
| D_VDD | 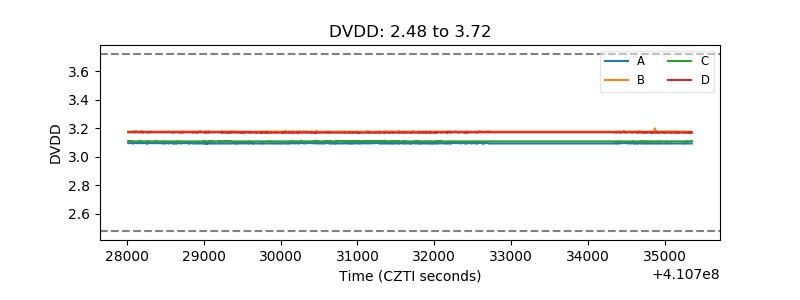 |
| Temperature 1 | 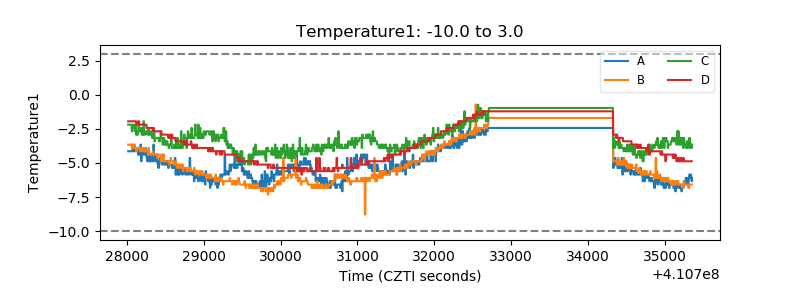 |
| Veto HV Monitor | 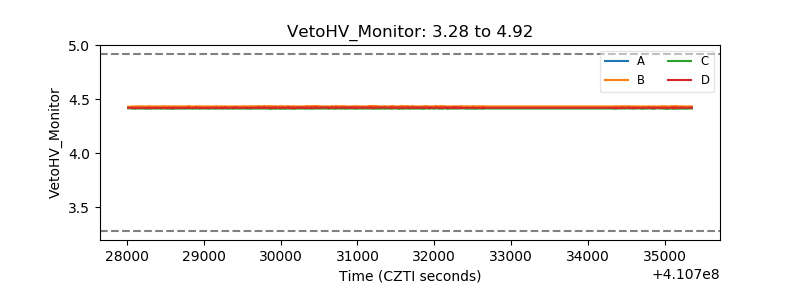 |
| Veto LLD | 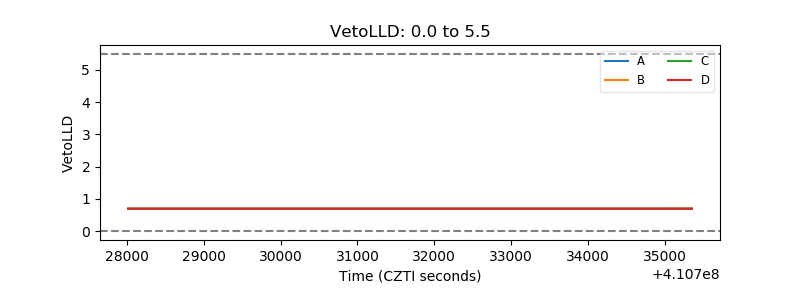 |
| Alpha Counter | 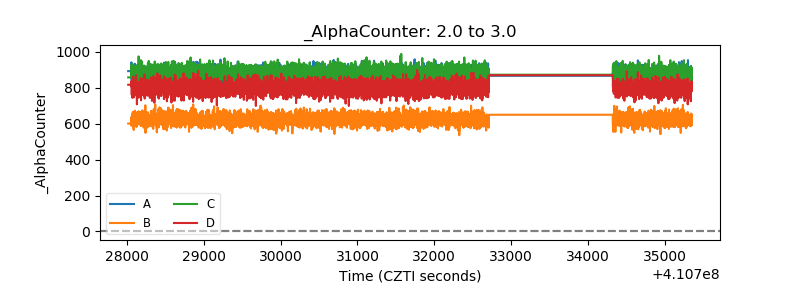 |
| _CPM_Rate | 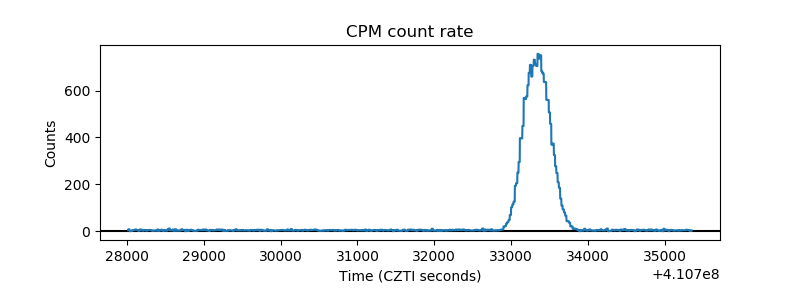 |
| CZT Counter | 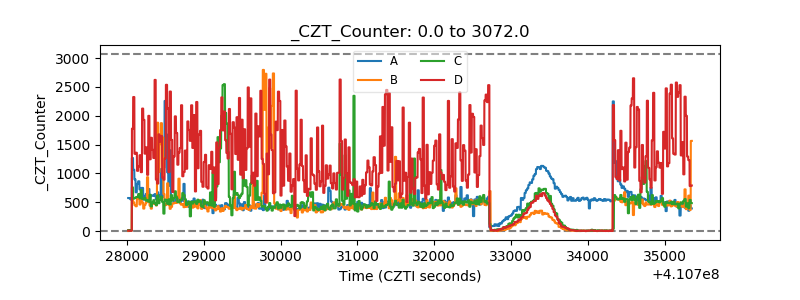 |
| +2.5 Volts monitor | 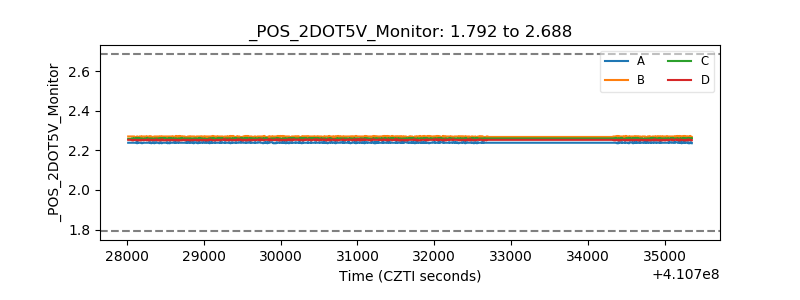 |
| +5 Volts monitor | 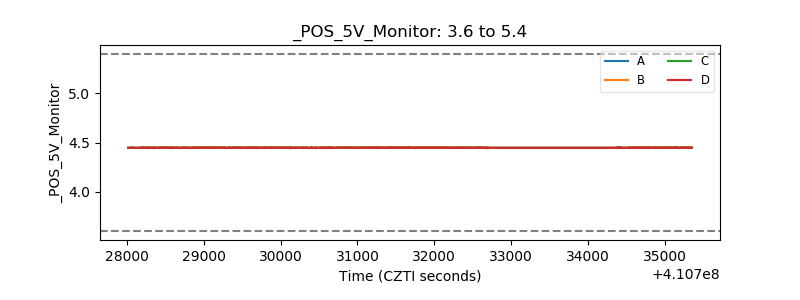 |
| _ROLL_ROT | 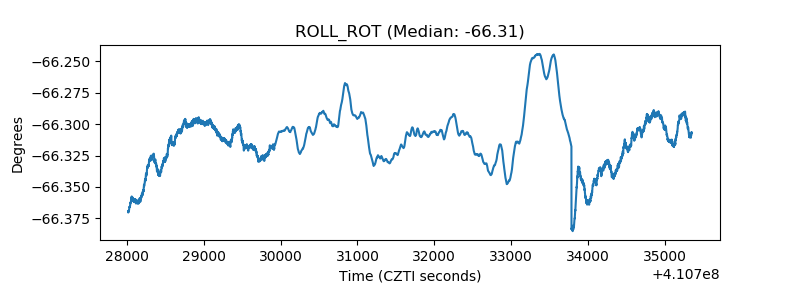 |
| _Roll_DEC | 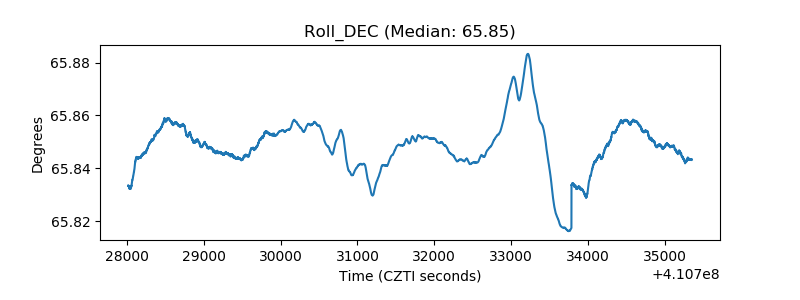 |
| _Roll_RA | 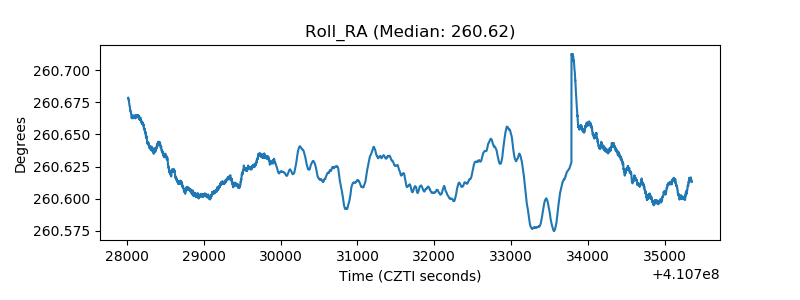 |
| Veto Counter | 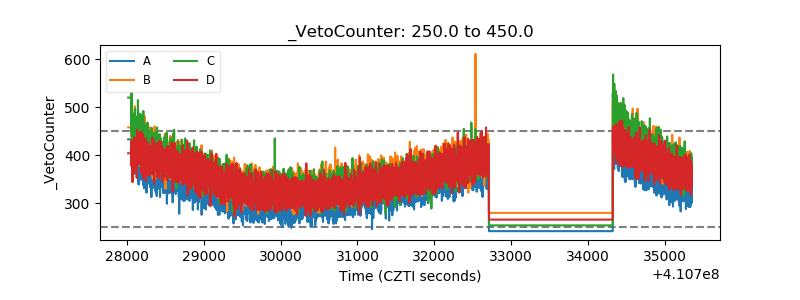 |