| Param | Original file | Final file |
|---|---|---|
| Filename | modeM0/AS1A12_018T01_9000005470_39342cztM0_level2.fits | modeM0/AS1A12_018T01_9000005470_39342cztM0_level2_quad_clean.evt |
| Size (bytes) | 409,155,840 | 91,486,080 |
| Size | 390.2 MB | 87.2 MB |
| Events in quadrant A | 2,821,272 | 621,950 |
| Events in quadrant B | 2,507,995 | 638,890 |
| Events in quadrant C | 2,773,548 | 612,284 |
| Events in quadrant D | 6,613,081 | 510,386 |
| Mode M9 | |||
|---|---|---|---|
| Quadrant | BADHDUFLAG | Total packets | Discarded packets |
| A | 0 | 21 | 0 |
| B | 0 | 21 | 0 |
| C | 0 | 21 | 0 |
| D | 0 | 22 | 0 |
| Mode SS | |||
|---|---|---|---|
| Quadrant | BADHDUFLAG | Total packets | Discarded packets |
| A | 0 | 112 | 0 |
| B | 0 | 112 | 0 |
| C | 0 | 112 | 0 |
| D | 0 | 112 | 0 |
| Mode M0 | |||
|---|---|---|---|
| Quadrant | BADHDUFLAG | Total packets | Discarded packets |
| A | 0 | 11949 | 3 |
| B | 0 | 11400 | 2 |
| C | 0 | 11966 | 2 |
| D | 0 | 23542 | 2 |
| Quadrant | Total seconds | Saturated seconds | Saturation percentage |
|---|---|---|---|
| A | 5526 | 16 | 0.289540% |
| B | 5526 | 18 | 0.325733% |
| C | 5526 | 14 | 0.253348% |
| D | 5526 | 793 | 14.350344% |
Noise dominated data is calculated using 1-second bins in cleaned event files. If a bin has >2000 counts, and if more than 50% of those come from <1% of pixels, then it is considered to be noise-dominated and hence unusable.
| Quadrant | # 1 sec bins | Bins with >0 counts | Bins with >2000 counts | High rate bins dominated by noise | Noise dominated (total time) | Noise dominated (detector-on time) | Marked lightcurve |
|---|---|---|---|---|---|---|---|
| A | 7259 | 5527 | 9 | 9 | 0.12% | 0.16% | 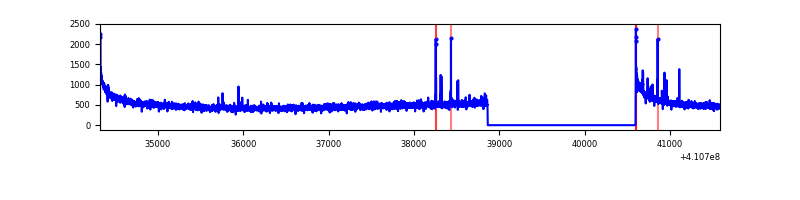 |
| B | 7259 | 5527 | 6 | 6 | 0.08% | 0.11% | 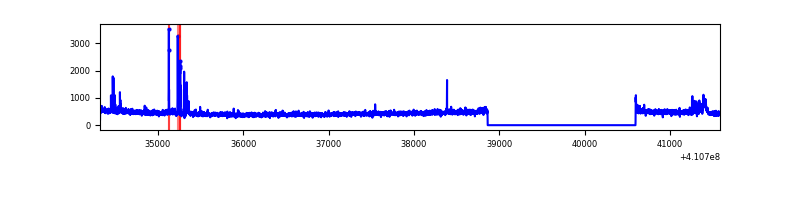 |
| C | 7259 | 5527 | 5 | 5 | 0.07% | 0.09% | 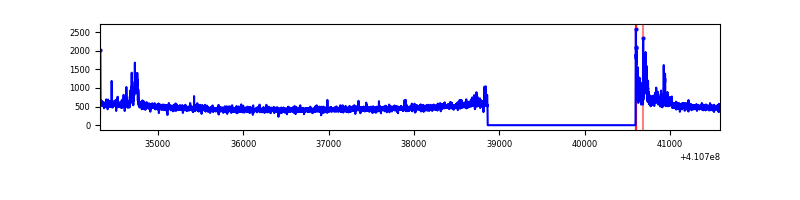 |
| D | 7259 | 5527 | 676 | 676 | 9.31% | 12.23% | 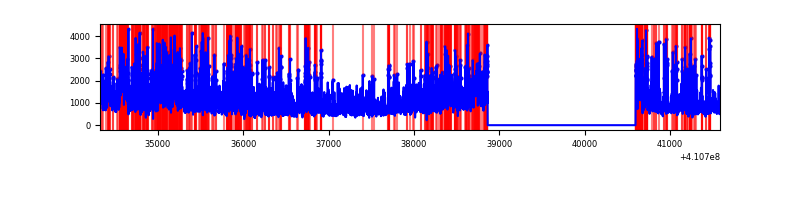 |
Top three noisy pixels from each quadrant. If the there are fewer than three noisy pixels in the level2.evt file, extra rows are filled as -1
| Pixel properties | Quadrant properties | ||||||
|---|---|---|---|---|---|---|---|
| Quadrant | DetID | PixID | Counts | Sigma | Mean | Median | Sigma |
| A | 10 | 83 | 435540 | 3527.62 | 605 | 592 | 123.3 |
| A | 13 | 248 | 30056 | 238.97 | 605 | 592 | 123.3 |
| A | 13 | 254 | 7938 | 59.58 | 605 | 592 | 123.3 |
| B | 5 | 172 | 66666 | 564.51 | 603 | 586 | 117.1 |
| B | 5 | 184 | 52839 | 446.39 | 603 | 586 | 117.1 |
| B | 12 | 111 | 14738 | 120.9 | 603 | 586 | 117.1 |
| C | 15 | 214 | 250424 | 1798.27 | 593 | 597 | 138.9 |
| C | 9 | 187 | 157576 | 1129.95 | 593 | 597 | 138.9 |
| C | 3 | 233 | 38981 | 276.29 | 593 | 597 | 138.9 |
| D | 12 | 235 | 3573584 | 26072.53 | 560 | 544 | 137.0 |
| D | 2 | 249 | 326038 | 2375.13 | 560 | 544 | 137.0 |
| D | 13 | 249 | 252101 | 1835.61 | 560 | 544 | 137.0 |
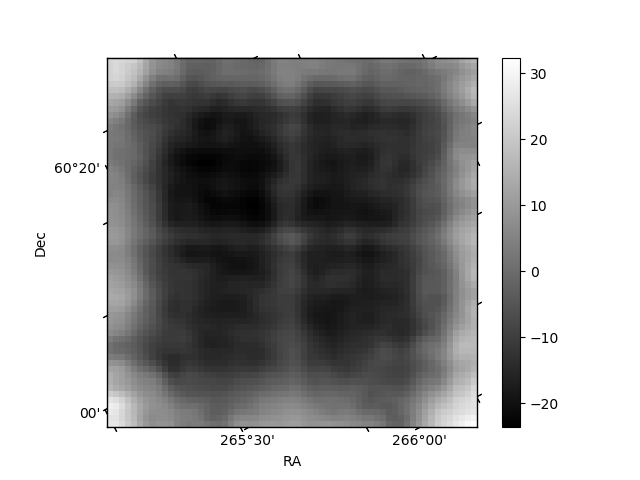
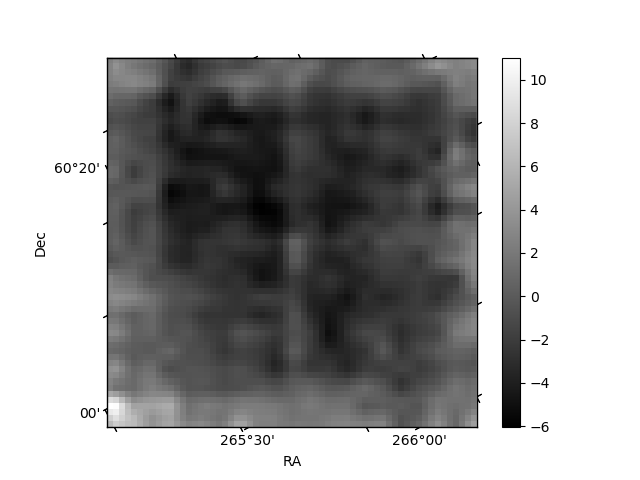
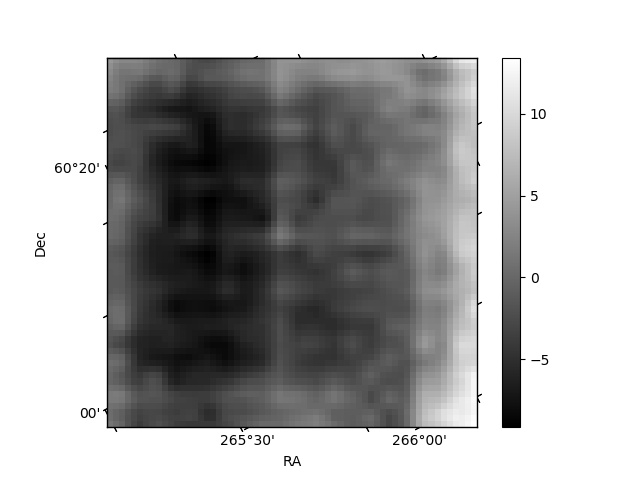
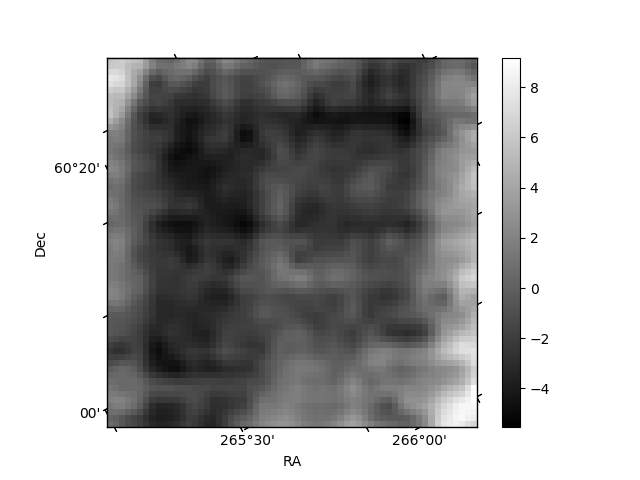
Histogram calculated using DETX and DETY for each event in the final _common_clean file
| Quadrant A | 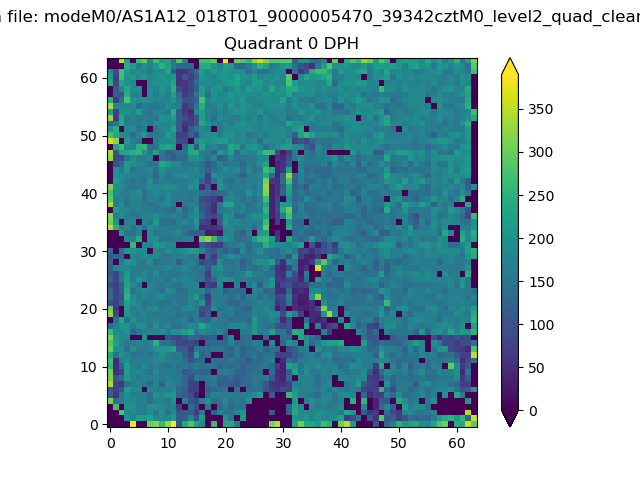 |
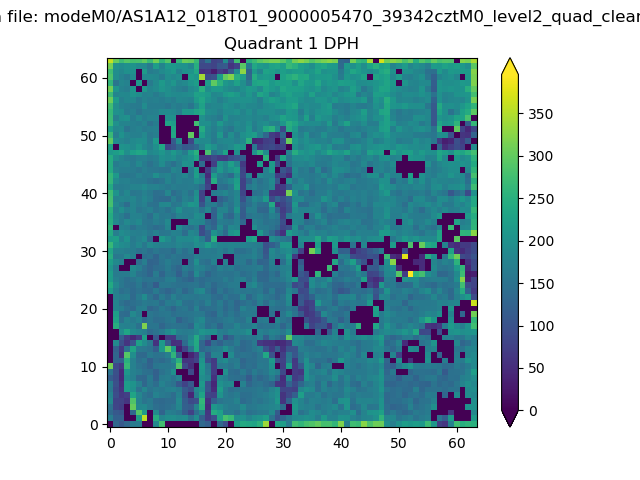 |
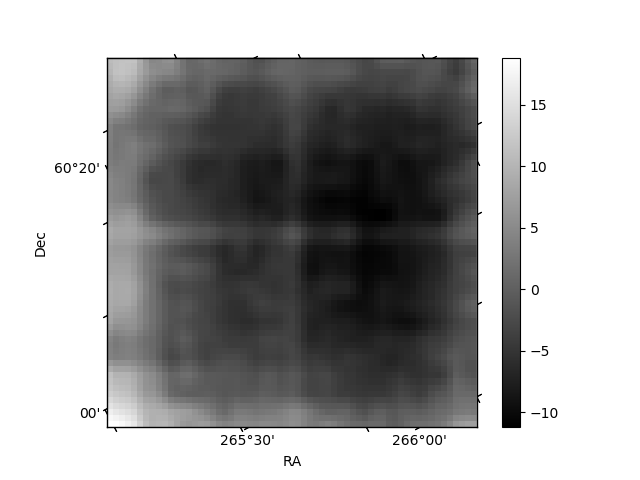
Quadrant B |
|---|---|---|---|
| Quadrant D | 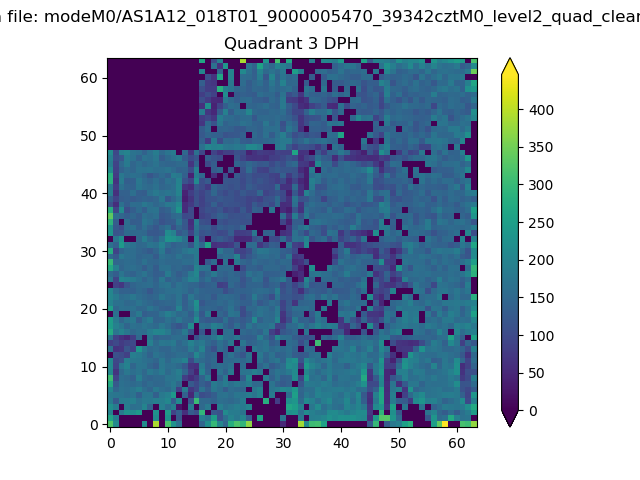 |
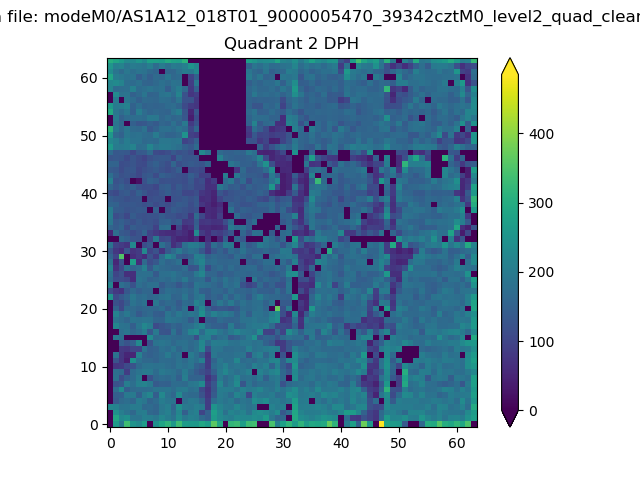 |
Quadrant C |
| Plot type | Count rate plots | Images |
|---|---|---|
| Comparison with Poisson distribution Blue bars denote a histogram of data divided into 1 sec bins. Red curve is a Poisson curve with rate = median count rate of data. |
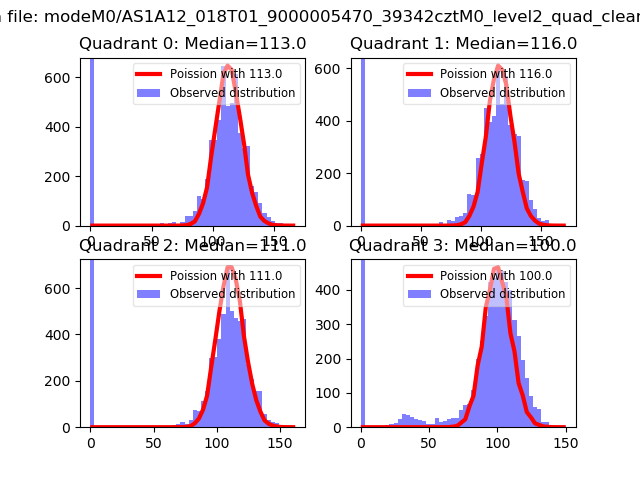 |
 |
| Quadrant-wise count rates Data is divided into 100 sec bins |
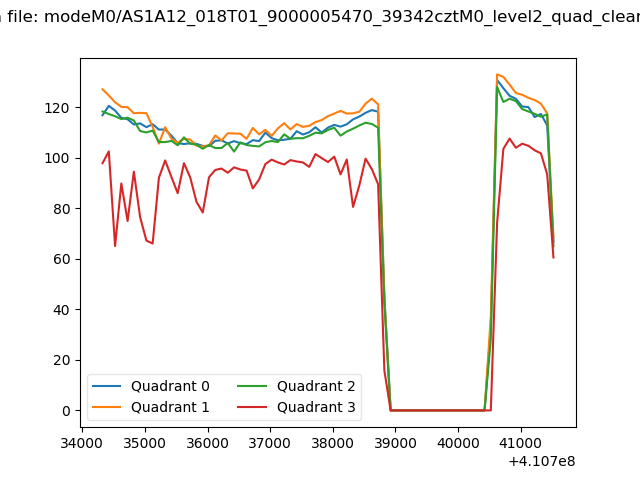 |
|
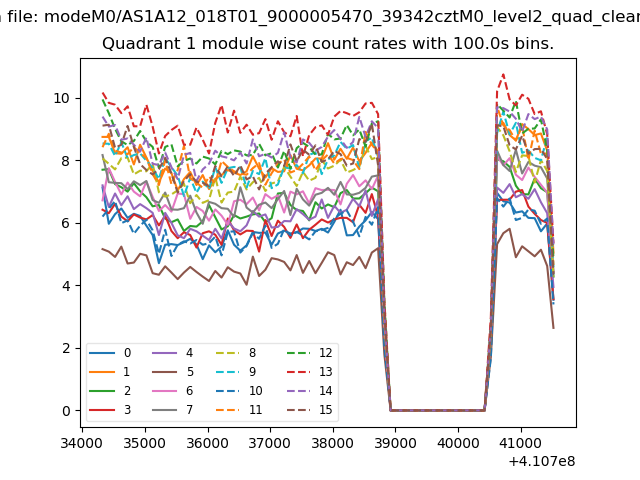
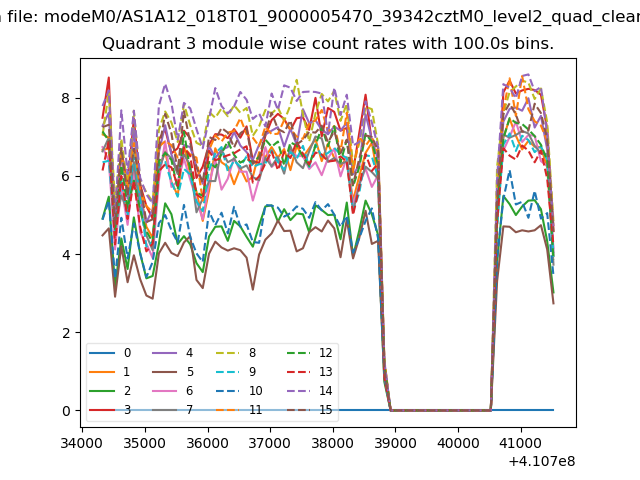
| Module-wise count rates for Quadrant A Data is divided into 100 sec bins |
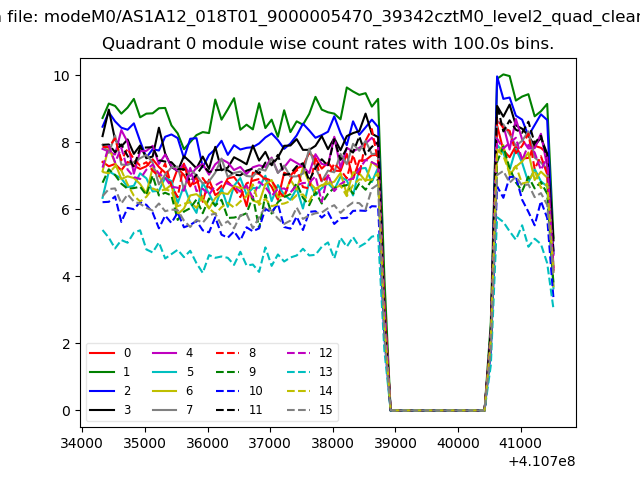 |
 |
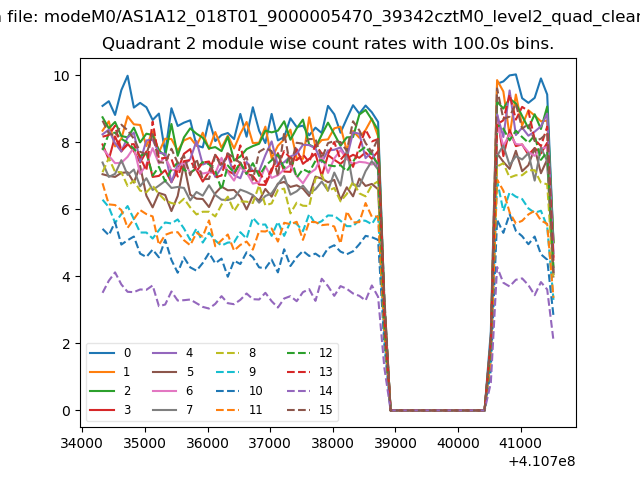
| Module-wise count rates for Quadrant B Data is divided into 100 sec bins |
 |
 |
| Module-wise count rates for Quadrant C Data is divided into 100 sec bins |
 |
 |
| Module-wise count rates for Quadrant D Data is divided into 100 sec bins |
 |
 |
| Parameter | Plot |
|---|---|
| CZT HV Monitor | 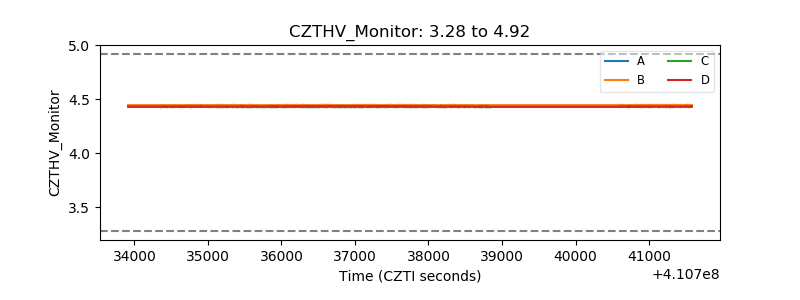 |
| D_VDD | 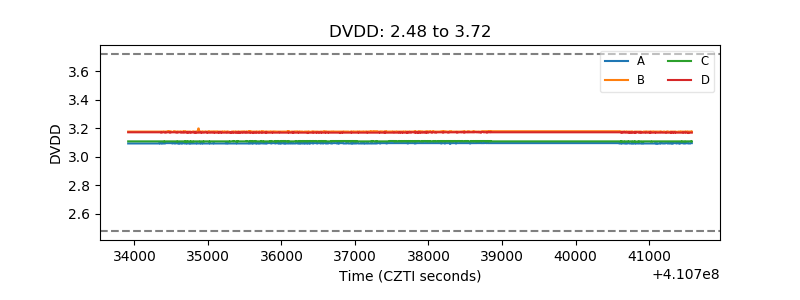 |
| Temperature 1 | 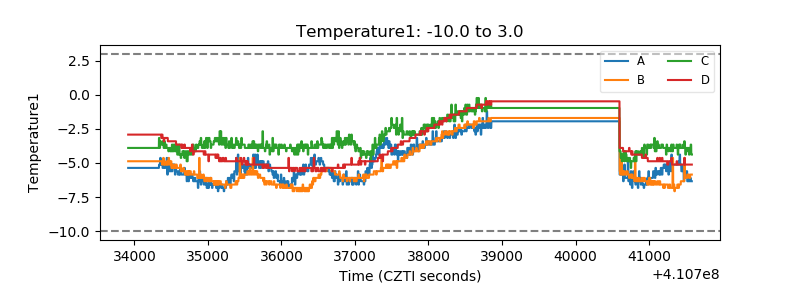 |
| Veto HV Monitor |  |
| Veto LLD | 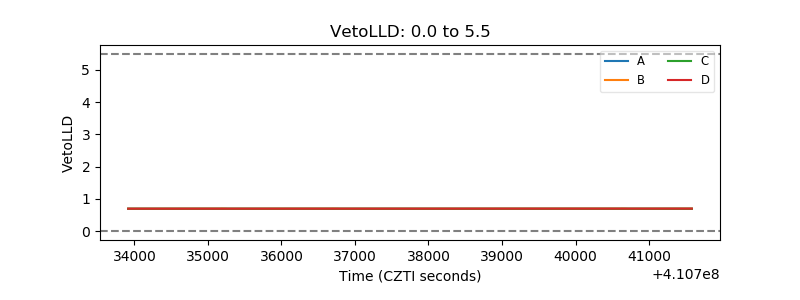 |
| Alpha Counter | 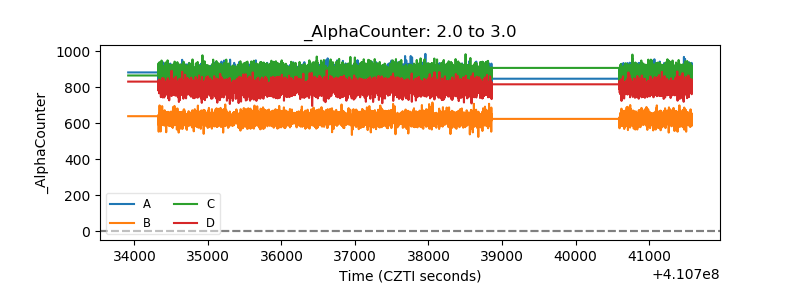 |
| _CPM_Rate | 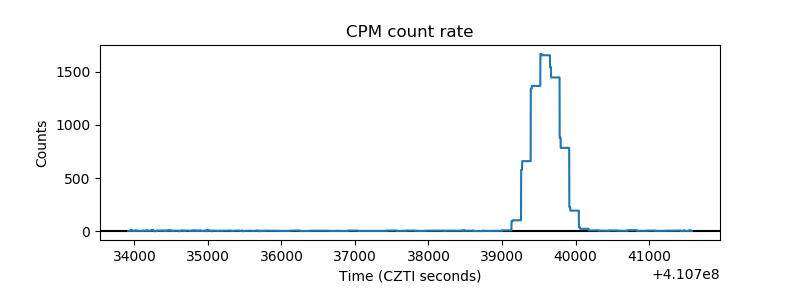 |
| CZT Counter | 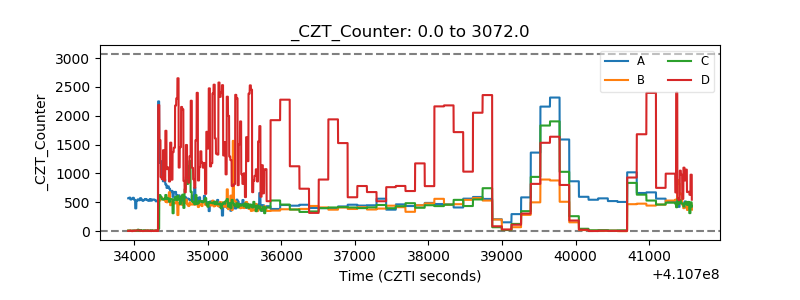 |
| +2.5 Volts monitor | 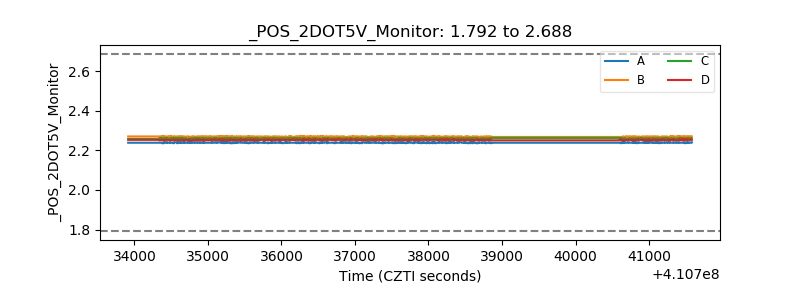 |
| +5 Volts monitor | 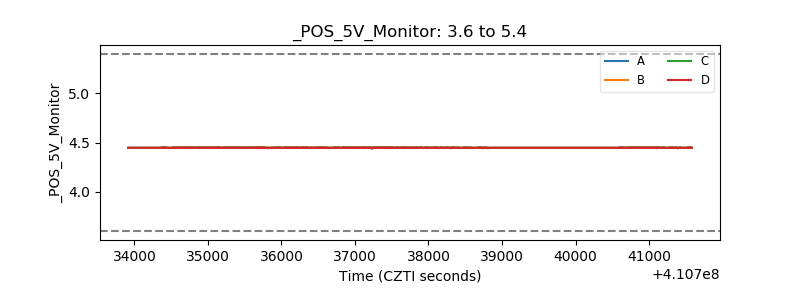 |
| _ROLL_ROT | 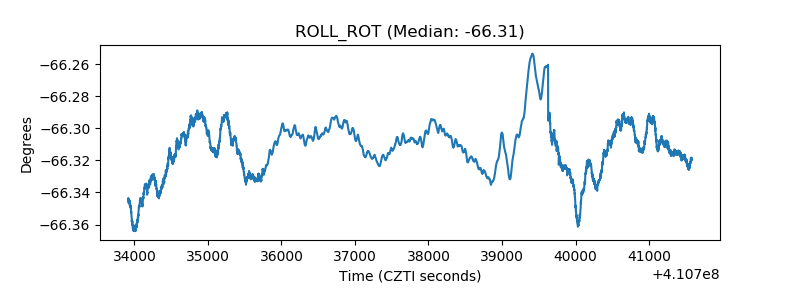 |
| _Roll_DEC | 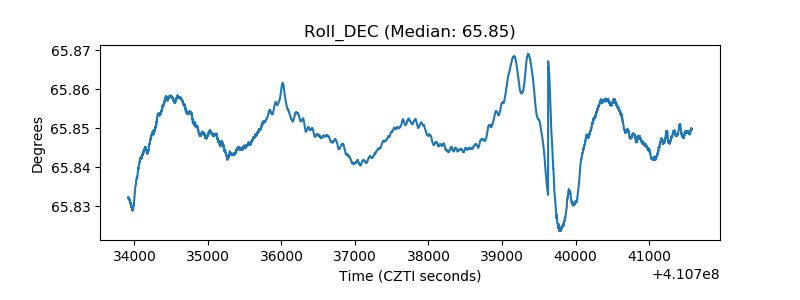 |
| _Roll_RA | 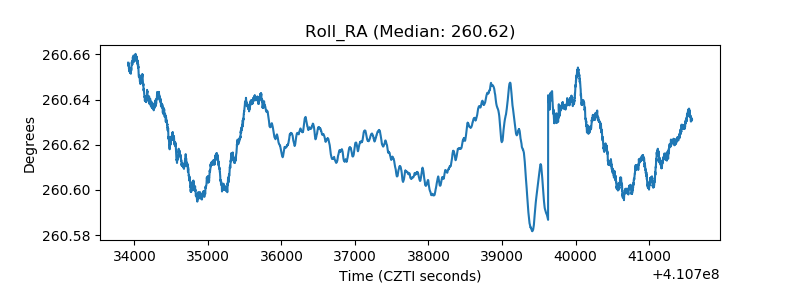 |
| Veto Counter | 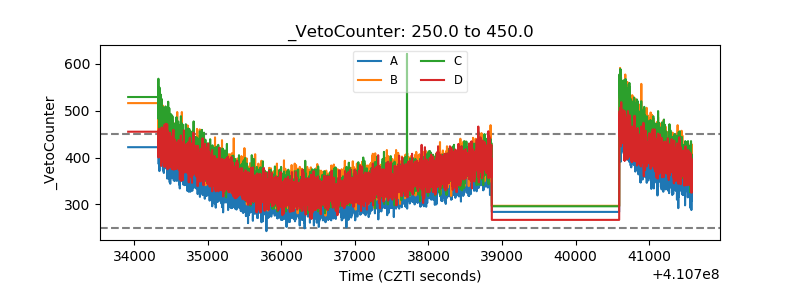 |