| Param | Original file | Final file |
|---|---|---|
| Filename | modeM0/AS1A12_018T01_9000005470_39343cztM0_level2.fits | modeM0/AS1A12_018T01_9000005470_39343cztM0_level2_quad_clean.evt |
| Size (bytes) | 396,480,960 | 93,600,000 |
| Size | 378.1 MB | 89.3 MB |
| Events in quadrant A | 2,767,984 | 637,026 |
| Events in quadrant B | 2,866,012 | 656,091 |
| Events in quadrant C | 2,666,373 | 627,792 |
| Events in quadrant D | 5,954,361 | 533,696 |
| Mode M9 | |||
|---|---|---|---|
| Quadrant | BADHDUFLAG | Total packets | Discarded packets |
| A | 0 | 25 | 0 |
| B | 0 | 25 | 0 |
| C | 0 | 25 | 0 |
| D | 0 | 26 | 0 |
| Mode SS | |||
|---|---|---|---|
| Quadrant | BADHDUFLAG | Total packets | Discarded packets |
| A | 0 | 110 | 0 |
| B | 0 | 110 | 0 |
| C | 0 | 110 | 0 |
| D | 0 | 110 | 0 |
| Mode M0 | |||
|---|---|---|---|
| Quadrant | BADHDUFLAG | Total packets | Discarded packets |
| A | 0 | 11697 | 3 |
| B | 0 | 12282 | 2 |
| C | 0 | 11459 | 2 |
| D | 0 | 21496 | 2 |
| Quadrant | Total seconds | Saturated seconds | Saturation percentage |
|---|---|---|---|
| A | 5425 | 12 | 0.221198% |
| B | 5425 | 53 | 0.976959% |
| C | 5425 | 12 | 0.221198% |
| D | 5425 | 551 | 10.156682% |
Noise dominated data is calculated using 1-second bins in cleaned event files. If a bin has >2000 counts, and if more than 50% of those come from <1% of pixels, then it is considered to be noise-dominated and hence unusable.
| Quadrant | # 1 sec bins | Bins with >0 counts | Bins with >2000 counts | High rate bins dominated by noise | Noise dominated (total time) | Noise dominated (detector-on time) | Marked lightcurve |
|---|---|---|---|---|---|---|---|
| A | 7308 | 5426 | 6 | 6 | 0.08% | 0.11% | 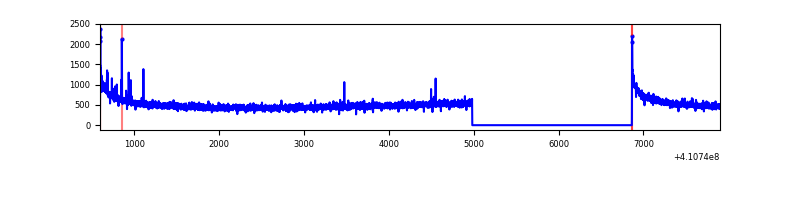 |
| B | 7308 | 5426 | 35 | 35 | 0.48% | 0.65% | 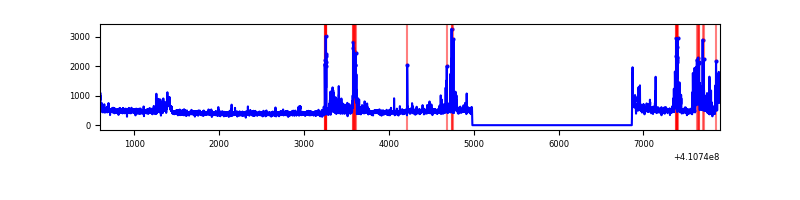 |
| C | 7308 | 5426 | 4 | 4 | 0.05% | 0.07% | 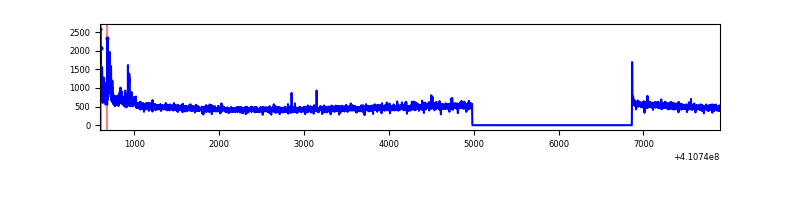 |
| D | 7308 | 5426 | 517 | 517 | 7.07% | 9.53% | 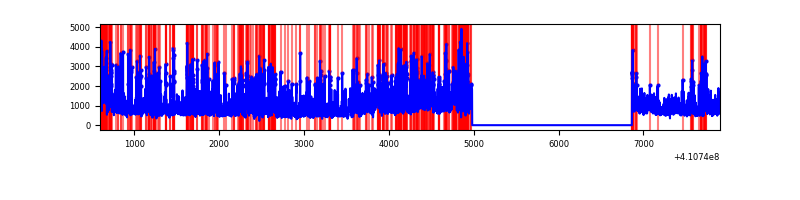 |
Top three noisy pixels from each quadrant. If the there are fewer than three noisy pixels in the level2.evt file, extra rows are filled as -1
| Pixel properties | Quadrant properties | ||||||
|---|---|---|---|---|---|---|---|
| Quadrant | DetID | PixID | Counts | Sigma | Mean | Median | Sigma |
| A | 10 | 83 | 421716 | 3462.53 | 601 | 588 | 121.6 |
| A | 13 | 248 | 16381 | 129.85 | 601 | 588 | 121.6 |
| A | 13 | 254 | 7107 | 53.6 | 601 | 588 | 121.6 |
| B | 5 | 184 | 393418 | 3422.24 | 599 | 581 | 114.8 |
| B | 5 | 172 | 107436 | 930.88 | 599 | 581 | 114.8 |
| B | 12 | 111 | 14606 | 122.18 | 599 | 581 | 114.8 |
| C | 15 | 214 | 245572 | 1804.48 | 587 | 590 | 135.8 |
| C | 9 | 187 | 105575 | 773.29 | 587 | 590 | 135.8 |
| C | 0 | 10 | 11407 | 79.68 | 587 | 590 | 135.8 |
| D | 12 | 235 | 3523824 | 25656.46 | 562 | 546 | 137.3 |
| D | 2 | 249 | 187765 | 1363.32 | 562 | 546 | 137.3 |
| D | 2 | 16 | 54506 | 392.93 | 562 | 546 | 137.3 |
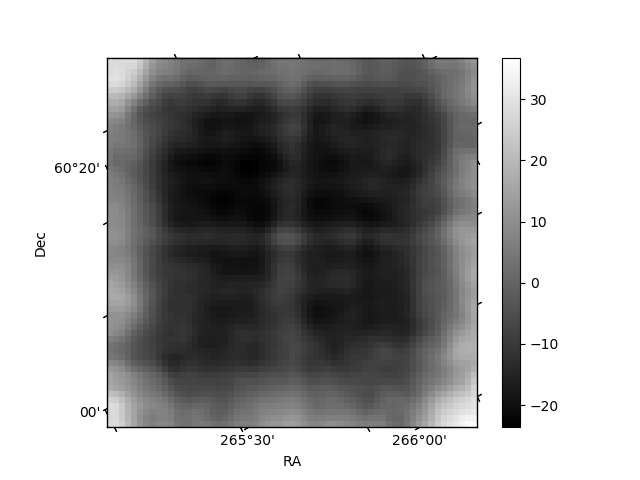
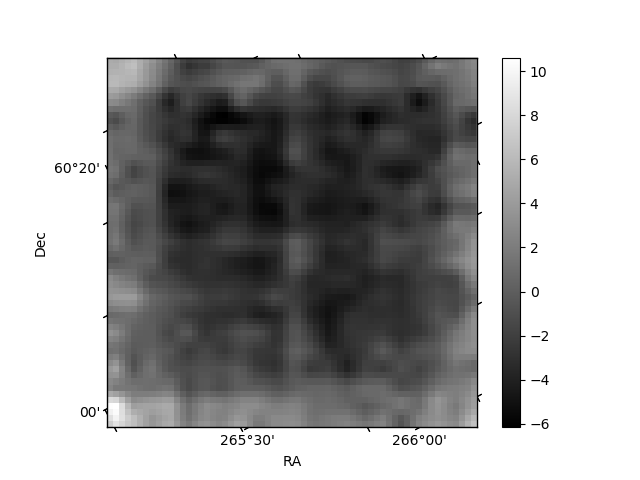
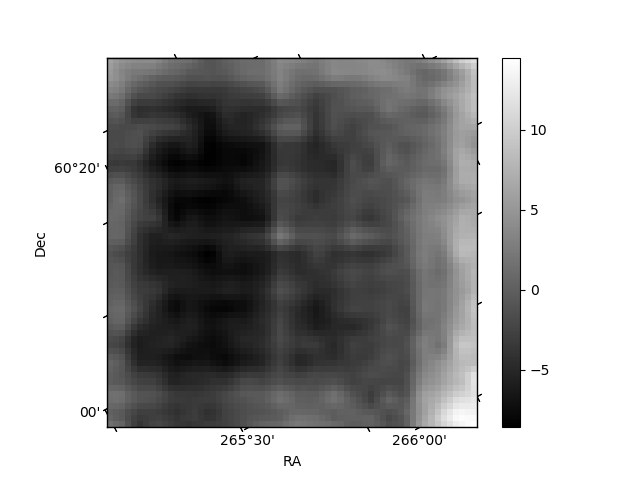
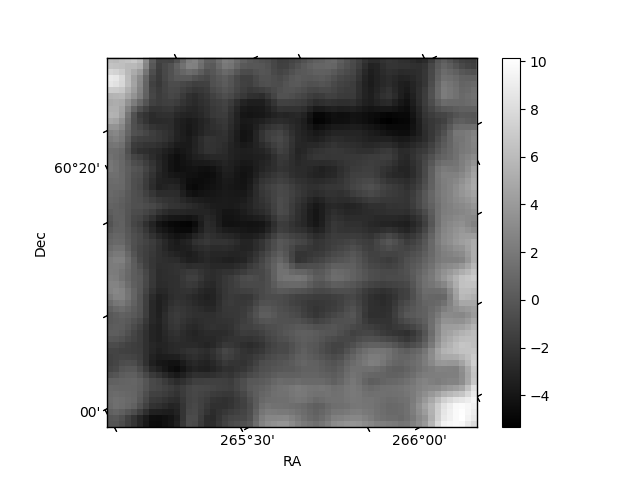
Histogram calculated using DETX and DETY for each event in the final _common_clean file
| Quadrant A | 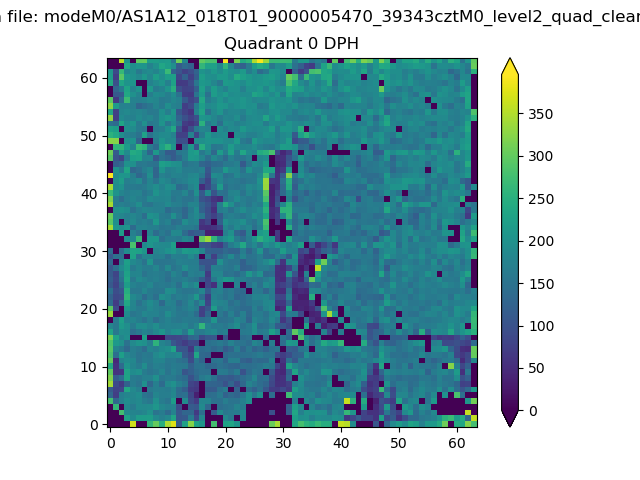 |
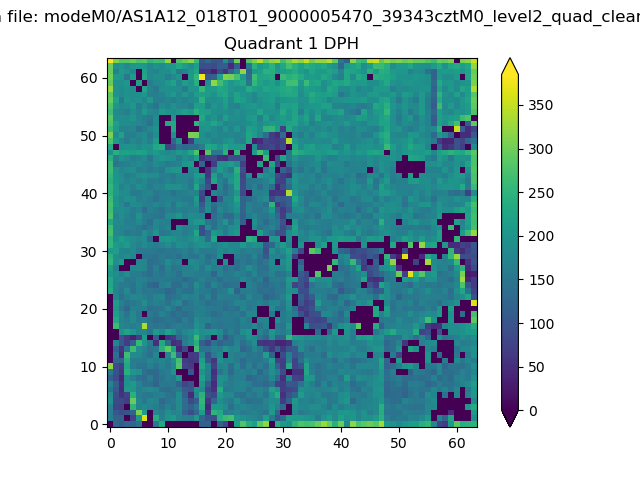 |
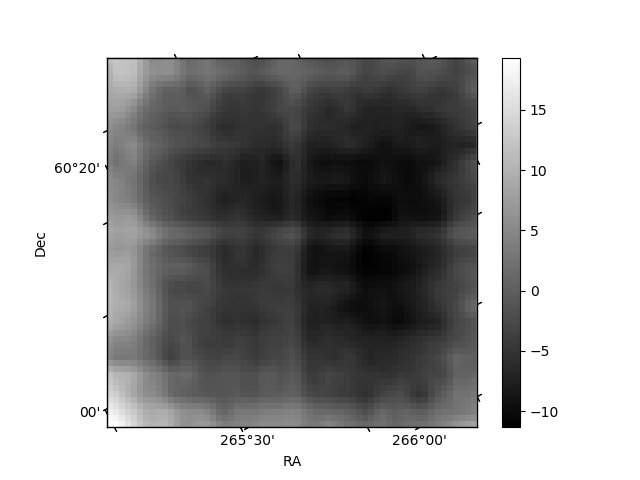
Quadrant B |
|---|---|---|---|
| Quadrant D | 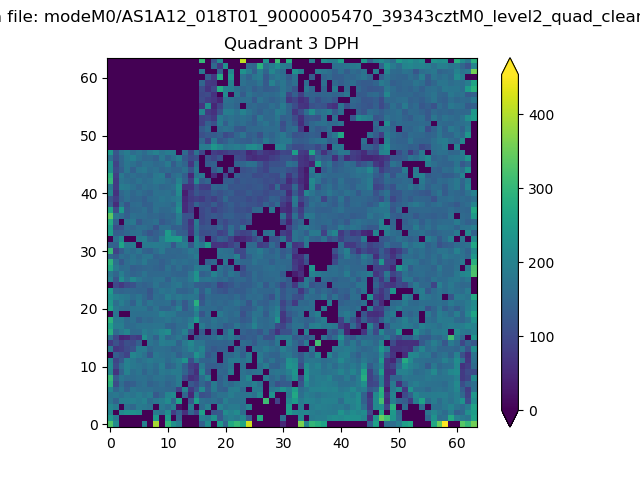 |
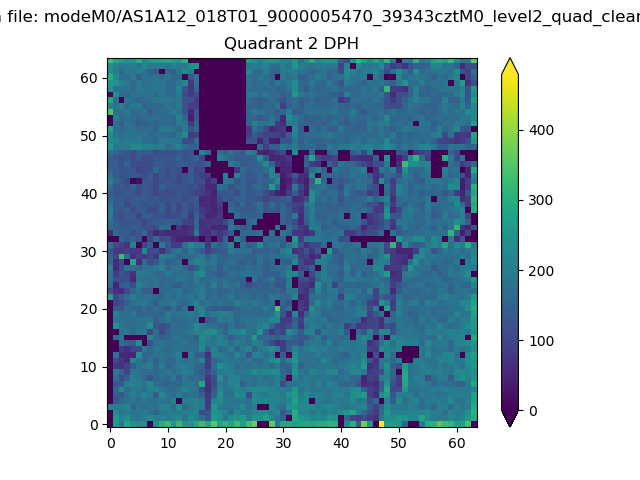 |
Quadrant C |
| Plot type | Count rate plots | Images |
|---|---|---|
| Comparison with Poisson distribution Blue bars denote a histogram of data divided into 1 sec bins. Red curve is a Poisson curve with rate = median count rate of data. |
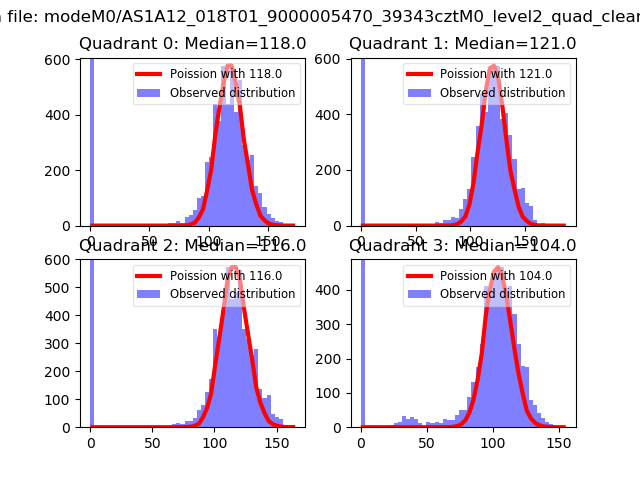 |
 |
| Quadrant-wise count rates Data is divided into 100 sec bins |
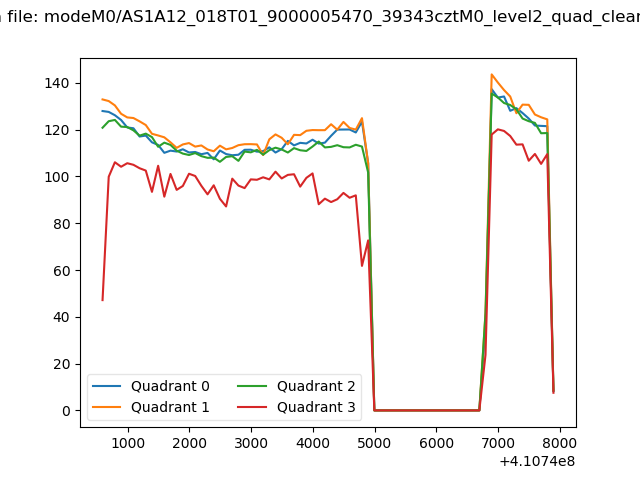 |
|
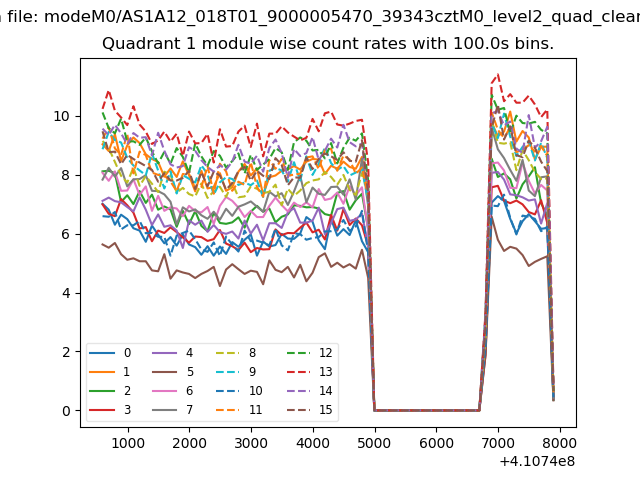
| Module-wise count rates for Quadrant A Data is divided into 100 sec bins |
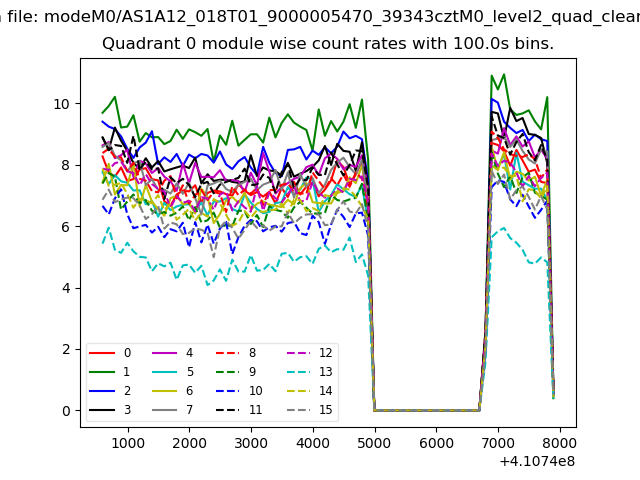 |
 |
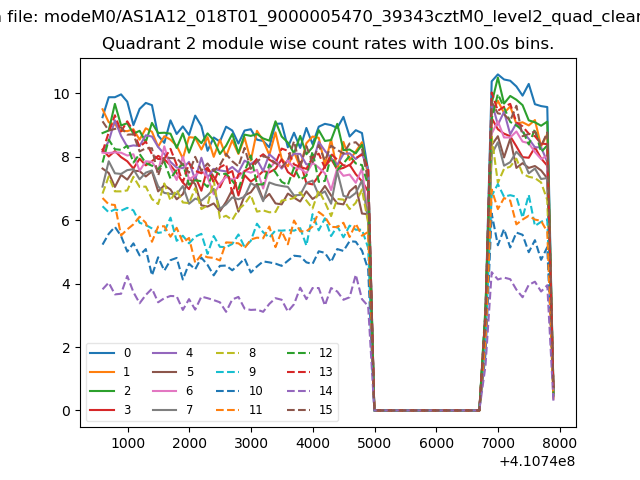
| Module-wise count rates for Quadrant B Data is divided into 100 sec bins |
 |
 |
| Module-wise count rates for Quadrant C Data is divided into 100 sec bins |
 |
 |
| Module-wise count rates for Quadrant D Data is divided into 100 sec bins |
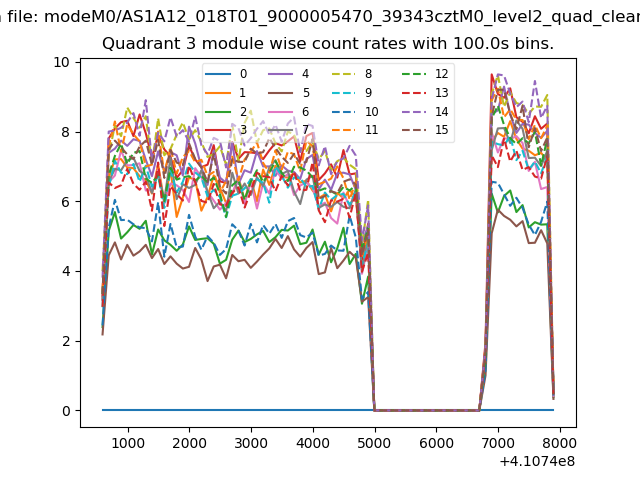 |
 |
| Parameter | Plot |
|---|---|
| CZT HV Monitor | 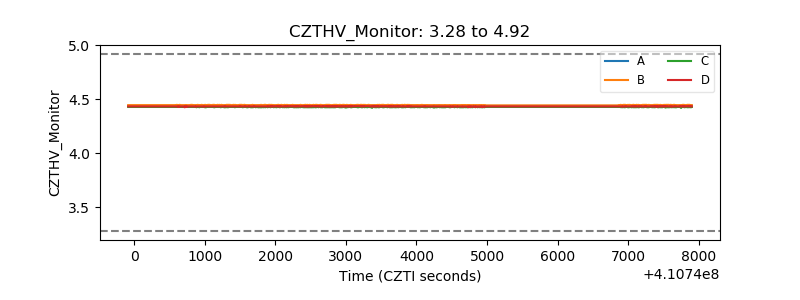 |
| D_VDD | 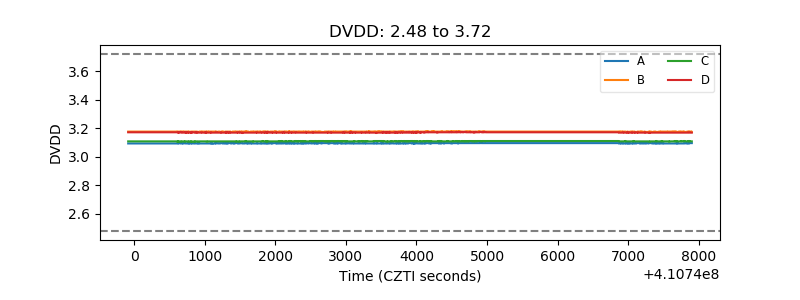 |
| Temperature 1 | 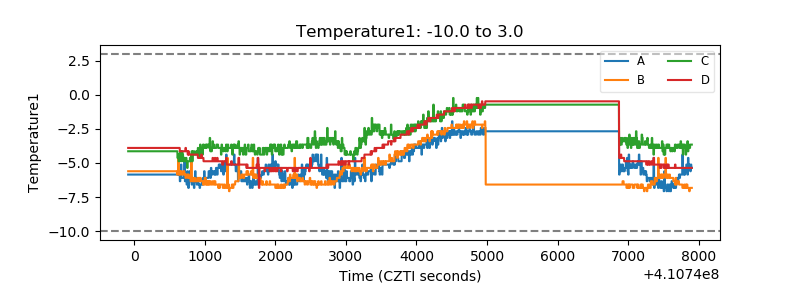 |
| Veto HV Monitor | 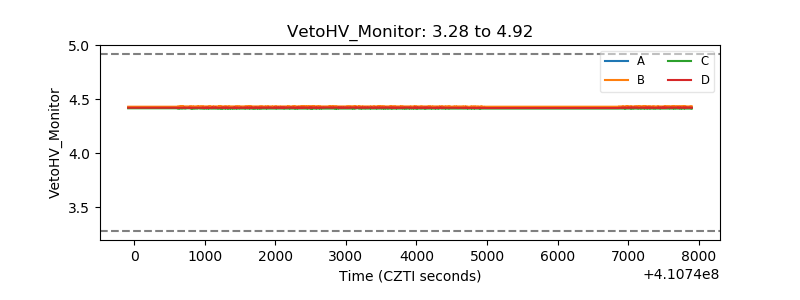 |
| Veto LLD | 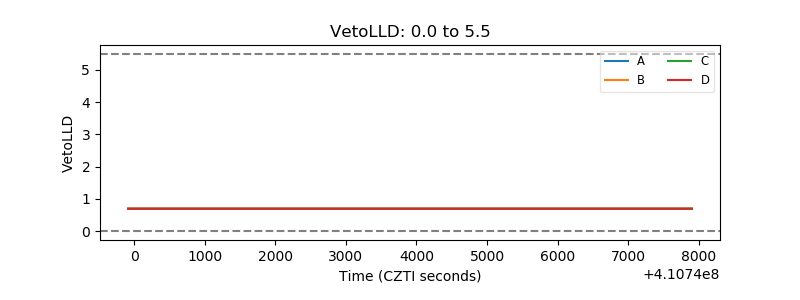 |
| Alpha Counter | 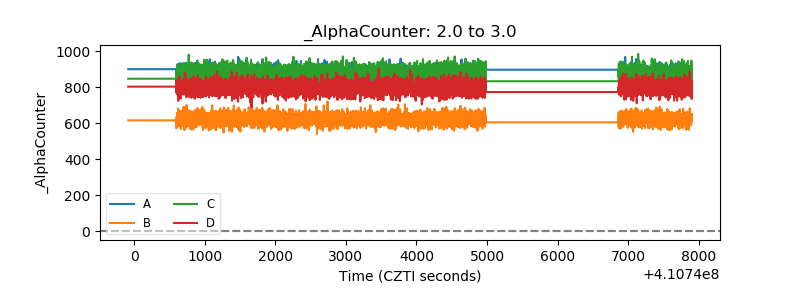 |
| _CPM_Rate | 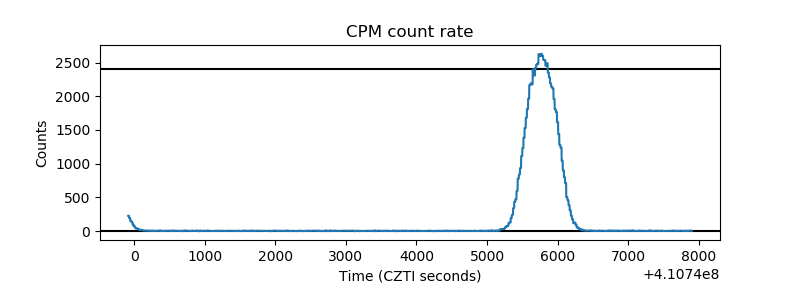 |
| CZT Counter | 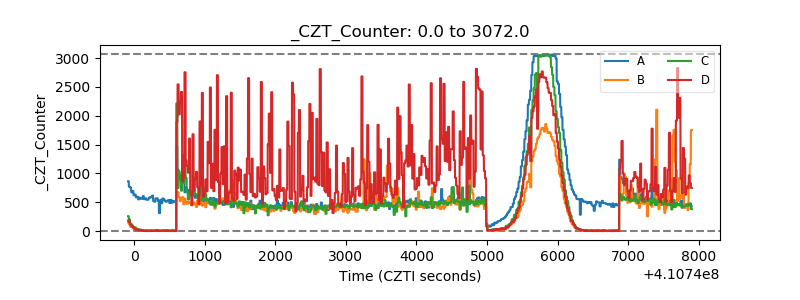 |
| +2.5 Volts monitor | 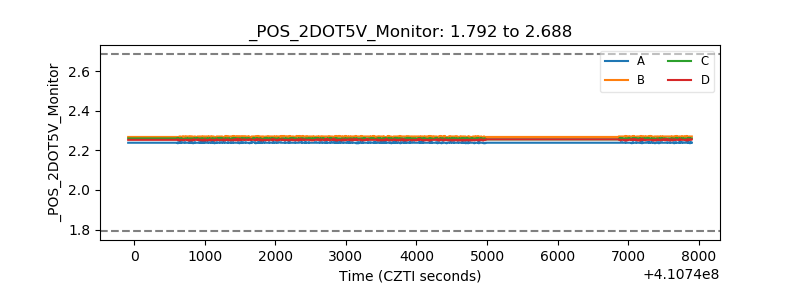 |
| +5 Volts monitor | 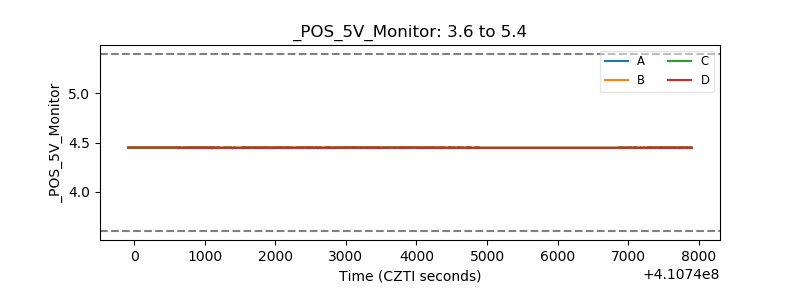 |
| _ROLL_ROT | 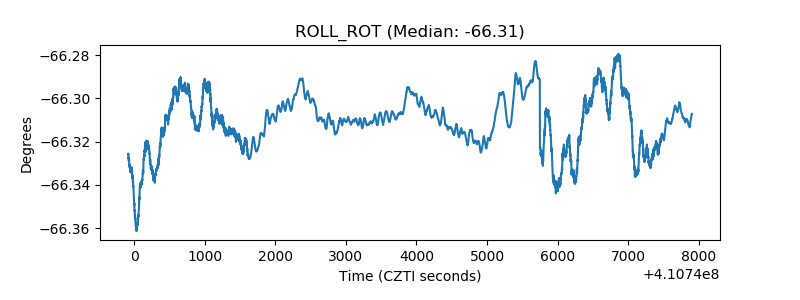 |
| _Roll_DEC | 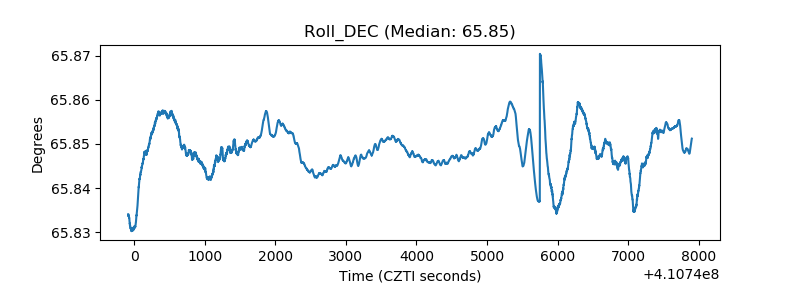 |
| _Roll_RA | 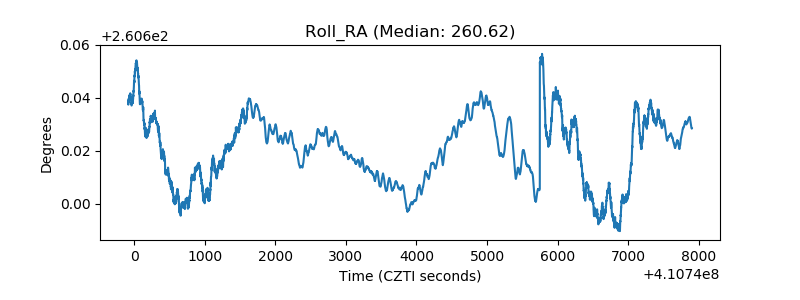 |
| Veto Counter | 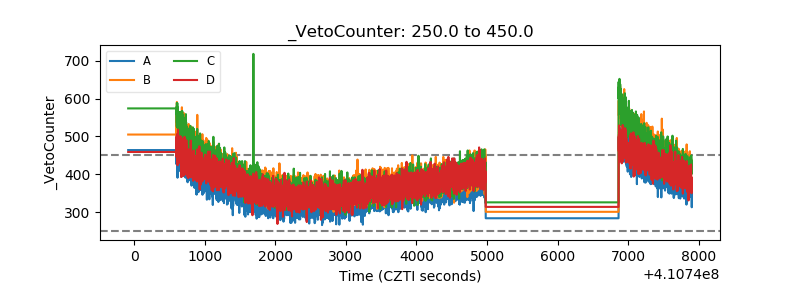 |