| Param | Original file | Final file |
|---|---|---|
| Filename | modeM0/AS1A12_018T01_9000005470_39344cztM0_level2.fits | modeM0/AS1A12_018T01_9000005470_39344cztM0_level2_quad_clean.evt |
| Size (bytes) | 425,543,040 | 92,793,600 |
| Size | 405.8 MB | 88.5 MB |
| Events in quadrant A | 2,756,670 | 650,185 |
| Events in quadrant B | 2,690,968 | 673,272 |
| Events in quadrant C | 2,560,453 | 635,316 |
| Events in quadrant D | 7,331,937 | 479,784 |
| Mode M9 | |||
|---|---|---|---|
| Quadrant | BADHDUFLAG | Total packets | Discarded packets |
| A | 0 | 27 | 0 |
| B | 0 | 27 | 0 |
| C | 0 | 27 | 0 |
| D | 0 | 28 | 0 |
| Mode SS | |||
|---|---|---|---|
| Quadrant | BADHDUFLAG | Total packets | Discarded packets |
| A | 0 | 108 | 0 |
| B | 0 | 108 | 0 |
| C | 0 | 108 | 0 |
| D | 0 | 108 | 0 |
| Mode M0 | |||
|---|---|---|---|
| Quadrant | BADHDUFLAG | Total packets | Discarded packets |
| A | 0 | 11444 | 3 |
| B | 0 | 11598 | 2 |
| C | 0 | 10889 | 2 |
| D | 0 | 25569 | 2 |
| Quadrant | Total seconds | Saturated seconds | Saturation percentage |
|---|---|---|---|
| A | 5303 | 12 | 0.226287% |
| B | 5303 | 41 | 0.773147% |
| C | 5303 | 3 | 0.056572% |
| D | 5303 | 1161 | 21.893268% |
Noise dominated data is calculated using 1-second bins in cleaned event files. If a bin has >2000 counts, and if more than 50% of those come from <1% of pixels, then it is considered to be noise-dominated and hence unusable.
| Quadrant | # 1 sec bins | Bins with >0 counts | Bins with >2000 counts | High rate bins dominated by noise | Noise dominated (total time) | Noise dominated (detector-on time) | Marked lightcurve |
|---|---|---|---|---|---|---|---|
| A | 7306 | 5304 | 5 | 5 | 0.07% | 0.09% | 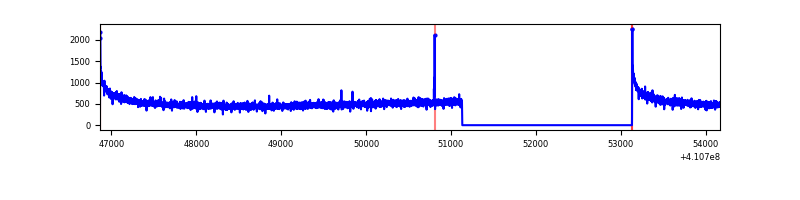 |
| B | 7306 | 5304 | 22 | 22 | 0.30% | 0.41% | 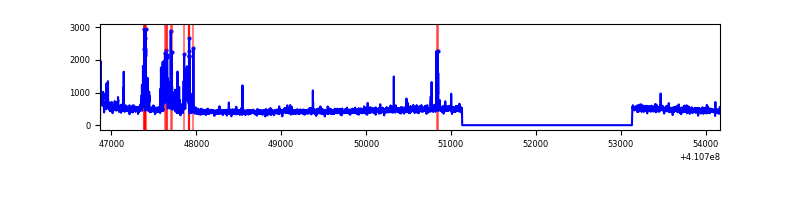 |
| C | 7306 | 5304 | 0 | 0 | 0.00% | 0.00% | 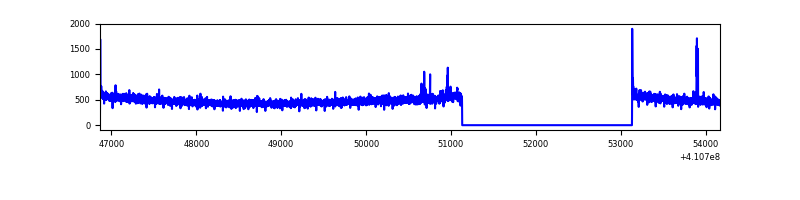 |
| D | 7306 | 5304 | 1026 | 1026 | 14.04% | 19.34% | 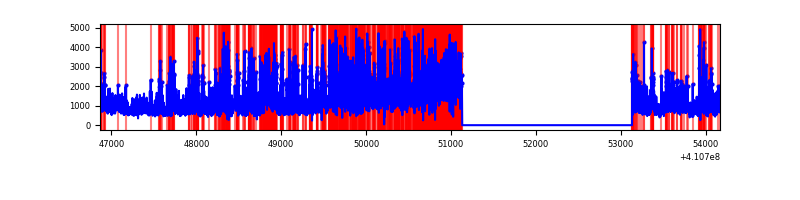 |
Top three noisy pixels from each quadrant. If the there are fewer than three noisy pixels in the level2.evt file, extra rows are filled as -1
| Pixel properties | Quadrant properties | ||||||
|---|---|---|---|---|---|---|---|
| Quadrant | DetID | PixID | Counts | Sigma | Mean | Median | Sigma |
| A | 10 | 83 | 423387 | 3484.02 | 601 | 589 | 121.4 |
| A | 13 | 254 | 7841 | 59.76 | 601 | 589 | 121.4 |
| A | 13 | 248 | 6895 | 51.96 | 601 | 589 | 121.4 |
| B | 5 | 184 | 207839 | 1829.86 | 600 | 584 | 113.3 |
| B | 5 | 172 | 94352 | 827.88 | 600 | 584 | 113.3 |
| B | 15 | 35 | 24285 | 209.26 | 600 | 584 | 113.3 |
| C | 15 | 214 | 242065 | 1798.36 | 582 | 587 | 134.3 |
| C | 10 | 20 | 14604 | 104.39 | 582 | 587 | 134.3 |
| C | 0 | 10 | 12420 | 88.12 | 582 | 587 | 134.3 |
| D | 12 | 235 | 4468399 | 35351.45 | 520 | 504 | 126.4 |
| D | 2 | 249 | 669092 | 5290.09 | 520 | 504 | 126.4 |
| D | 13 | 249 | 91670 | 721.34 | 520 | 504 | 126.4 |
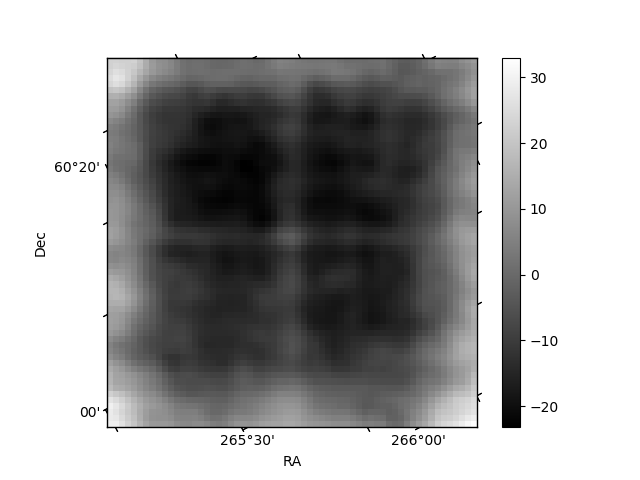
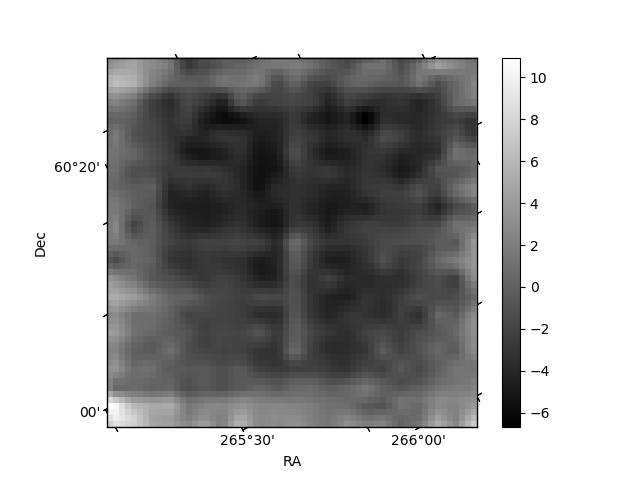
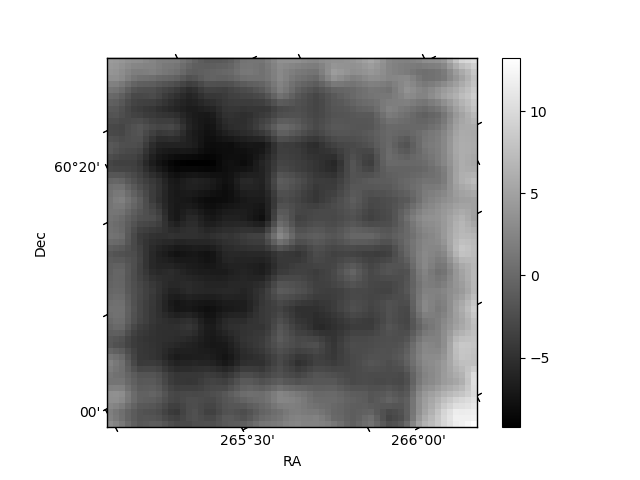
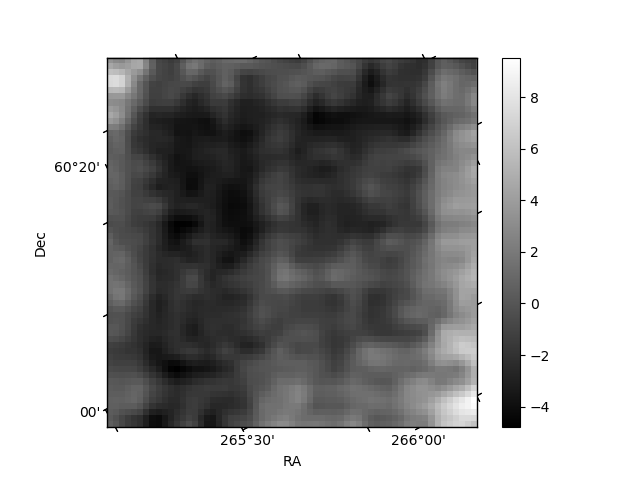
Histogram calculated using DETX and DETY for each event in the final _common_clean file
| Quadrant A | 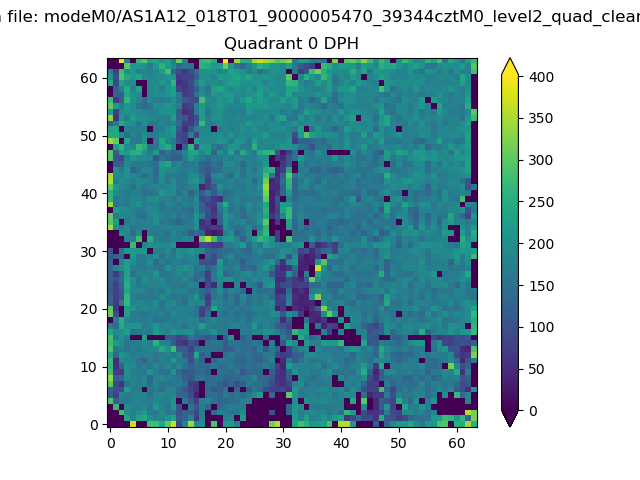 |
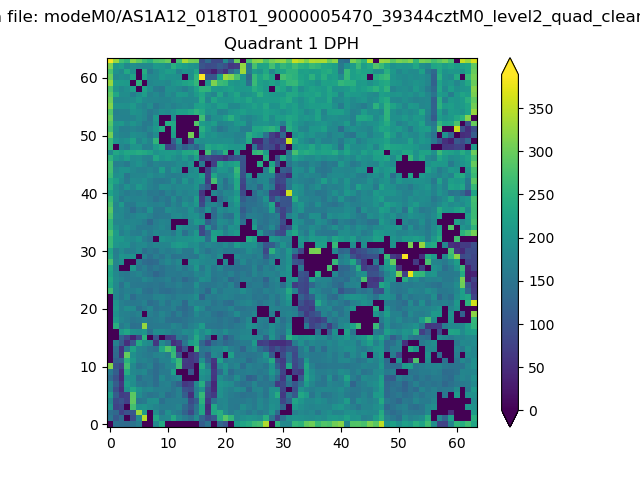 |
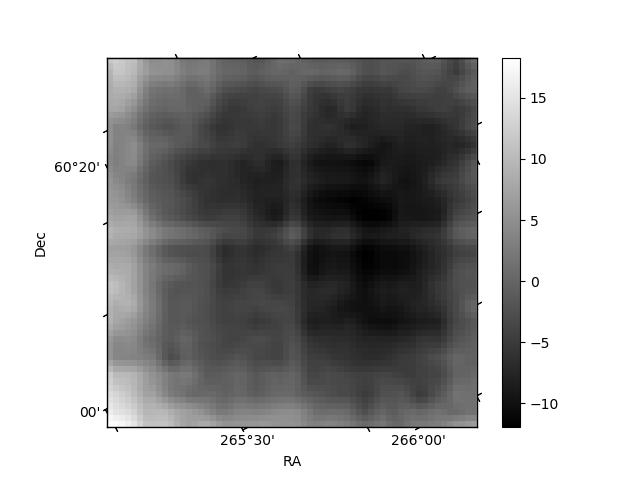
Quadrant B |
|---|---|---|---|
| Quadrant D | 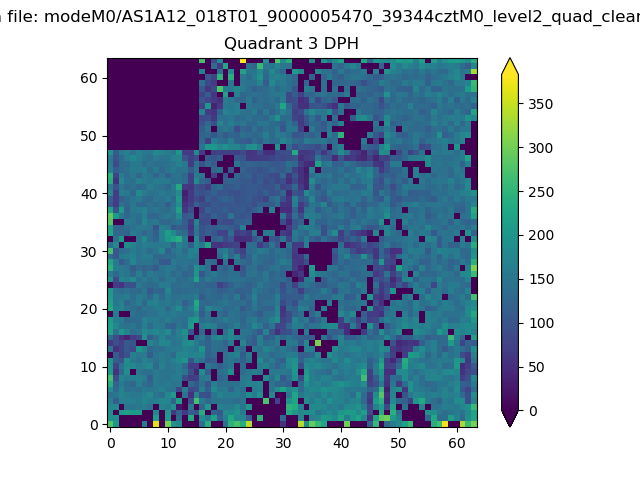 |
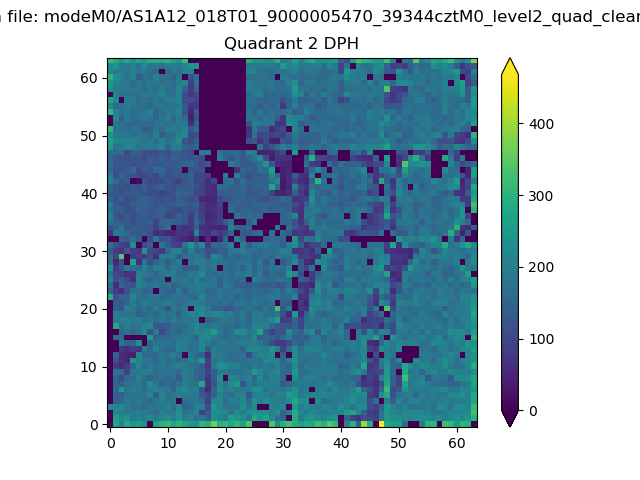 |
Quadrant C |
| Plot type | Count rate plots | Images |
|---|---|---|
| Comparison with Poisson distribution Blue bars denote a histogram of data divided into 1 sec bins. Red curve is a Poisson curve with rate = median count rate of data. |
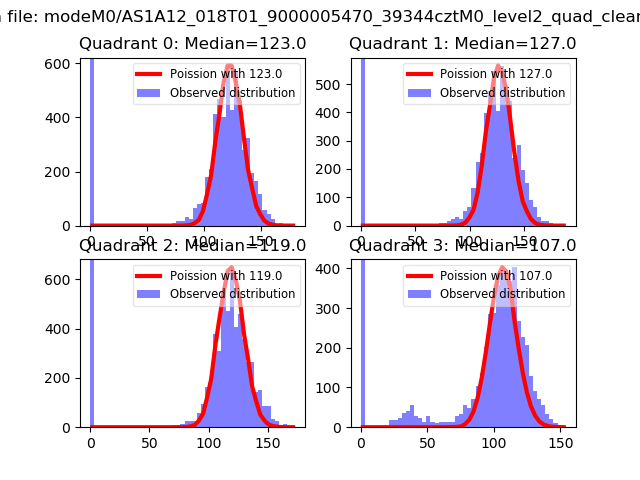 |
 |
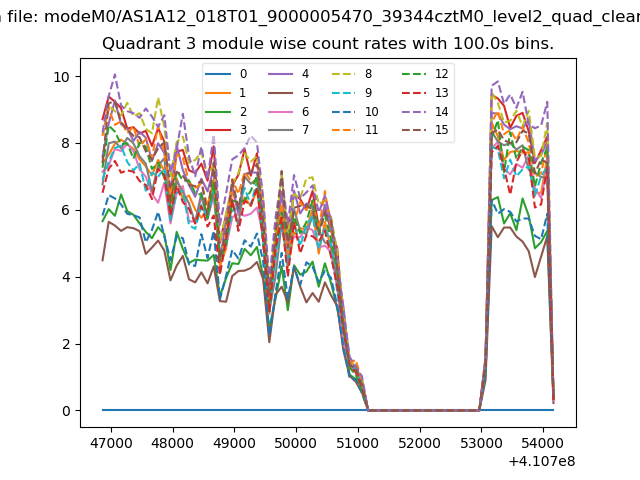
| Quadrant-wise count rates Data is divided into 100 sec bins |
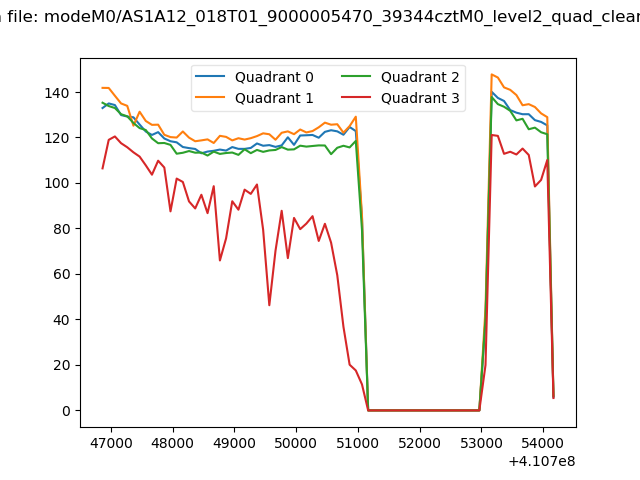 |
|
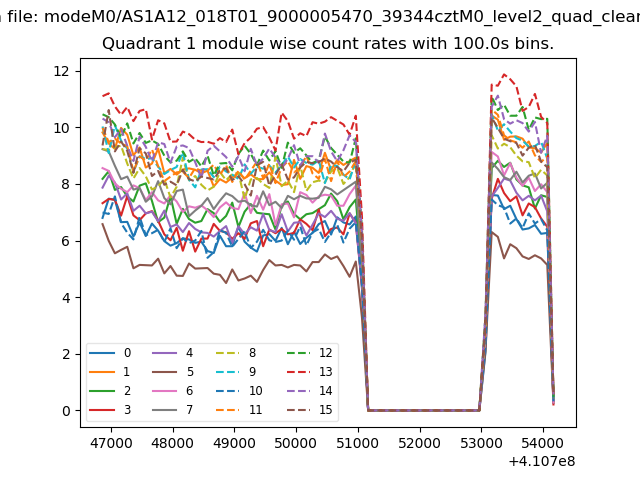
| Module-wise count rates for Quadrant A Data is divided into 100 sec bins |
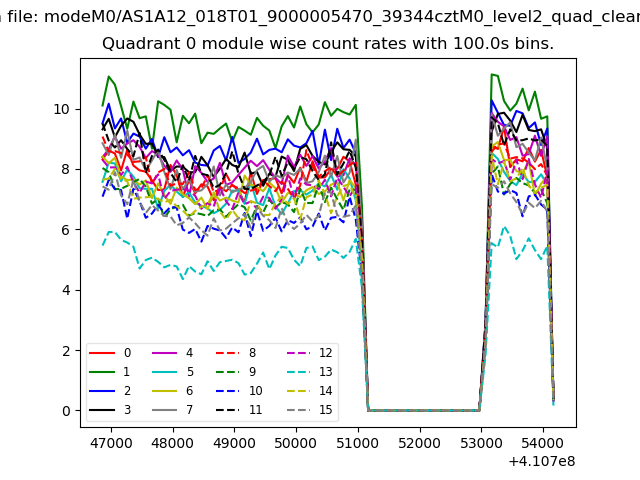 |
 |
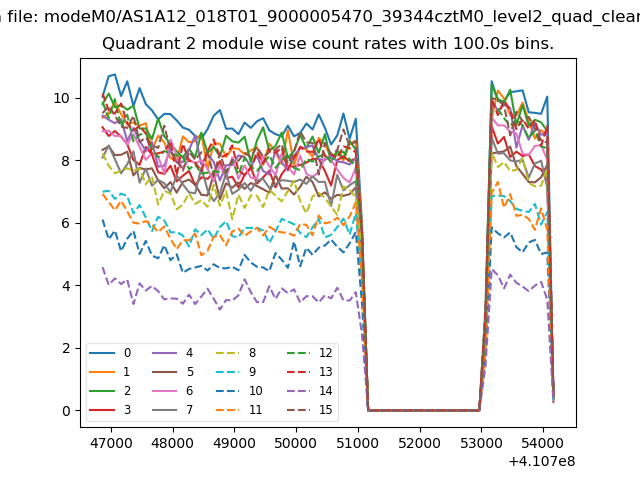
| Module-wise count rates for Quadrant B Data is divided into 100 sec bins |
 |
 |
| Module-wise count rates for Quadrant C Data is divided into 100 sec bins |
 |
 |
| Module-wise count rates for Quadrant D Data is divided into 100 sec bins |
 |
 |
| Parameter | Plot |
|---|---|
| CZT HV Monitor | 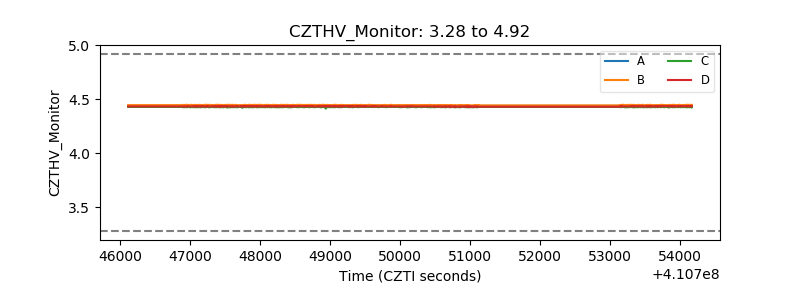 |
| D_VDD | 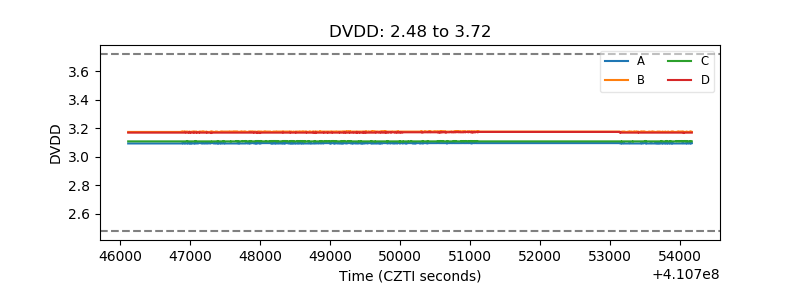 |
| Temperature 1 | 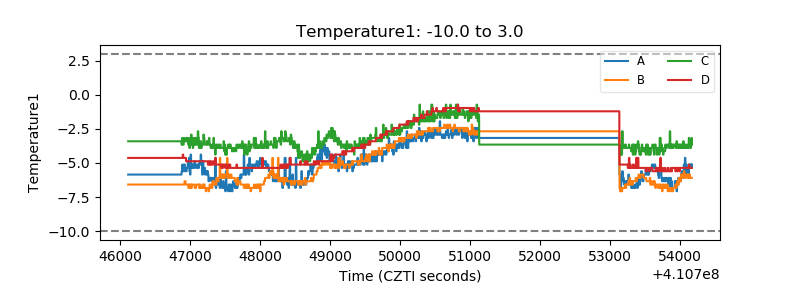 |
| Veto HV Monitor | 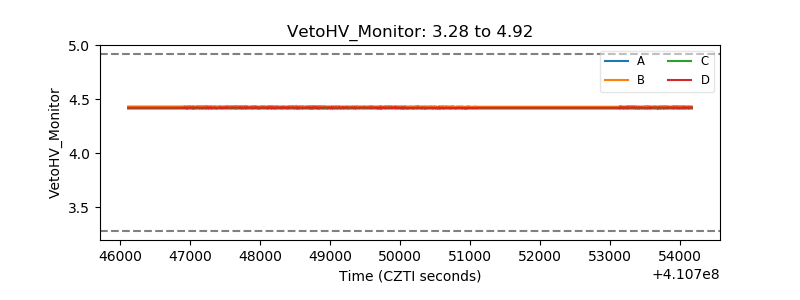 |
| Veto LLD | 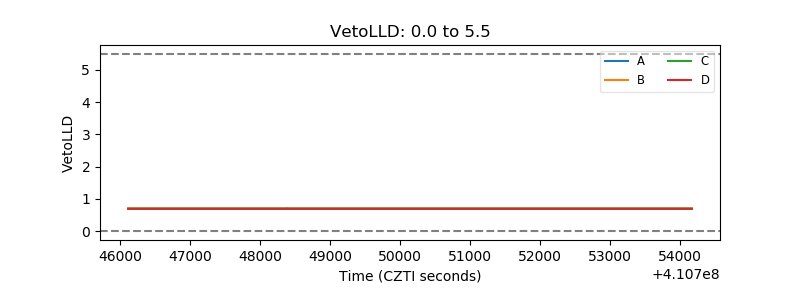 |
| Alpha Counter | 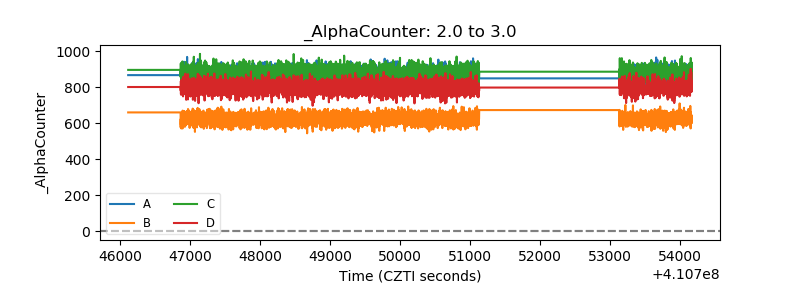 |
| _CPM_Rate | 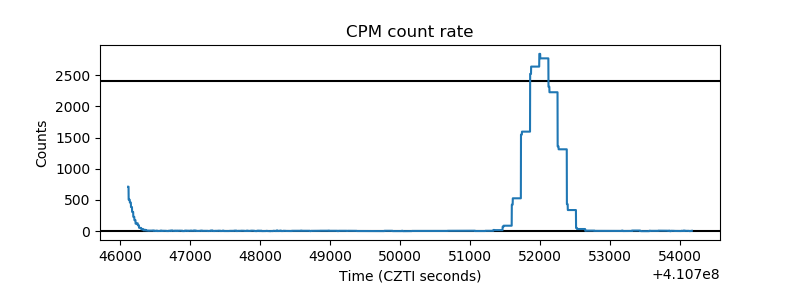 |
| CZT Counter | 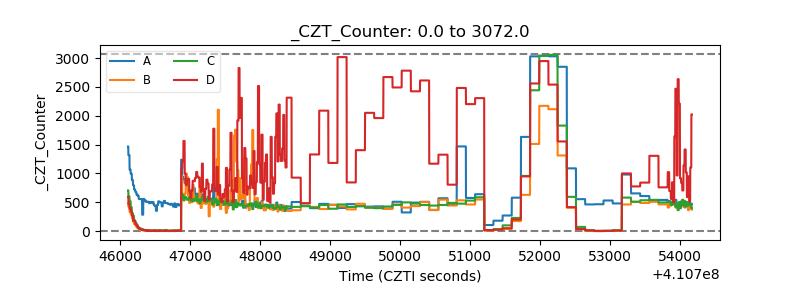 |
| +2.5 Volts monitor | 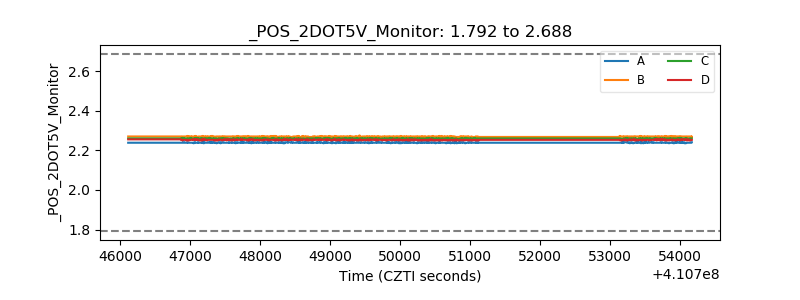 |
| +5 Volts monitor | 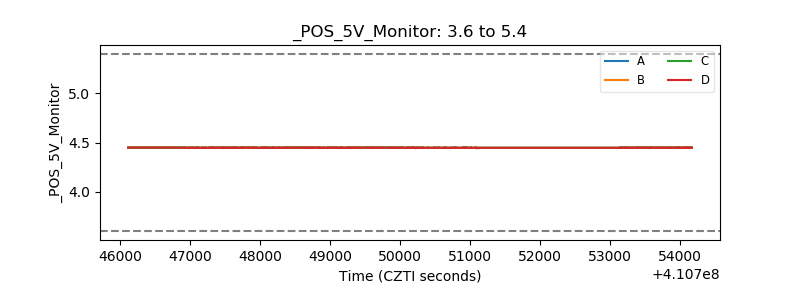 |
| _ROLL_ROT | 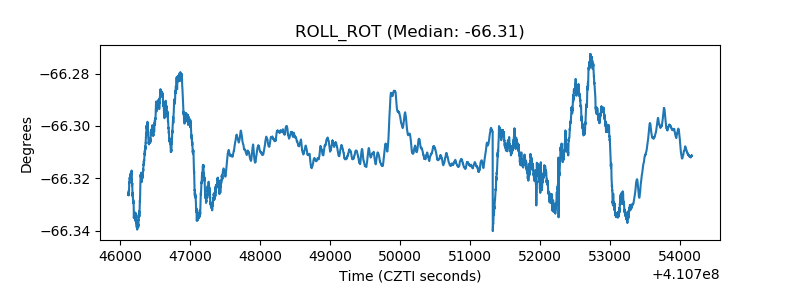 |
| _Roll_DEC | 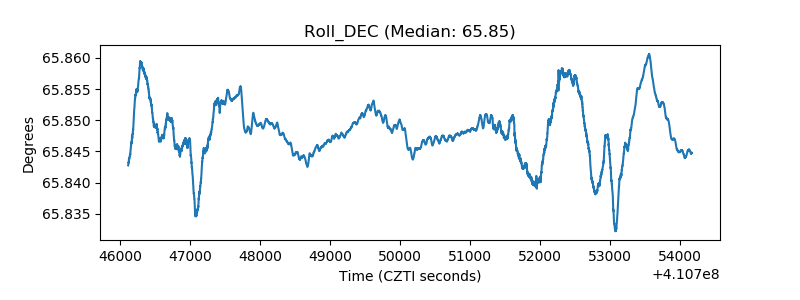 |
| _Roll_RA | 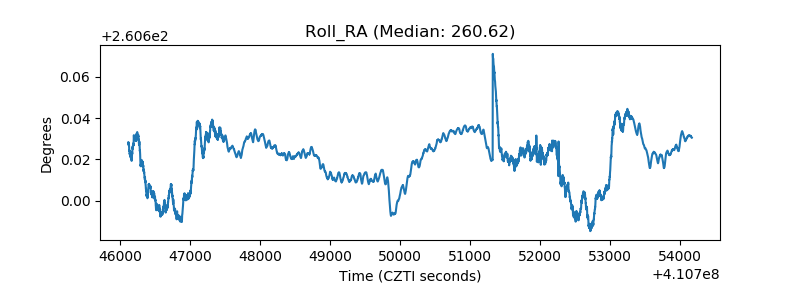 |
| Veto Counter | 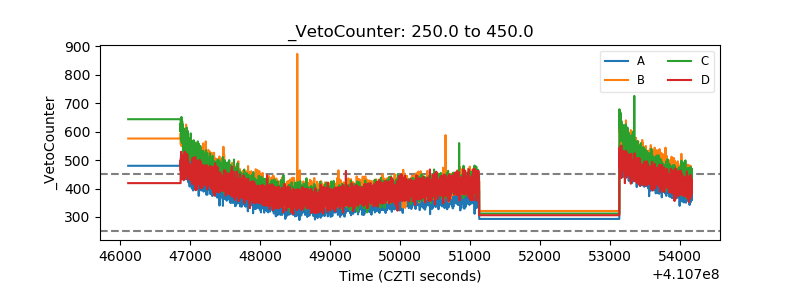 |