| Param | Original file | Final file |
|---|---|---|
| Filename | modeM0/AS1A12_018T01_9000005470_39345cztM0_level2.fits | modeM0/AS1A12_018T01_9000005470_39345cztM0_level2_quad_clean.evt |
| Size (bytes) | 385,338,240 | 88,467,840 |
| Size | 367.5 MB | 84.4 MB |
| Events in quadrant A | 2,611,349 | 616,417 |
| Events in quadrant B | 2,310,891 | 643,708 |
| Events in quadrant C | 2,389,614 | 595,494 |
| Events in quadrant D | 6,567,918 | 477,153 |
| Mode M9 | |||
|---|---|---|---|
| Quadrant | BADHDUFLAG | Total packets | Discarded packets |
| A | 0 | 31 | 0 |
| B | 0 | 31 | 0 |
| C | 0 | 31 | 0 |
| D | 0 | 32 | 0 |
| Mode SS | |||
|---|---|---|---|
| Quadrant | BADHDUFLAG | Total packets | Discarded packets |
| A | 0 | 100 | 0 |
| B | 0 | 100 | 0 |
| C | 0 | 100 | 0 |
| D | 0 | 100 | 0 |
| Mode M0 | |||
|---|---|---|---|
| Quadrant | BADHDUFLAG | Total packets | Discarded packets |
| A | 0 | 10744 | 3 |
| B | 0 | 10106 | 2 |
| C | 0 | 10091 | 2 |
| D | 0 | 22981 | 2 |
| Quadrant | Total seconds | Saturated seconds | Saturation percentage |
|---|---|---|---|
| A | 4937 | 13 | 0.263318% |
| B | 4937 | 6 | 0.121531% |
| C | 4937 | 3 | 0.060766% |
| D | 4937 | 873 | 17.682803% |
Noise dominated data is calculated using 1-second bins in cleaned event files. If a bin has >2000 counts, and if more than 50% of those come from <1% of pixels, then it is considered to be noise-dominated and hence unusable.
| Quadrant | # 1 sec bins | Bins with >0 counts | Bins with >2000 counts | High rate bins dominated by noise | Noise dominated (total time) | Noise dominated (detector-on time) | Marked lightcurve |
|---|---|---|---|---|---|---|---|
| A | 7030 | 4938 | 6 | 6 | 0.09% | 0.12% | 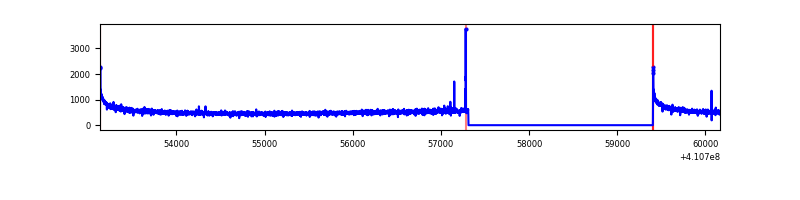 |
| B | 7030 | 4938 | 1 | 1 | 0.01% | 0.02% | 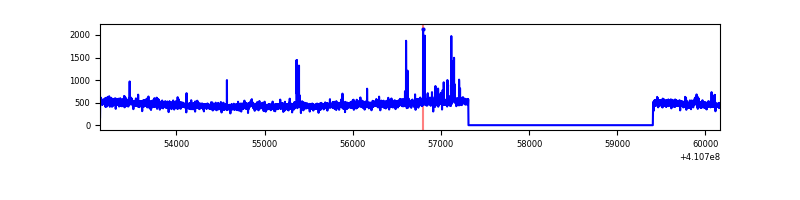 |
| C | 7030 | 4938 | 0 | 0 | 0.00% | 0.00% | 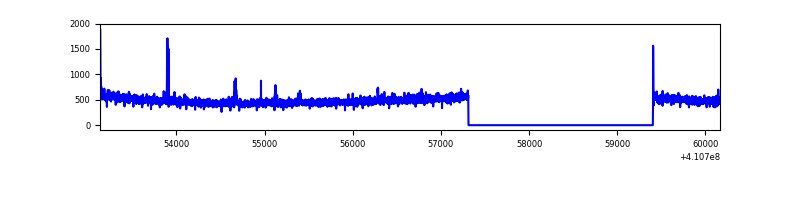 |
| D | 7030 | 4938 | 818 | 818 | 11.64% | 16.57% | 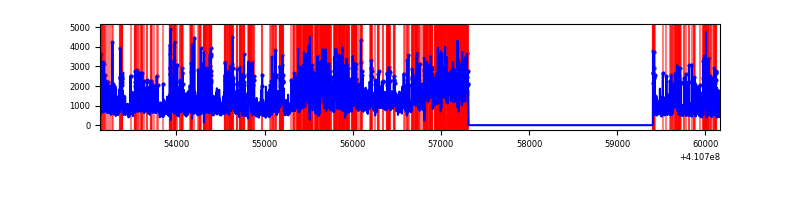 |
Top three noisy pixels from each quadrant. If the there are fewer than three noisy pixels in the level2.evt file, extra rows are filled as -1
| Pixel properties | Quadrant properties | ||||||
|---|---|---|---|---|---|---|---|
| Quadrant | DetID | PixID | Counts | Sigma | Mean | Median | Sigma |
| A | 10 | 83 | 400345 | 3499.29 | 566 | 558 | 114.2 |
| A | 13 | 248 | 16035 | 135.47 | 566 | 558 | 114.2 |
| A | 2 | 79 | 7518 | 60.92 | 566 | 558 | 114.2 |
| B | 0 | 183 | 41332 | 379.33 | 567 | 552 | 107.5 |
| B | 5 | 184 | 19479 | 176.05 | 567 | 552 | 107.5 |
| B | 12 | 111 | 13041 | 116.17 | 567 | 552 | 107.5 |
| C | 15 | 214 | 226213 | 1814.54 | 544 | 548 | 124.4 |
| C | 10 | 20 | 16663 | 129.58 | 544 | 548 | 124.4 |
| C | 0 | 10 | 11589 | 88.78 | 544 | 548 | 124.4 |
| D | 12 | 235 | 4104174 | 33178.72 | 508 | 493 | 123.7 |
| D | 2 | 249 | 245335 | 1979.57 | 508 | 493 | 123.7 |
| D | 13 | 249 | 81717 | 656.71 | 508 | 493 | 123.7 |
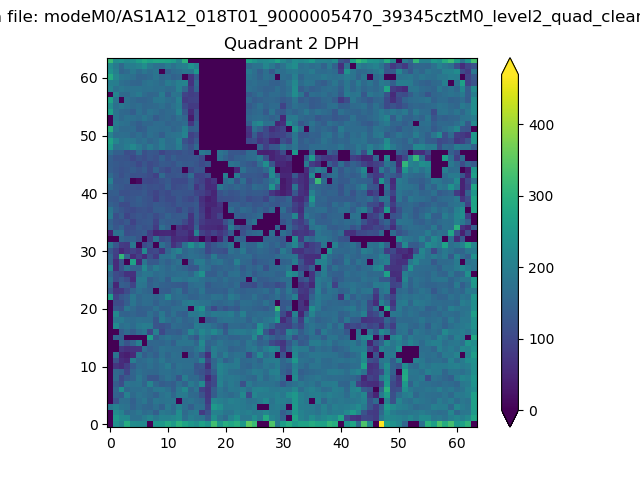
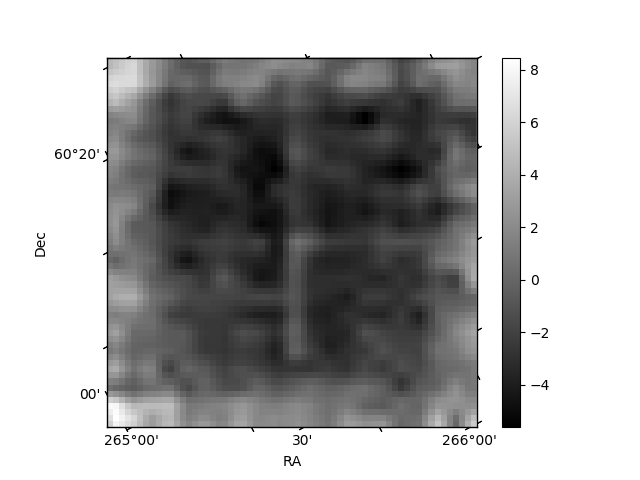
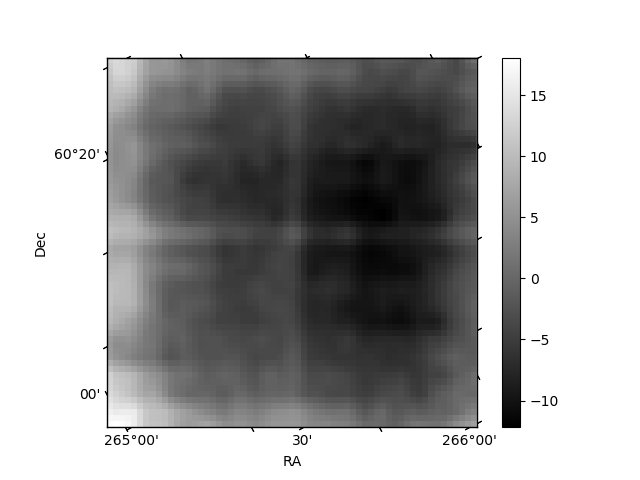
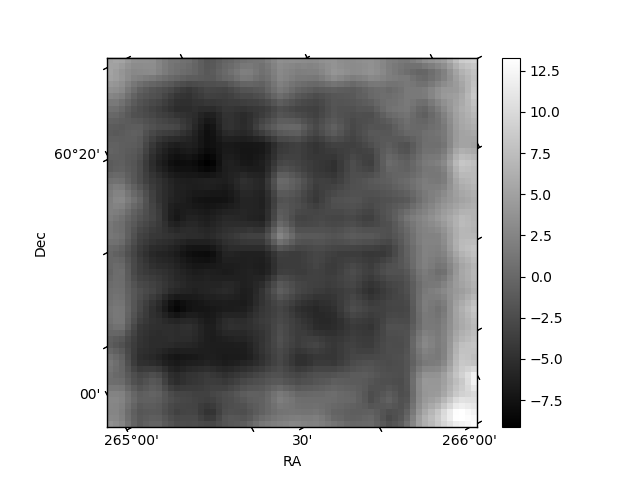
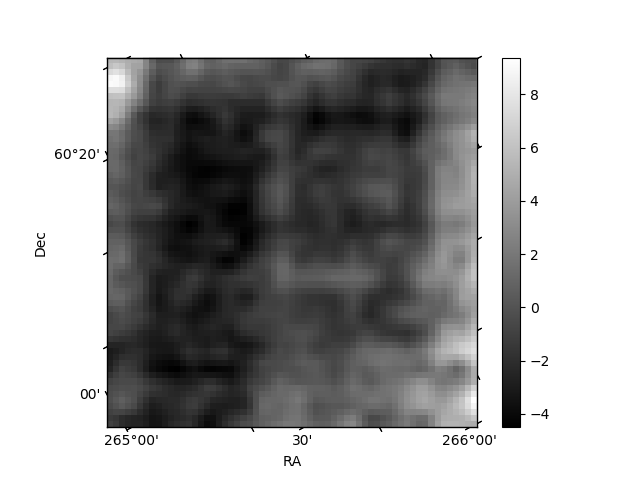
Histogram calculated using DETX and DETY for each event in the final _common_clean file
| Quadrant A | 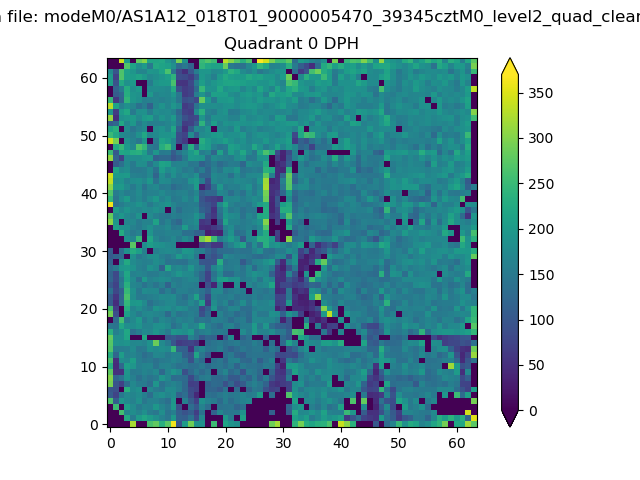 |
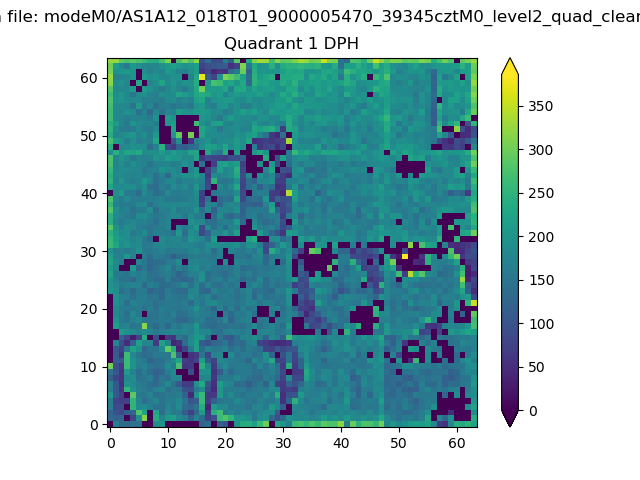 |
Quadrant B |
|---|---|---|---|
| Quadrant D | 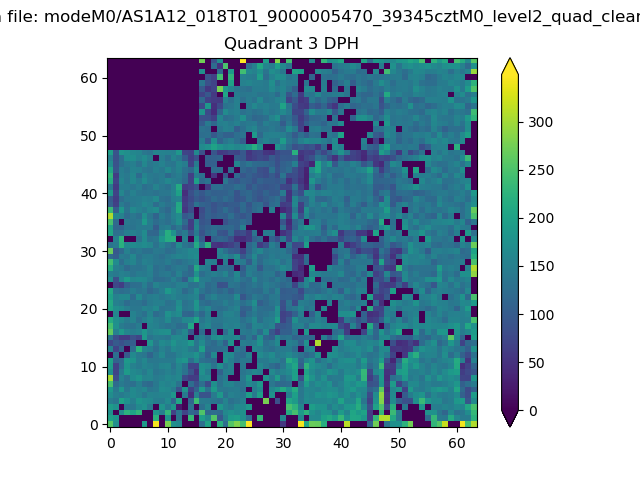 |
 |
Quadrant C |
| Plot type | Count rate plots | Images |
|---|---|---|
| Comparison with Poisson distribution Blue bars denote a histogram of data divided into 1 sec bins. Red curve is a Poisson curve with rate = median count rate of data. |
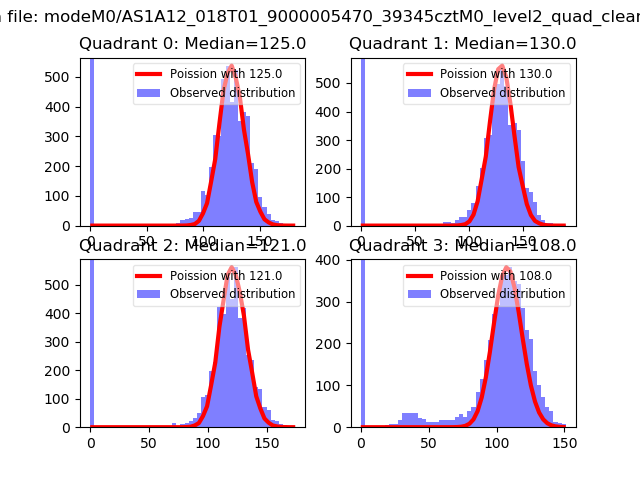 |
 |
| Quadrant-wise count rates Data is divided into 100 sec bins |
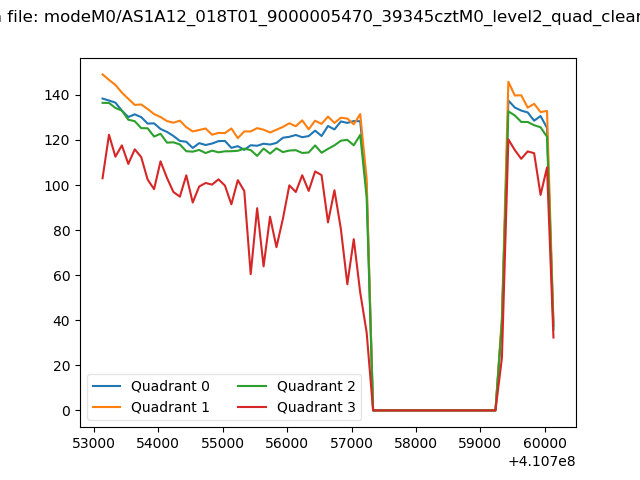 |
|
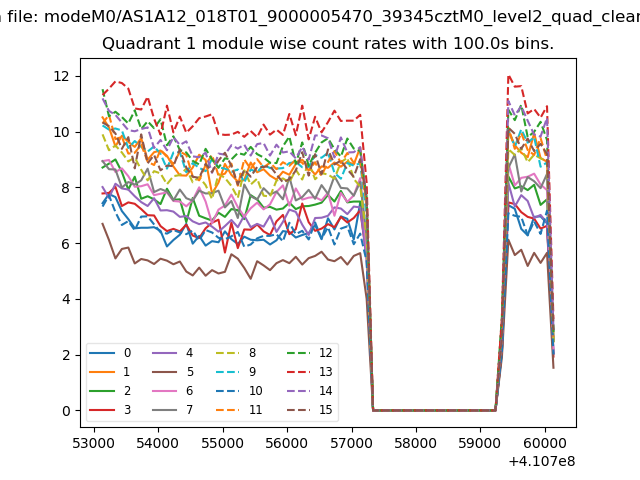
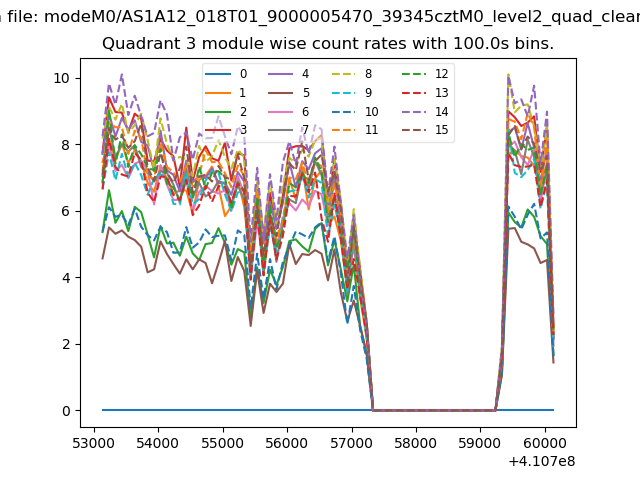
| Module-wise count rates for Quadrant A Data is divided into 100 sec bins |
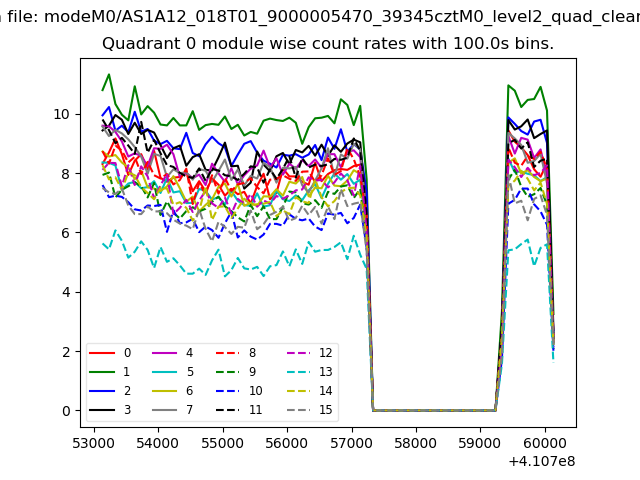 |
 |
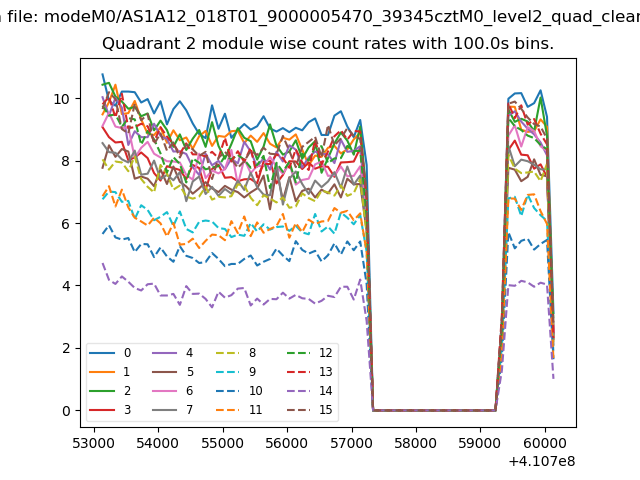
| Module-wise count rates for Quadrant B Data is divided into 100 sec bins |
 |
 |
| Module-wise count rates for Quadrant C Data is divided into 100 sec bins |
 |
 |
| Module-wise count rates for Quadrant D Data is divided into 100 sec bins |
 |
 |
| Parameter | Plot |
|---|---|
| CZT HV Monitor | 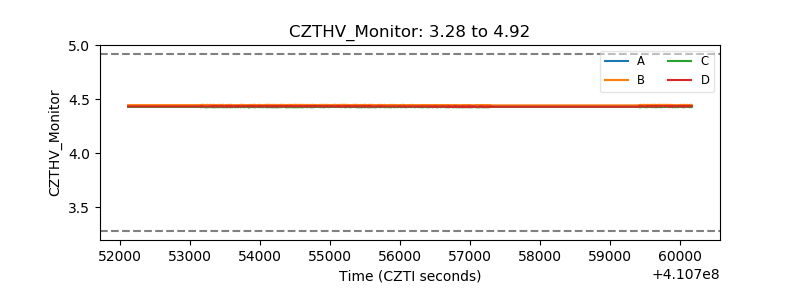 |
| D_VDD | 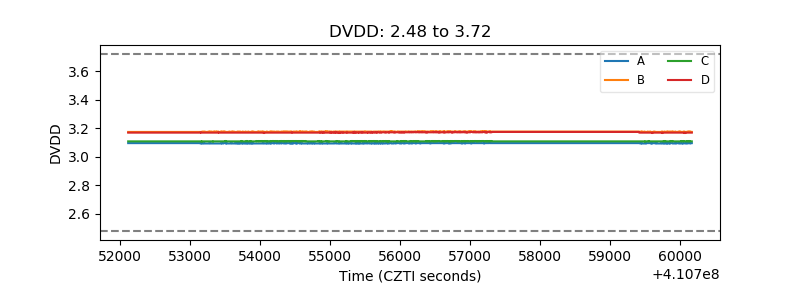 |
| Temperature 1 | 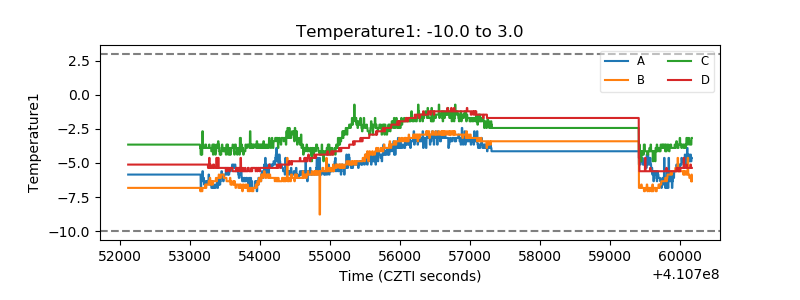 |
| Veto HV Monitor | 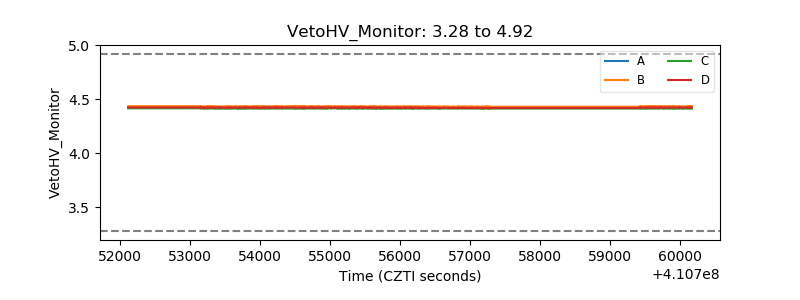 |
| Veto LLD | 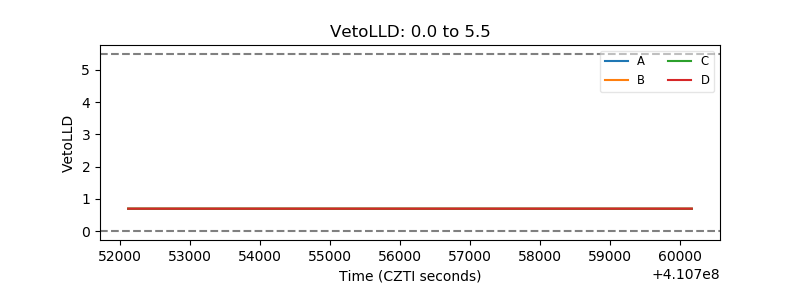 |
| Alpha Counter | 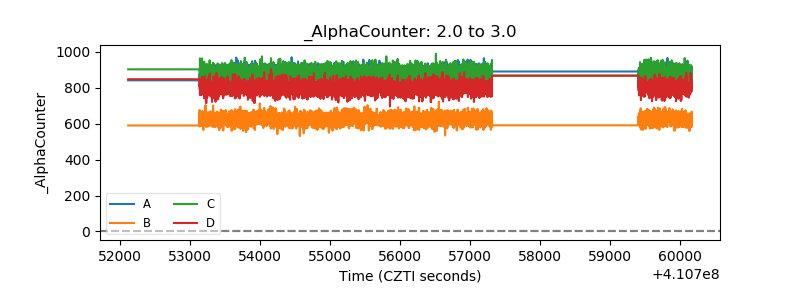 |
| _CPM_Rate | 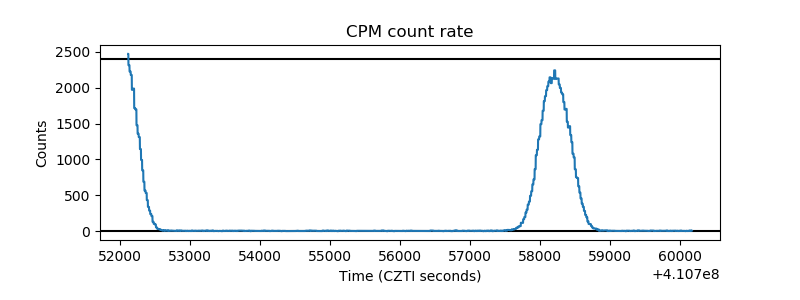 |
| CZT Counter | 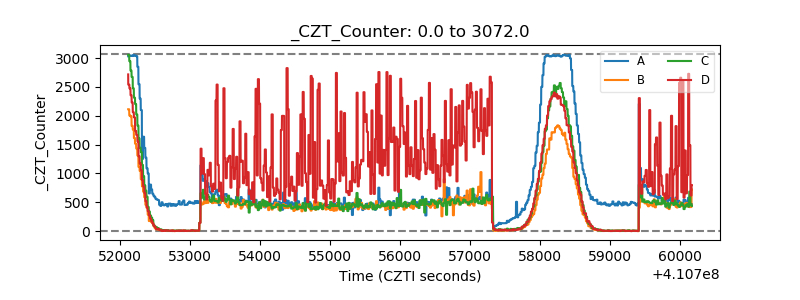 |
| +2.5 Volts monitor | 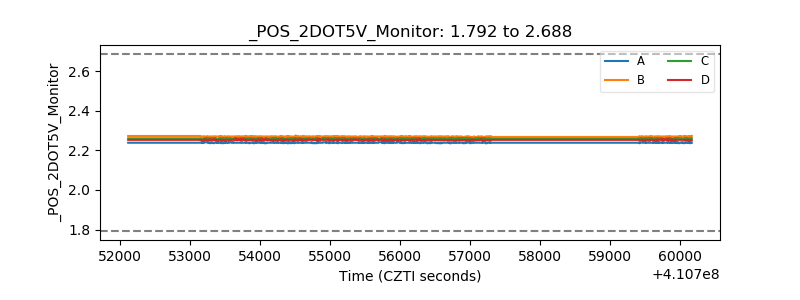 |
| +5 Volts monitor | 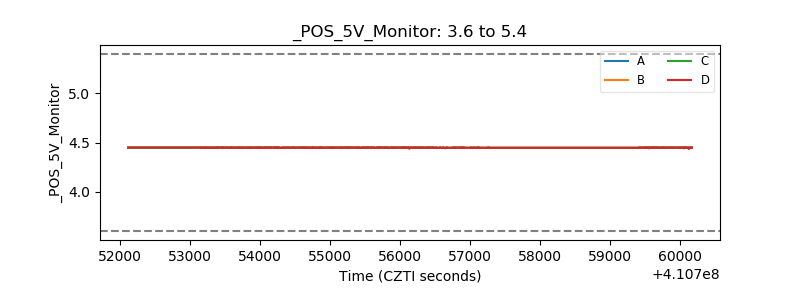 |
| _ROLL_ROT | 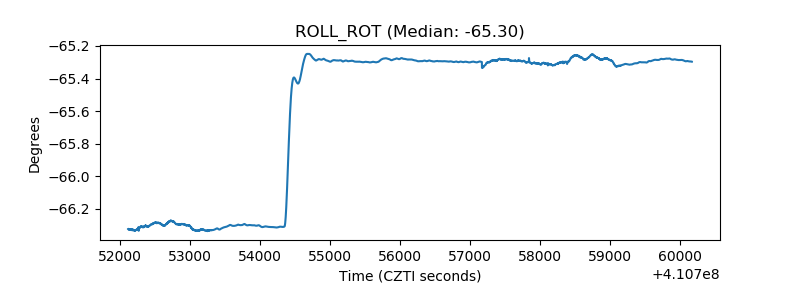 |
| _Roll_DEC | 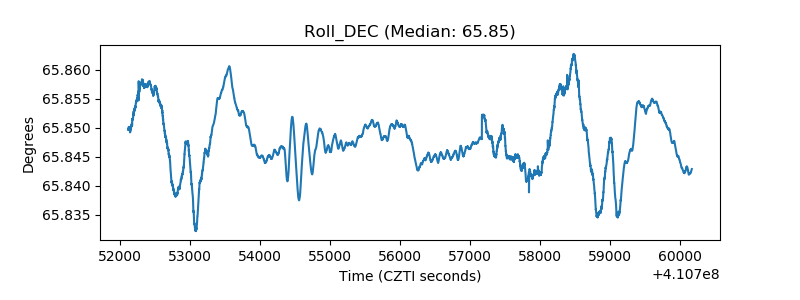 |
| _Roll_RA | 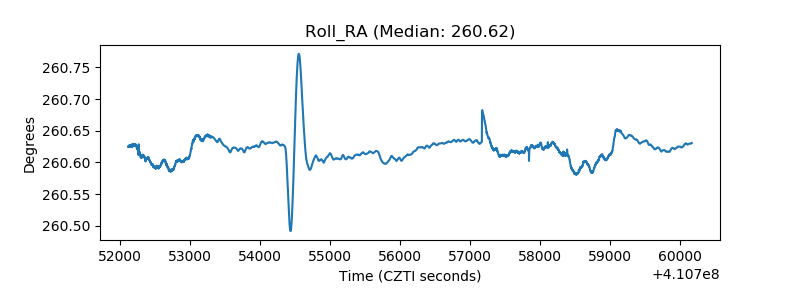 |
| Veto Counter | 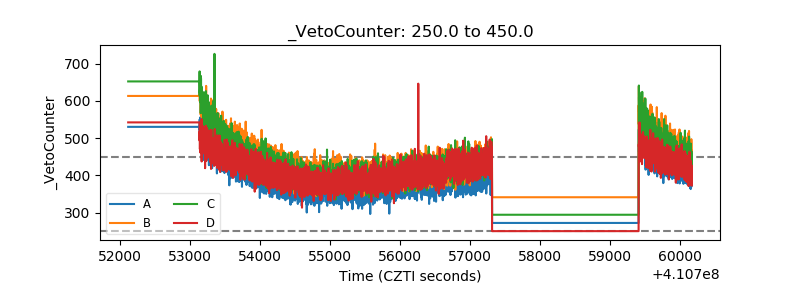 |