| Param | Original file | Final file |
|---|---|---|
| Filename | modeM0/AS1A12_018T01_9000005470_39347cztM0_level2.fits | modeM0/AS1A12_018T01_9000005470_39347cztM0_level2_quad_clean.evt |
| Size (bytes) | 712,010,880 | 148,950,720 |
| Size | 679.0 MB | 142.1 MB |
| Events in quadrant A | 4,556,853 | 1,061,313 |
| Events in quadrant B | 3,887,454 | 1,097,375 |
| Events in quadrant C | 4,746,628 | 1,009,861 |
| Events in quadrant D | 12,484,528 | 731,175 |
| Mode M9 | |||
|---|---|---|---|
| Quadrant | BADHDUFLAG | Total packets | Discarded packets |
| A | 0 | 42 | 0 |
| B | 0 | 42 | 0 |
| C | 0 | 42 | 0 |
| D | 0 | 42 | 0 |
| Mode SS | |||
|---|---|---|---|
| Quadrant | BADHDUFLAG | Total packets | Discarded packets |
| A | 0 | 182 | 0 |
| B | 0 | 182 | 0 |
| C | 0 | 182 | 0 |
| D | 0 | 182 | 0 |
| Mode M0 | |||
|---|---|---|---|
| Quadrant | BADHDUFLAG | Total packets | Discarded packets |
| A | 0 | 18683 | 3 |
| B | 0 | 17640 | 2 |
| C | 0 | 19617 | 2 |
| D | 0 | 43193 | 2 |
| Quadrant | Total seconds | Saturated seconds | Saturation percentage |
|---|---|---|---|
| A | 8788 | 22 | 0.250341% |
| B | 8788 | 7 | 0.079654% |
| C | 8788 | 20 | 0.227583% |
| D | 8788 | 2265 | 25.773782% |
Noise dominated data is calculated using 1-second bins in cleaned event files. If a bin has >2000 counts, and if more than 50% of those come from <1% of pixels, then it is considered to be noise-dominated and hence unusable.
| Quadrant | # 1 sec bins | Bins with >0 counts | Bins with >2000 counts | High rate bins dominated by noise | Noise dominated (total time) | Noise dominated (detector-on time) | Marked lightcurve |
|---|---|---|---|---|---|---|---|
| A | 13062 | 8790 | 12 | 12 | 0.09% | 0.14% | 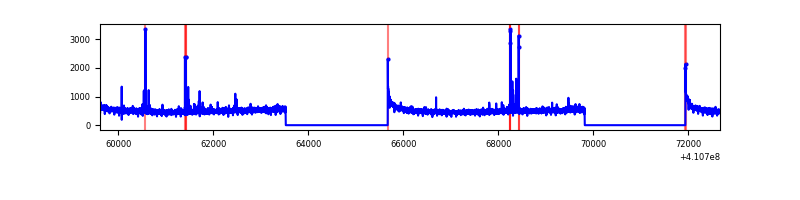 |
| B | 13062 | 8790 | 0 | 0 | 0.00% | 0.00% | 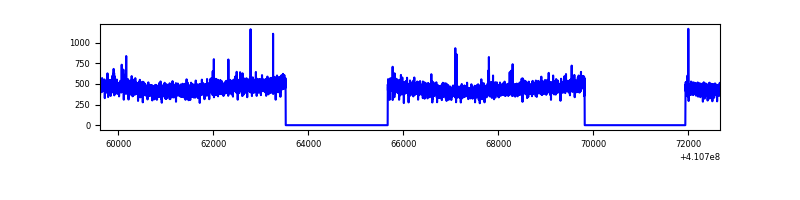 |
| C | 13062 | 8790 | 12 | 12 | 0.09% | 0.14% | 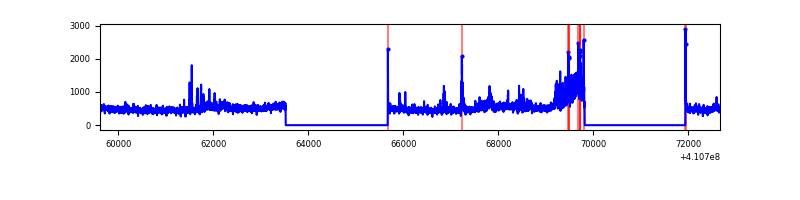 |
| D | 13062 | 8790 | 2029 | 2029 | 15.53% | 23.08% | 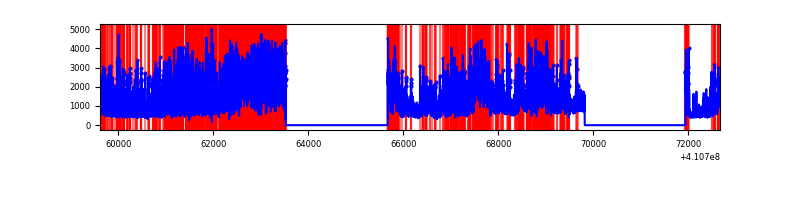 |
Top three noisy pixels from each quadrant. If the there are fewer than three noisy pixels in the level2.evt file, extra rows are filled as -1
| Pixel properties | Quadrant properties | ||||||
|---|---|---|---|---|---|---|---|
| Quadrant | DetID | PixID | Counts | Sigma | Mean | Median | Sigma |
| A | 10 | 83 | 613160 | 3090.2 | 991 | 976 | 198.1 |
| A | 13 | 248 | 99226 | 495.95 | 991 | 976 | 198.1 |
| A | 13 | 254 | 11520 | 53.22 | 991 | 976 | 198.1 |
| B | 12 | 111 | 23060 | 119.32 | 981 | 957 | 185.2 |
| B | 11 | 111 | 21267 | 109.64 | 981 | 957 | 185.2 |
| B | 14 | 111 | 20596 | 106.02 | 981 | 957 | 185.2 |
| C | 9 | 187 | 625379 | 2875.7 | 945 | 951 | 217.1 |
| C | 15 | 214 | 394702 | 1813.36 | 945 | 951 | 217.1 |
| C | 0 | 10 | 22070 | 97.26 | 945 | 951 | 217.1 |
| D | 12 | 235 | 8136574 | 39539.13 | 851 | 827 | 205.8 |
| D | 12 | 233 | 536876 | 2605.16 | 851 | 827 | 205.8 |
| D | 2 | 249 | 253318 | 1227.09 | 851 | 827 | 205.8 |
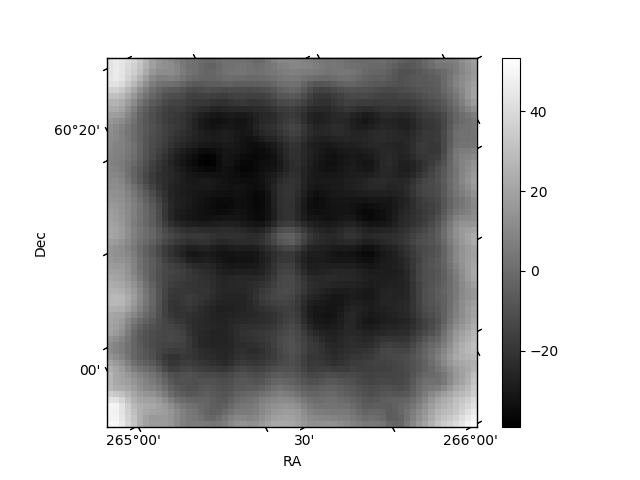
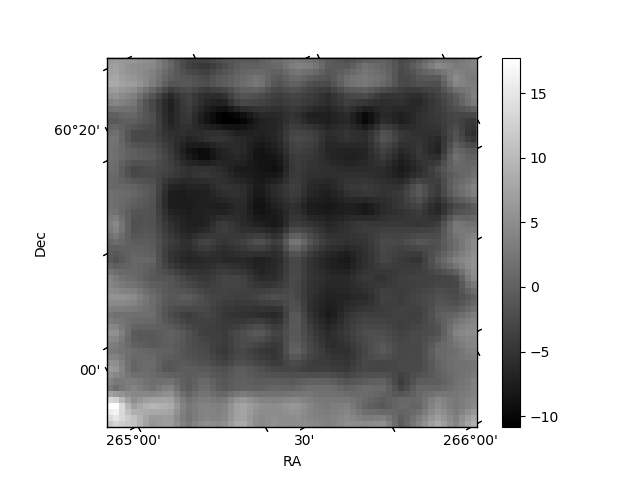
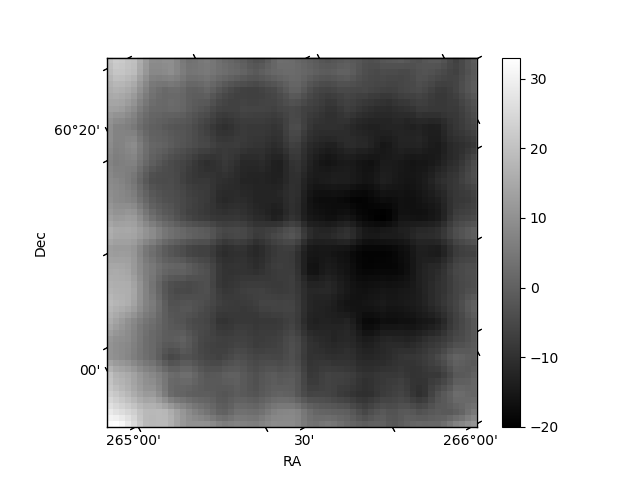
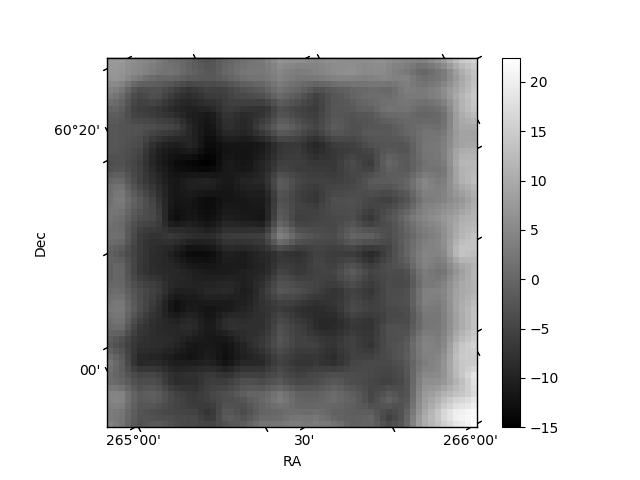
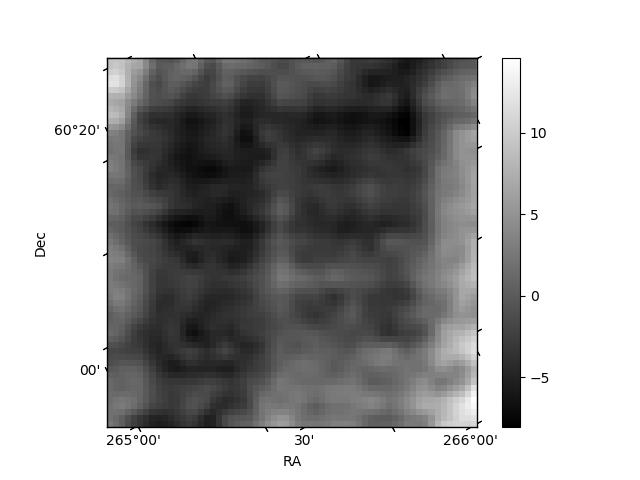
Histogram calculated using DETX and DETY for each event in the final _common_clean file
| Quadrant A | 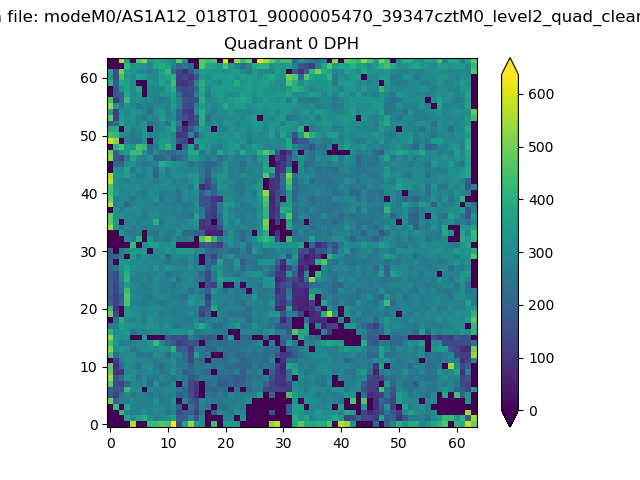 |
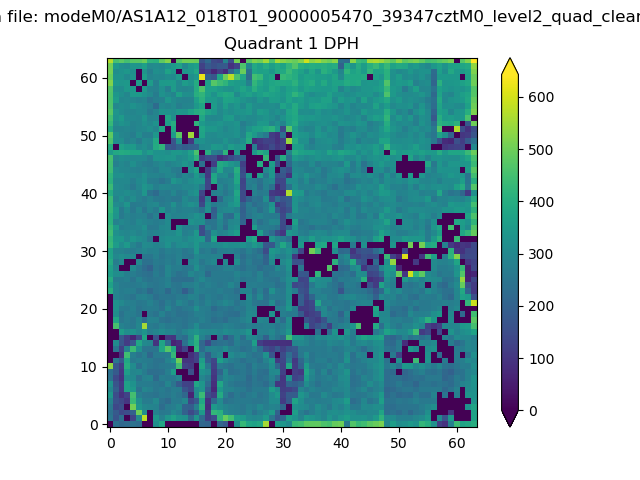 |
Quadrant B |
|---|---|---|---|
| Quadrant D | 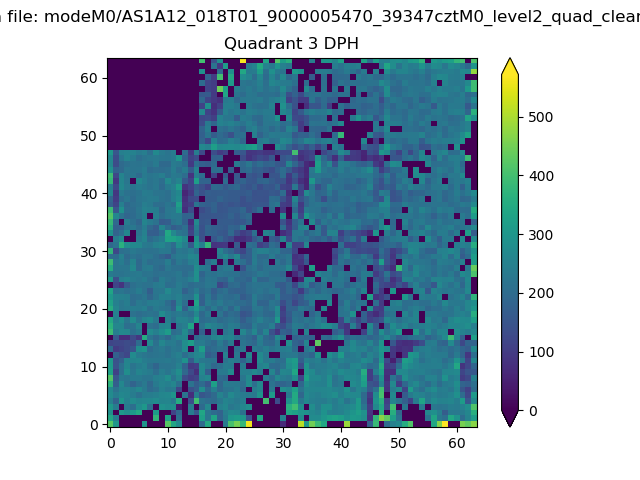 |
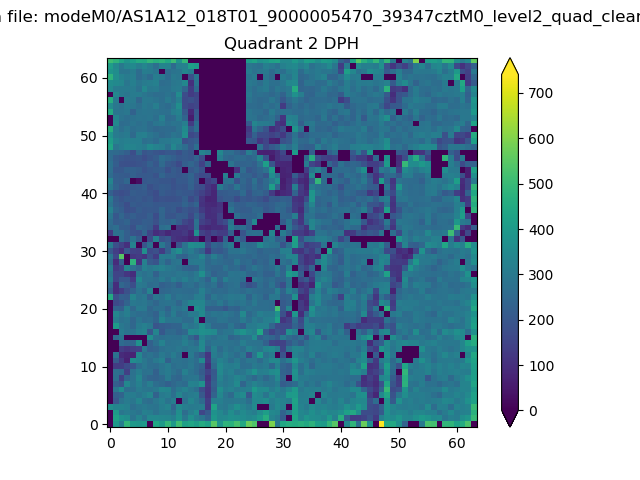 |
Quadrant C |
| Plot type | Count rate plots | Images |
|---|---|---|
| Comparison with Poisson distribution Blue bars denote a histogram of data divided into 1 sec bins. Red curve is a Poisson curve with rate = median count rate of data. |
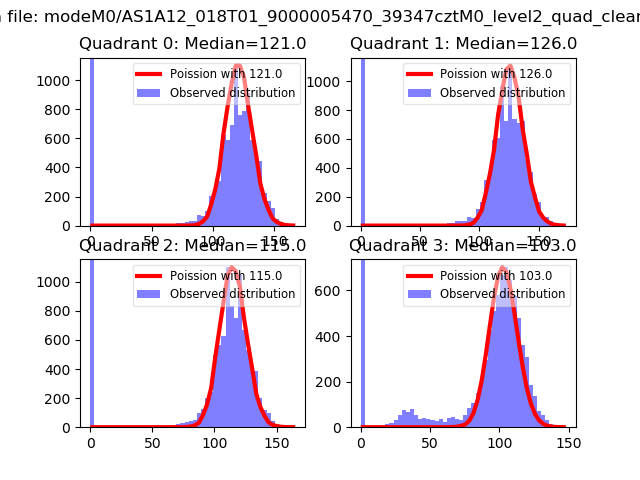 |
 |
| Quadrant-wise count rates Data is divided into 100 sec bins |
 |
|
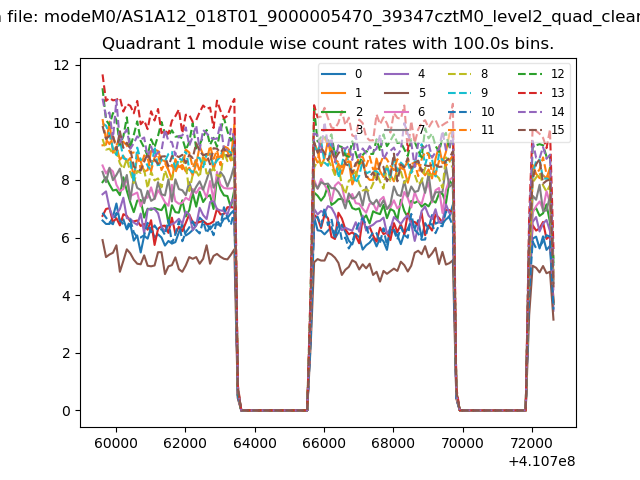
| Module-wise count rates for Quadrant A Data is divided into 100 sec bins |
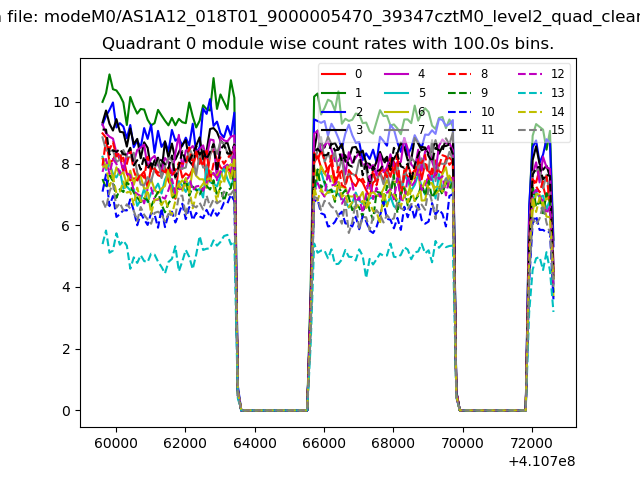 |
 |
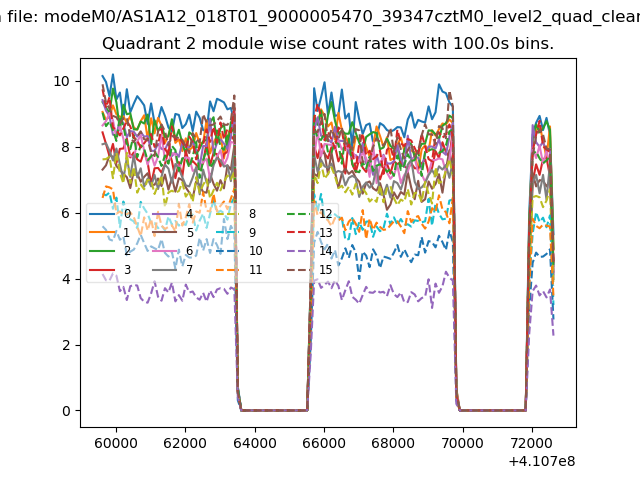
| Module-wise count rates for Quadrant B Data is divided into 100 sec bins |
 |
 |
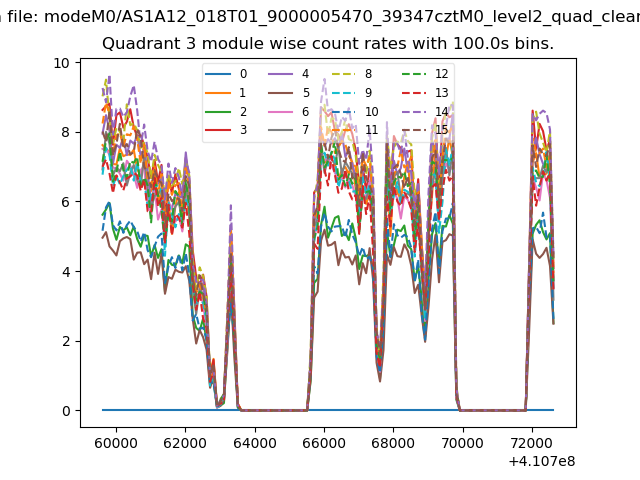
| Module-wise count rates for Quadrant C Data is divided into 100 sec bins |
 |
 |
| Module-wise count rates for Quadrant D Data is divided into 100 sec bins |
 |
 |
| Parameter | Plot |
|---|---|
| CZT HV Monitor | 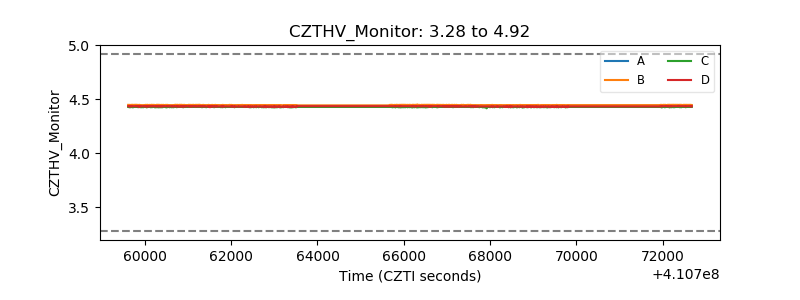 |
| D_VDD | 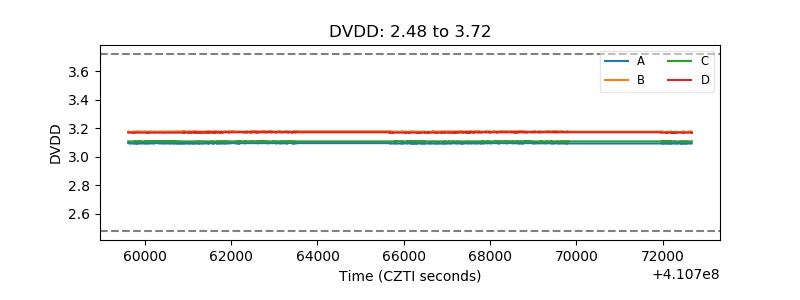 |
| Temperature 1 | 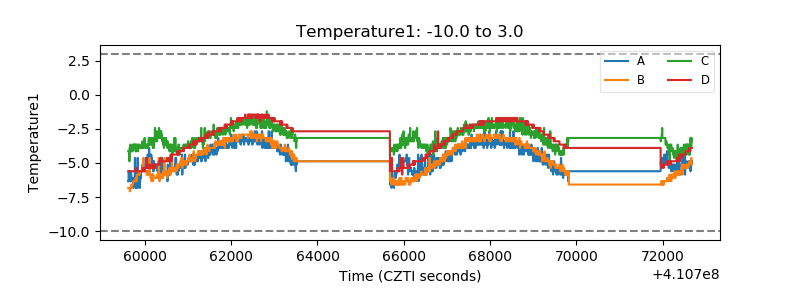 |
| Veto HV Monitor | 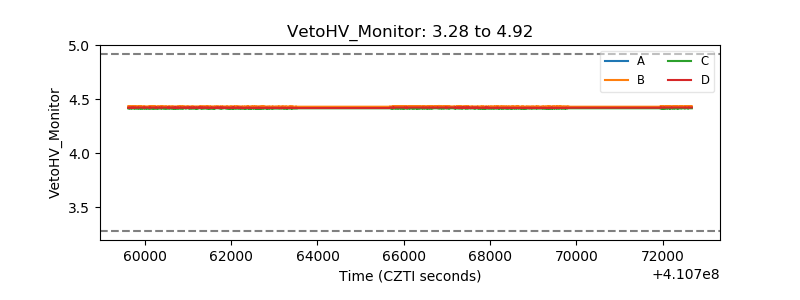 |
| Veto LLD | 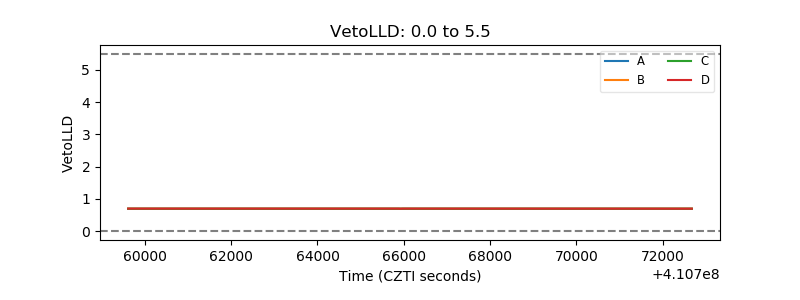 |
| Alpha Counter | 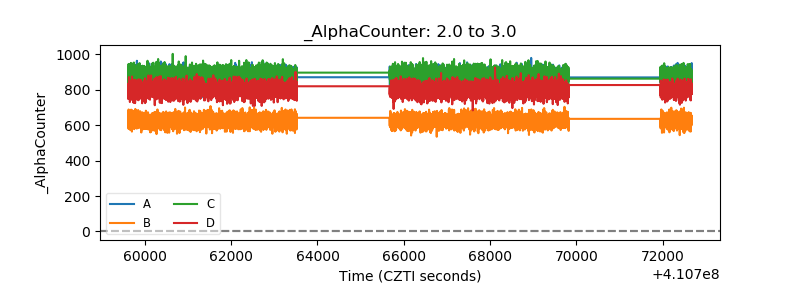 |
| _CPM_Rate | 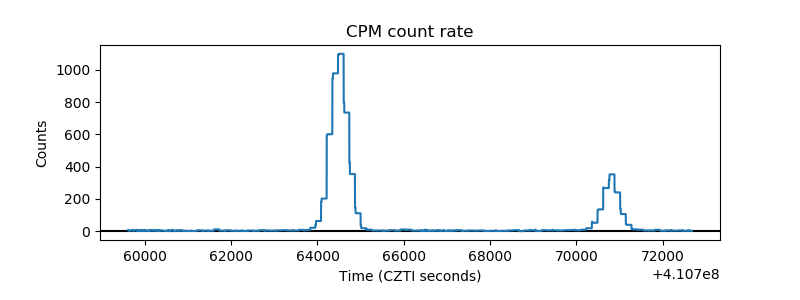 |
| CZT Counter | 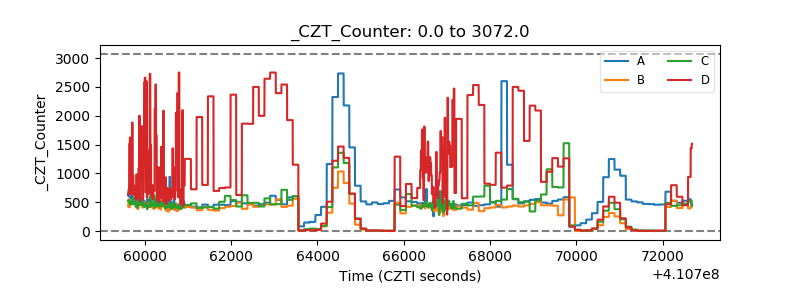 |
| +2.5 Volts monitor | 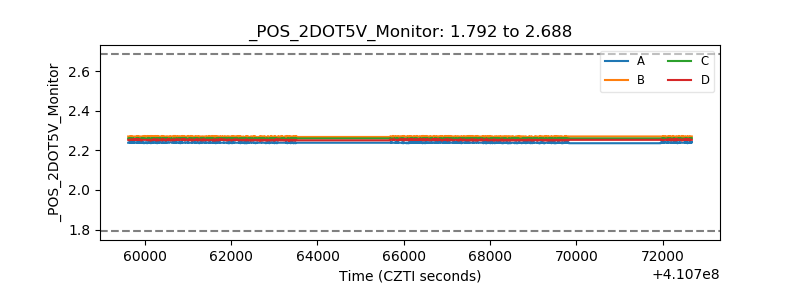 |
| +5 Volts monitor | 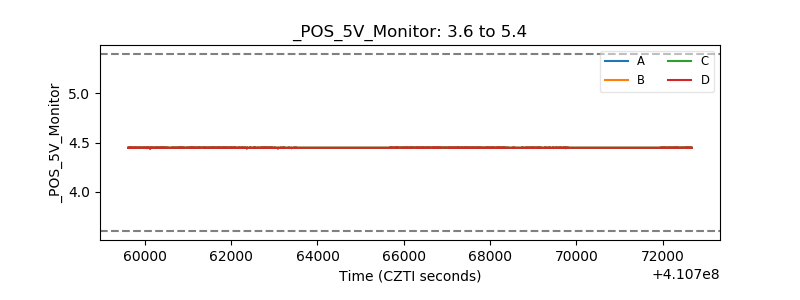 |
| _ROLL_ROT | 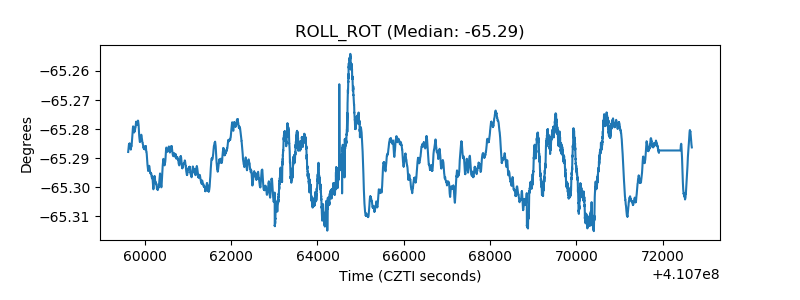 |
| _Roll_DEC | 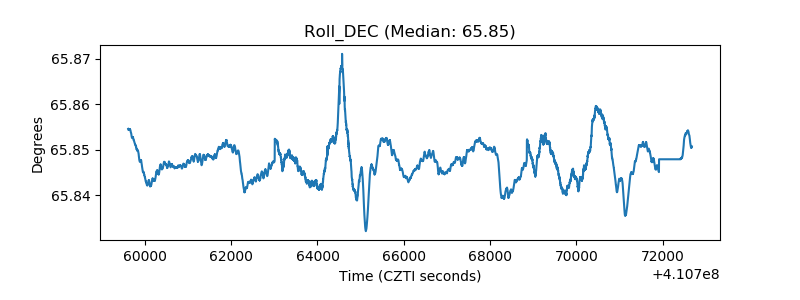 |
| _Roll_RA | 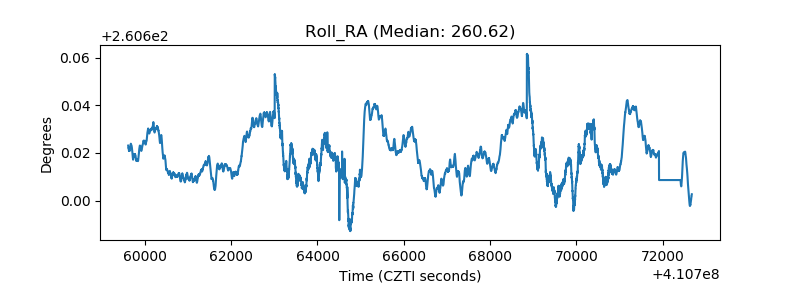 |
| Veto Counter | 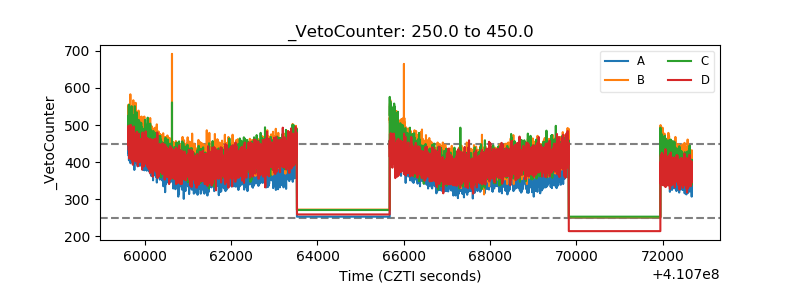 |