| Param | Original file | Final file |
|---|---|---|
| Filename | modeM0/AS1A12_018T01_9000005470_39348cztM0_level2.fits | modeM0/AS1A12_018T01_9000005470_39348cztM0_level2_quad_clean.evt |
| Size (bytes) | 421,974,720 | 83,183,040 |
| Size | 402.4 MB | 79.3 MB |
| Events in quadrant A | 2,618,026 | 590,100 |
| Events in quadrant B | 2,225,668 | 605,453 |
| Events in quadrant C | 2,490,838 | 561,974 |
| Events in quadrant D | 7,885,636 | 400,959 |
| Mode M9 | |||
|---|---|---|---|
| Quadrant | BADHDUFLAG | Total packets | Discarded packets |
| A | 0 | 24 | 0 |
| B | 0 | 24 | 0 |
| C | 0 | 24 | 0 |
| D | 0 | 25 | 0 |
| Mode SS | |||
|---|---|---|---|
| Quadrant | BADHDUFLAG | Total packets | Discarded packets |
| A | 0 | 104 | 0 |
| B | 0 | 104 | 0 |
| C | 0 | 104 | 0 |
| D | 0 | 104 | 0 |
| Mode M0 | |||
|---|---|---|---|
| Quadrant | BADHDUFLAG | Total packets | Discarded packets |
| A | 0 | 10841 | 3 |
| B | 0 | 10334 | 2 |
| C | 0 | 10685 | 2 |
| D | 0 | 27000 | 2 |
| Quadrant | Total seconds | Saturated seconds | Saturation percentage |
|---|---|---|---|
| A | 5142 | 8 | 0.155581% |
| B | 5142 | 8 | 0.155581% |
| C | 5142 | 12 | 0.233372% |
| D | 5142 | 1531 | 29.774407% |
Noise dominated data is calculated using 1-second bins in cleaned event files. If a bin has >2000 counts, and if more than 50% of those come from <1% of pixels, then it is considered to be noise-dominated and hence unusable.
| Quadrant | # 1 sec bins | Bins with >0 counts | Bins with >2000 counts | High rate bins dominated by noise | Noise dominated (total time) | Noise dominated (detector-on time) | Marked lightcurve |
|---|---|---|---|---|---|---|---|
| A | 7056 | 5143 | 3 | 3 | 0.04% | 0.06% | 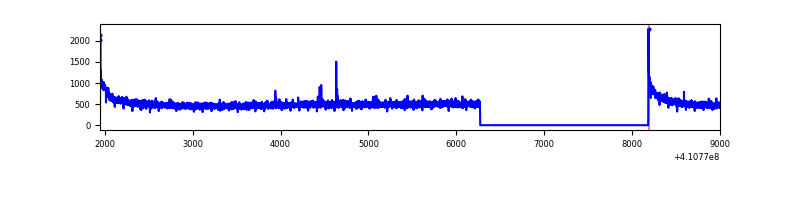 |
| B | 7056 | 5143 | 2 | 2 | 0.03% | 0.04% | 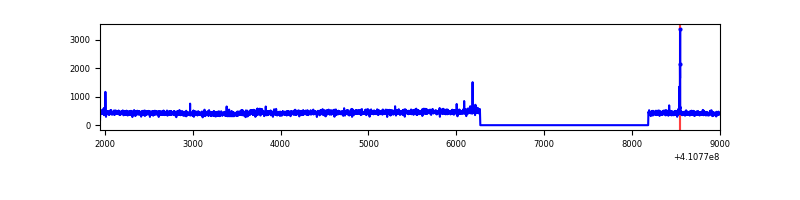 |
| C | 7056 | 5143 | 3 | 3 | 0.04% | 0.06% | 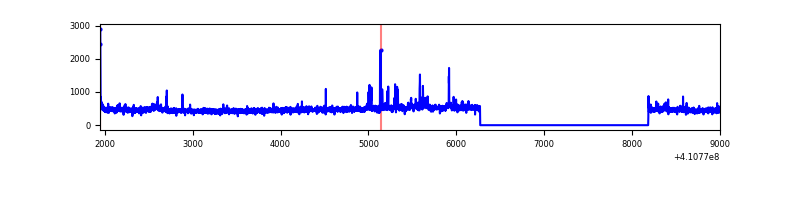 |
| D | 7056 | 5143 | 1348 | 1348 | 19.10% | 26.21% | 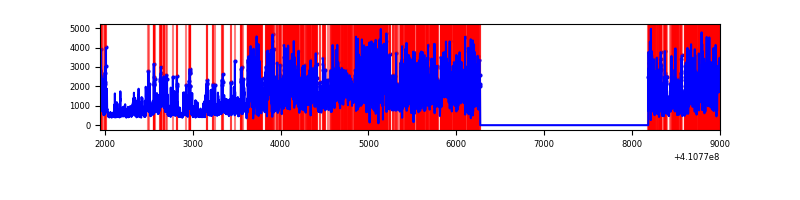 |
Top three noisy pixels from each quadrant. If the there are fewer than three noisy pixels in the level2.evt file, extra rows are filled as -1
| Pixel properties | Quadrant properties | ||||||
|---|---|---|---|---|---|---|---|
| Quadrant | DetID | PixID | Counts | Sigma | Mean | Median | Sigma |
| A | 10 | 83 | 415105 | 3635.82 | 564 | 552 | 114.0 |
| A | 13 | 248 | 10609 | 88.2 | 564 | 552 | 114.0 |
| A | 13 | 254 | 7855 | 64.05 | 564 | 552 | 114.0 |
| B | 5 | 172 | 22298 | 201.94 | 558 | 542 | 107.7 |
| B | 12 | 111 | 13361 | 118.99 | 558 | 542 | 107.7 |
| B | 11 | 111 | 12550 | 111.46 | 558 | 542 | 107.7 |
| C | 15 | 214 | 236407 | 1881.3 | 541 | 543 | 125.4 |
| C | 9 | 187 | 115706 | 918.56 | 541 | 543 | 125.4 |
| C | 0 | 10 | 12616 | 96.3 | 541 | 543 | 125.4 |
| D | 12 | 235 | 5351701 | 45662.07 | 482 | 467 | 117.2 |
| D | 2 | 249 | 474229 | 4042.61 | 482 | 467 | 117.2 |
| D | 13 | 249 | 91122 | 773.56 | 482 | 467 | 117.2 |
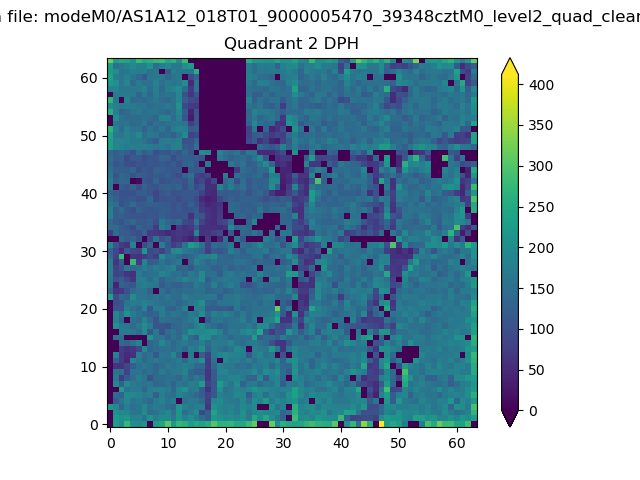
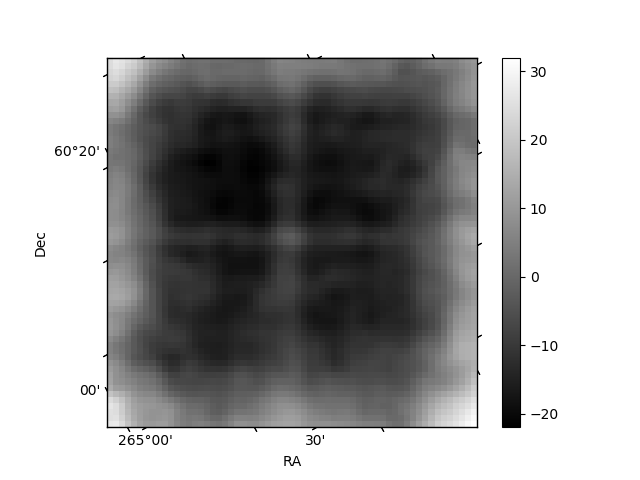
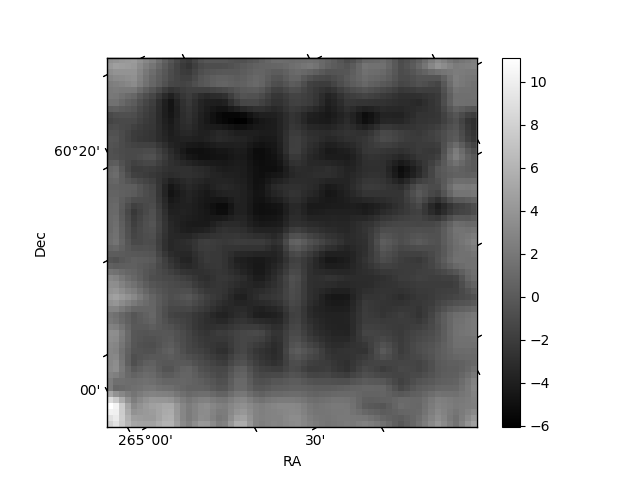
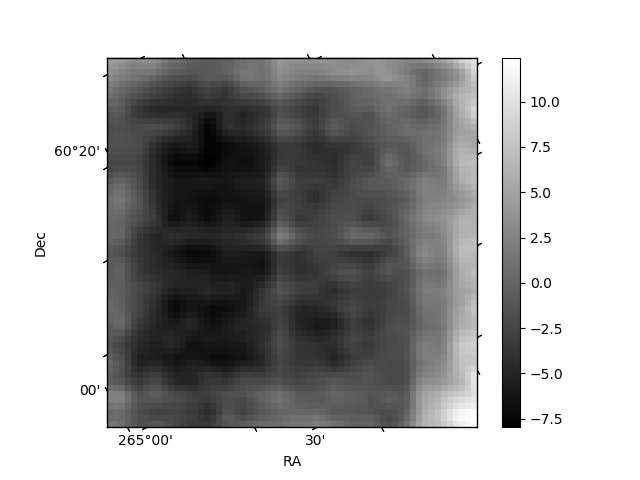
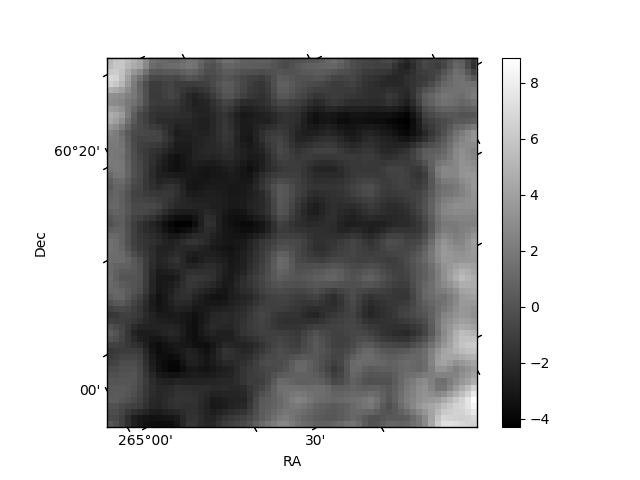
Histogram calculated using DETX and DETY for each event in the final _common_clean file
| Quadrant A | 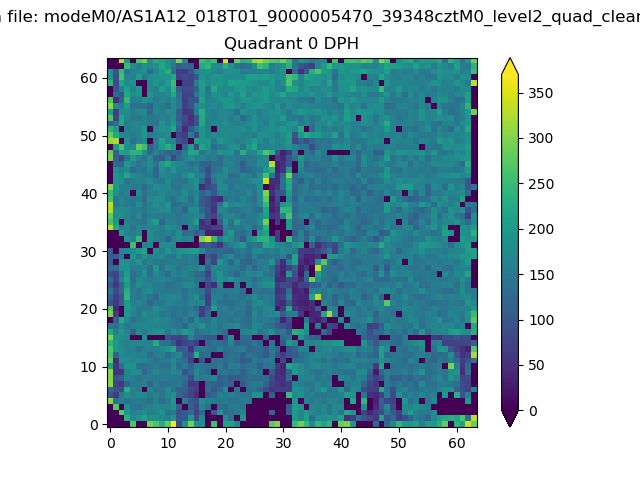 |
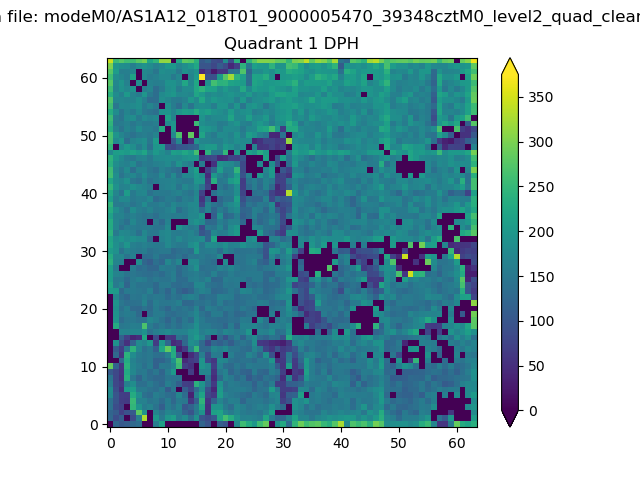 |
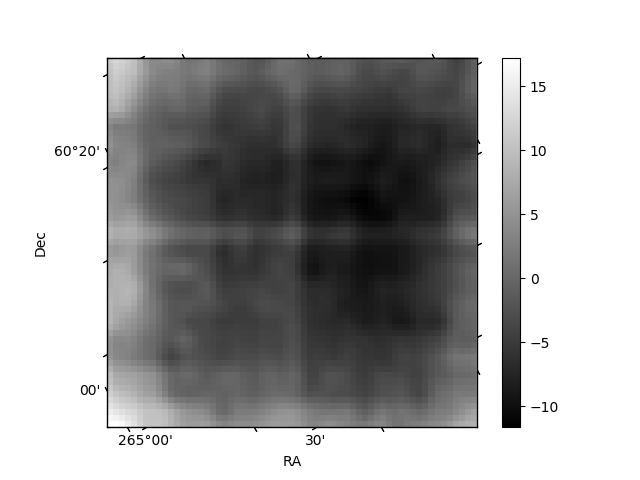
Quadrant B |
|---|---|---|---|
| Quadrant D | 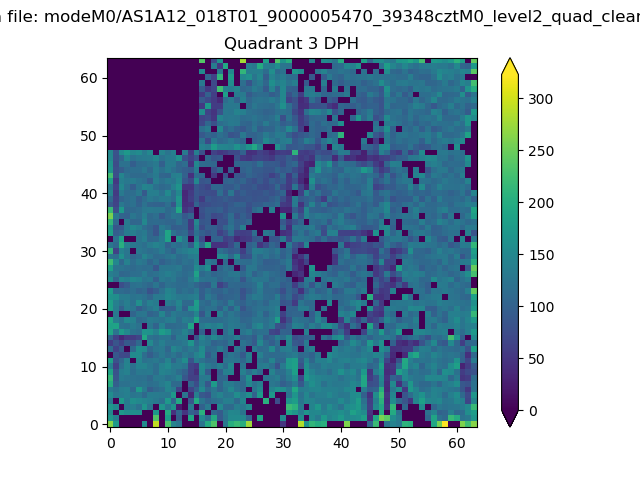 |
 |
Quadrant C |
| Plot type | Count rate plots | Images |
|---|---|---|
| Comparison with Poisson distribution Blue bars denote a histogram of data divided into 1 sec bins. Red curve is a Poisson curve with rate = median count rate of data. |
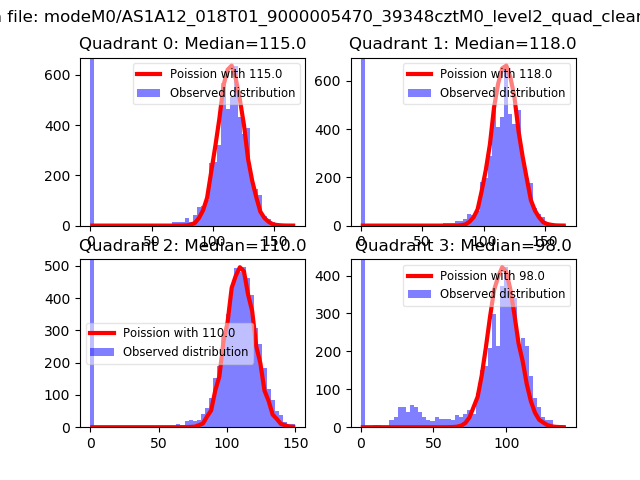 |
 |
| Quadrant-wise count rates Data is divided into 100 sec bins |
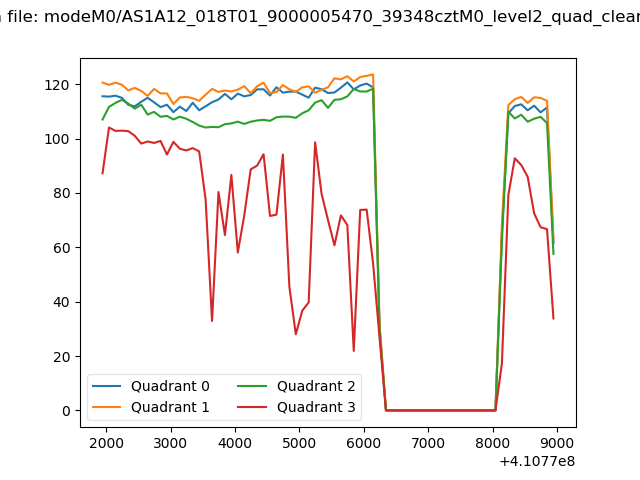 |
|
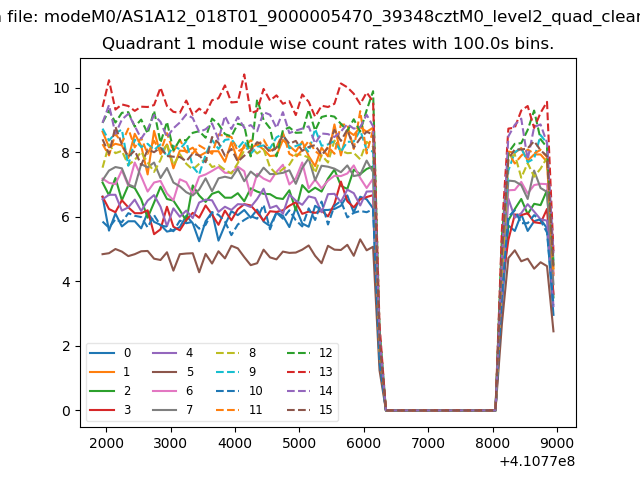
| Module-wise count rates for Quadrant A Data is divided into 100 sec bins |
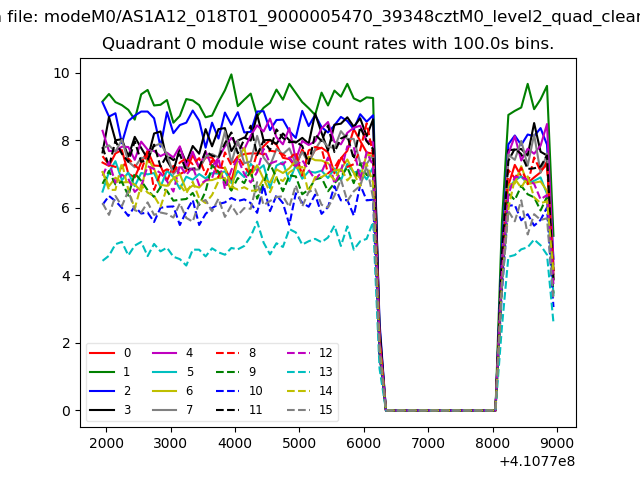 |
 |
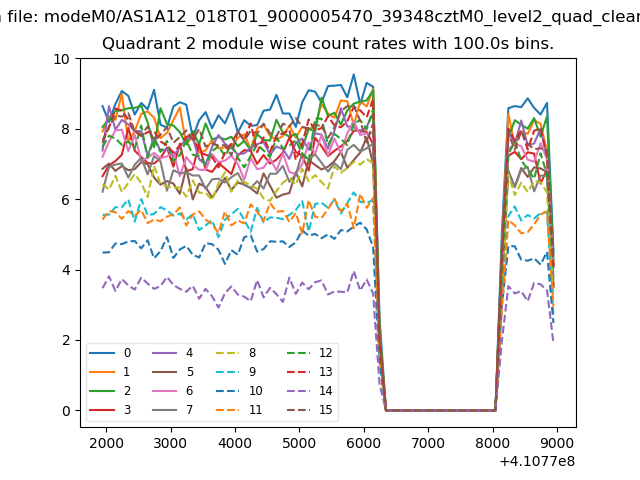
| Module-wise count rates for Quadrant B Data is divided into 100 sec bins |
 |
 |
| Module-wise count rates for Quadrant C Data is divided into 100 sec bins |
 |
 |
| Module-wise count rates for Quadrant D Data is divided into 100 sec bins |
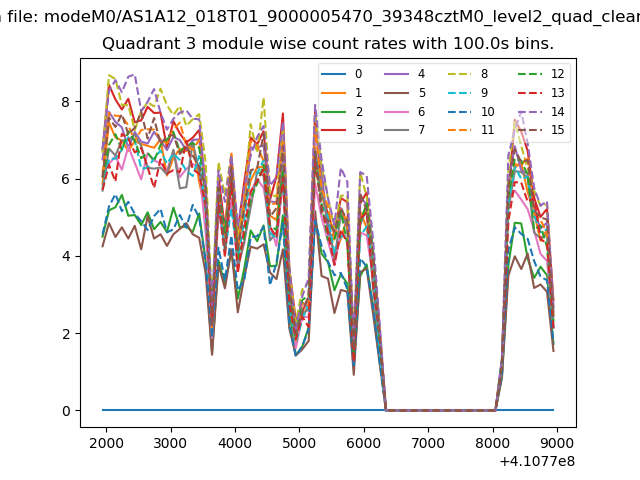 |
 |
| Parameter | Plot |
|---|---|
| CZT HV Monitor | 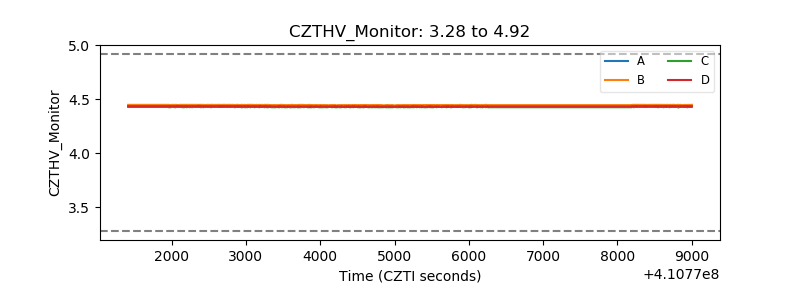 |
| D_VDD | 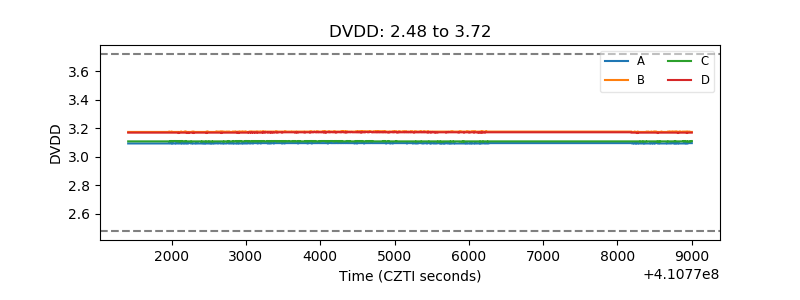 |
| Temperature 1 | 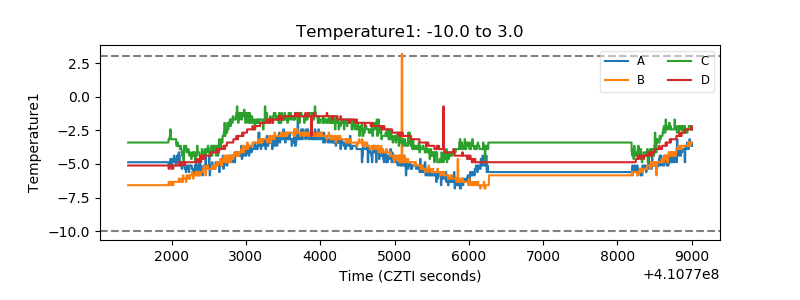 |
| Veto HV Monitor | 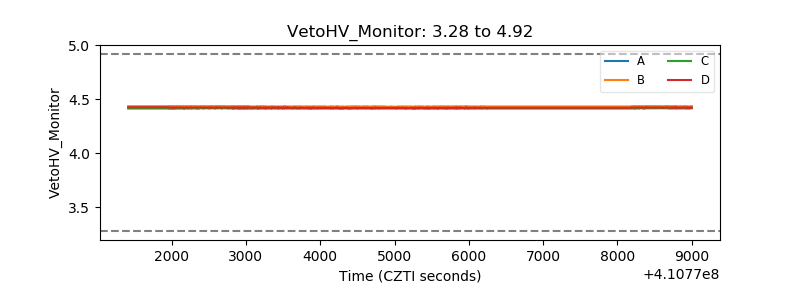 |
| Veto LLD | 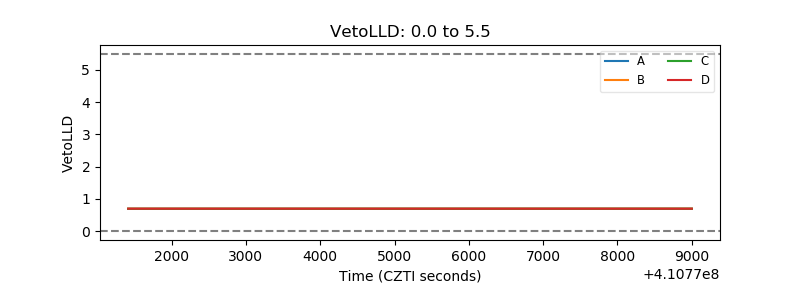 |
| Alpha Counter | 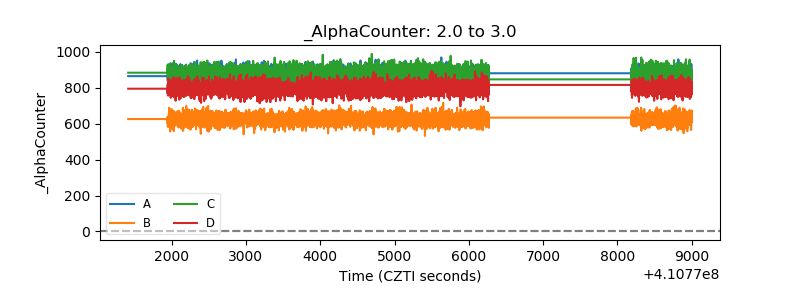 |
| _CPM_Rate | 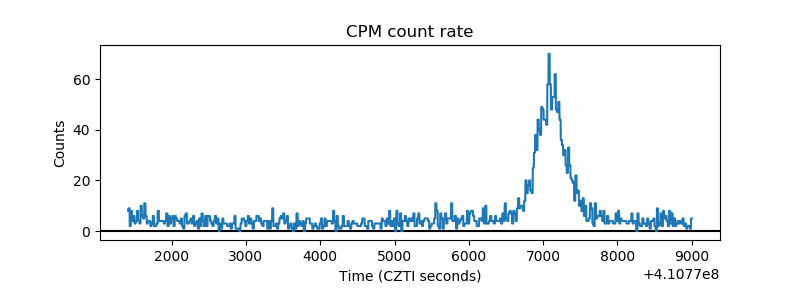 |
| CZT Counter | 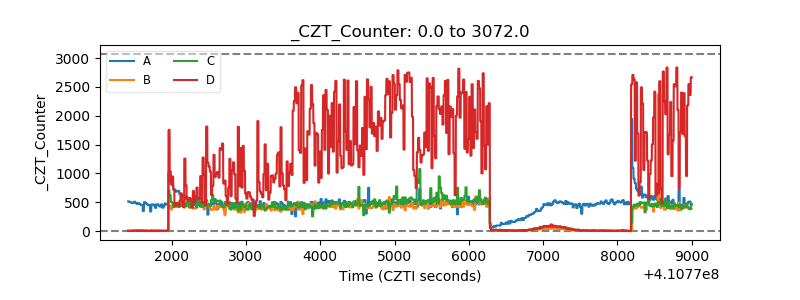 |
| +2.5 Volts monitor | 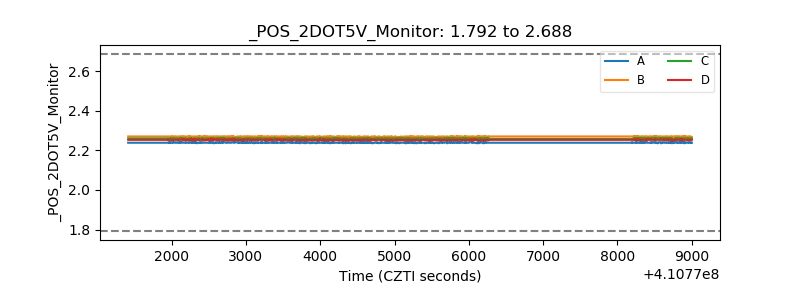 |
| +5 Volts monitor | 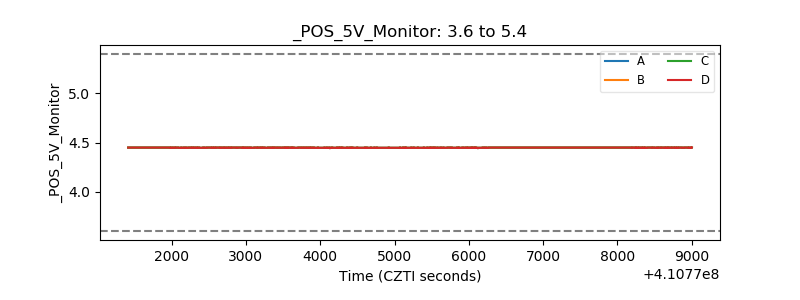 |
| _ROLL_ROT | 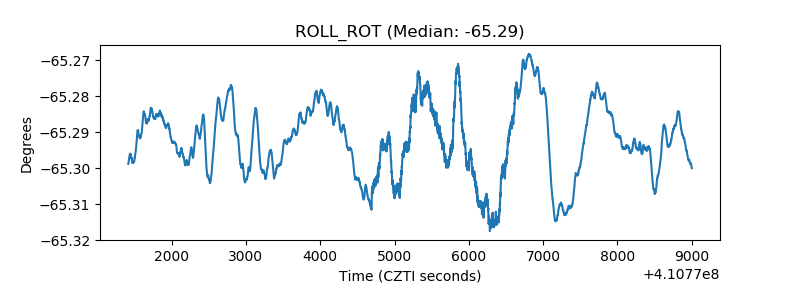 |
| _Roll_DEC | 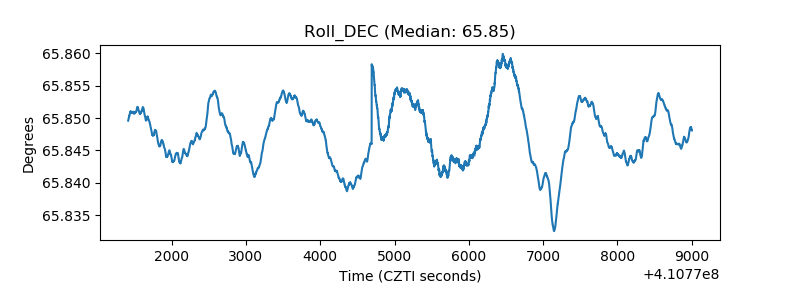 |
| _Roll_RA | 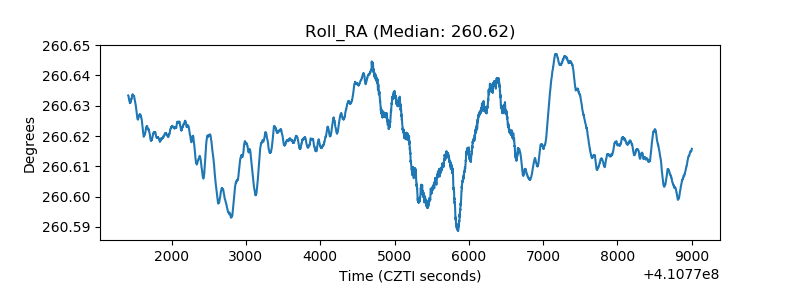 |
| Veto Counter | 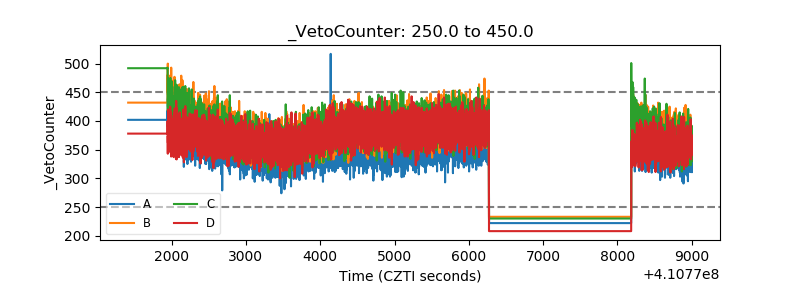 |