| Param | Original file | Final file |
|---|---|---|
| Filename | modeM0/AS1A12_018T01_9000005470_39349cztM0_level2.fits | modeM0/AS1A12_018T01_9000005470_39349cztM0_level2_quad_clean.evt |
| Size (bytes) | 533,528,640 | 84,211,200 |
| Size | 508.8 MB | 80.3 MB |
| Events in quadrant A | 2,858,642 | 630,815 |
| Events in quadrant B | 2,462,639 | 646,294 |
| Events in quadrant C | 2,752,602 | 603,493 |
| Events in quadrant D | 11,238,211 | 275,971 |
| Mode M9 | |||
|---|---|---|---|
| Quadrant | BADHDUFLAG | Total packets | Discarded packets |
| A | 0 | 22 | 0 |
| B | 0 | 22 | 0 |
| C | 0 | 22 | 0 |
| D | 0 | 23 | 0 |
| Mode SS | |||
|---|---|---|---|
| Quadrant | BADHDUFLAG | Total packets | Discarded packets |
| A | 0 | 114 | 0 |
| B | 0 | 114 | 0 |
| C | 0 | 114 | 0 |
| D | 0 | 114 | 0 |
| Mode M0 | |||
|---|---|---|---|
| Quadrant | BADHDUFLAG | Total packets | Discarded packets |
| A | 0 | 11843 | 3 |
| B | 0 | 11386 | 2 |
| C | 0 | 11730 | 2 |
| D | 0 | 37340 | 2 |
| Quadrant | Total seconds | Saturated seconds | Saturation percentage |
|---|---|---|---|
| A | 5619 | 11 | 0.195764% |
| B | 5619 | 10 | 0.177968% |
| C | 5619 | 9 | 0.160171% |
| D | 5619 | 3269 | 58.177612% |
Noise dominated data is calculated using 1-second bins in cleaned event files. If a bin has >2000 counts, and if more than 50% of those come from <1% of pixels, then it is considered to be noise-dominated and hence unusable.
| Quadrant | # 1 sec bins | Bins with >0 counts | Bins with >2000 counts | High rate bins dominated by noise | Noise dominated (total time) | Noise dominated (detector-on time) | Marked lightcurve |
|---|---|---|---|---|---|---|---|
| A | 7172 | 5620 | 4 | 4 | 0.06% | 0.07% | 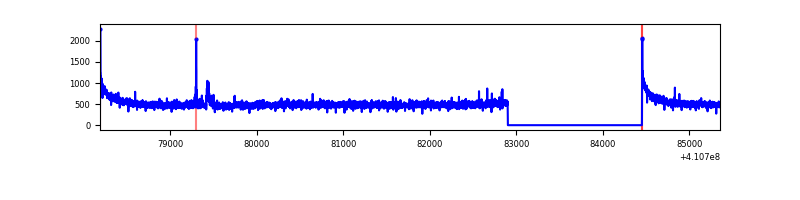 |
| B | 7172 | 5620 | 6 | 6 | 0.08% | 0.11% | 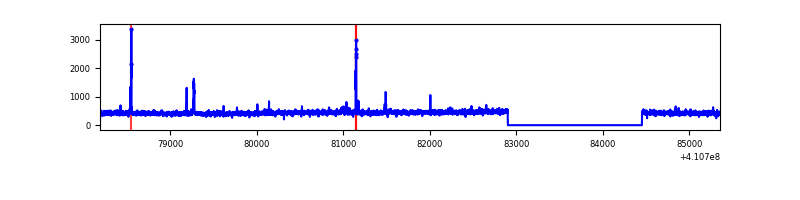 |
| C | 7172 | 5620 | 2 | 2 | 0.03% | 0.04% | 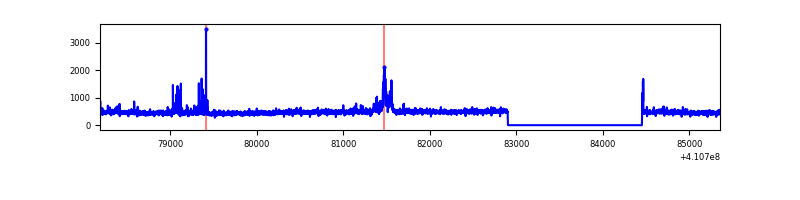 |
| D | 7172 | 5620 | 2675 | 2675 | 37.30% | 47.60% | 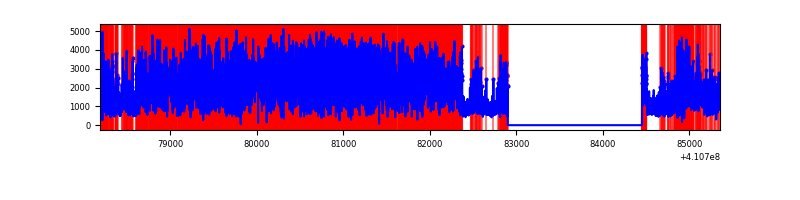 |
Top three noisy pixels from each quadrant. If the there are fewer than three noisy pixels in the level2.evt file, extra rows are filled as -1
| Pixel properties | Quadrant properties | ||||||
|---|---|---|---|---|---|---|---|
| Quadrant | DetID | PixID | Counts | Sigma | Mean | Median | Sigma |
| A | 10 | 83 | 443353 | 3565.76 | 614 | 600 | 124.2 |
| A | 13 | 248 | 22162 | 173.65 | 614 | 600 | 124.2 |
| A | 15 | 222 | 12231 | 93.67 | 614 | 600 | 124.2 |
| B | 5 | 172 | 30865 | 258.55 | 607 | 591 | 117.1 |
| B | 0 | 183 | 26735 | 223.28 | 607 | 591 | 117.1 |
| B | 12 | 111 | 14534 | 119.08 | 607 | 591 | 117.1 |
| C | 15 | 214 | 256670 | 1859.68 | 594 | 597 | 137.7 |
| C | 9 | 187 | 105907 | 764.79 | 594 | 597 | 137.7 |
| C | 3 | 110 | 41564 | 297.51 | 594 | 597 | 137.7 |
| D | 12 | 235 | 9227707 | 88249.56 | 431 | 419 | 104.6 |
| D | 2 | 249 | 144554 | 1378.5 | 431 | 419 | 104.6 |
| D | 13 | 249 | 107810 | 1027.08 | 431 | 419 | 104.6 |
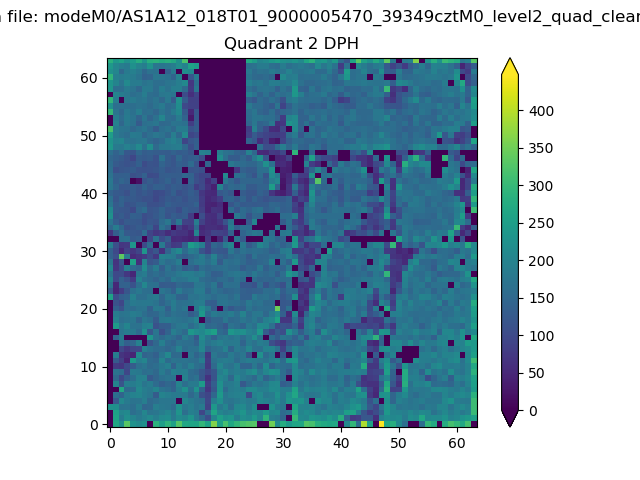
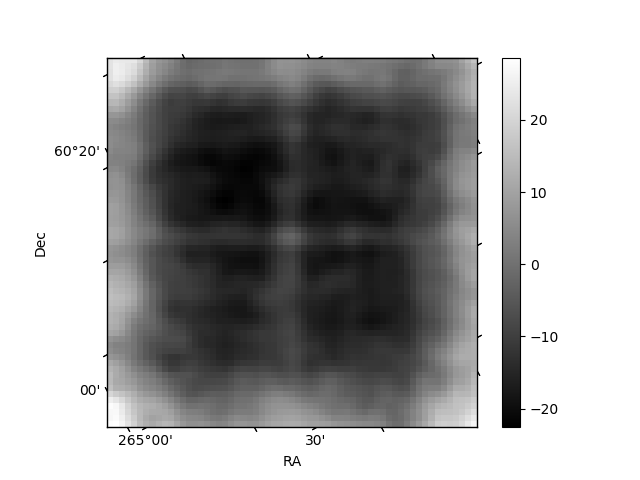
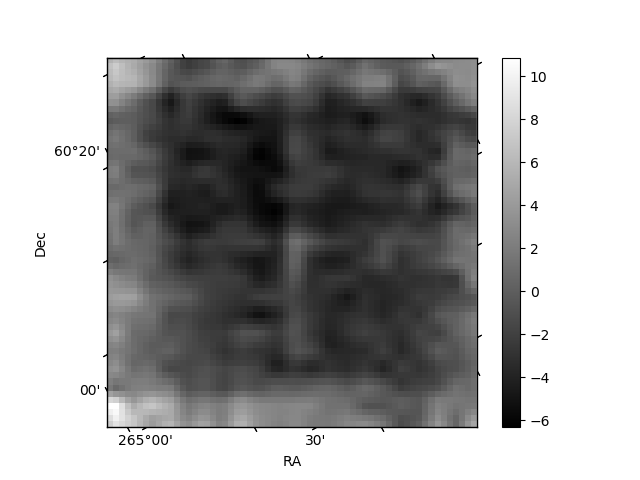
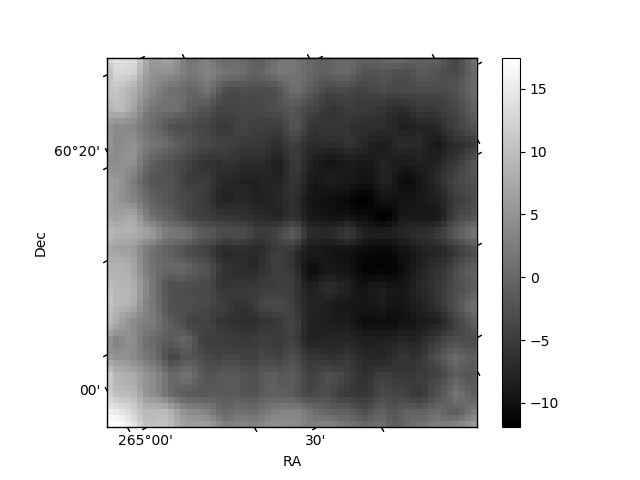
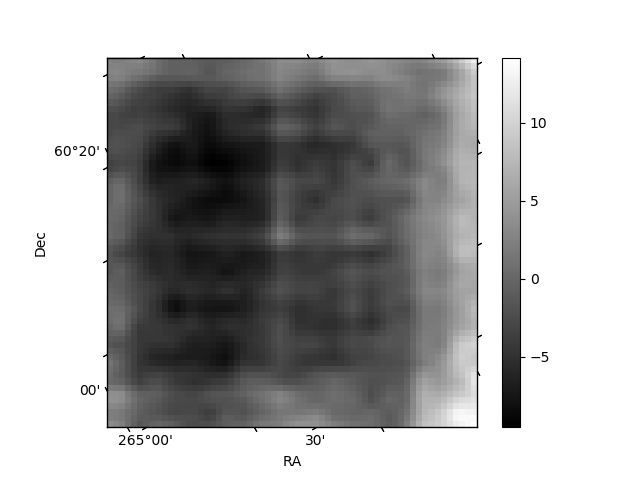
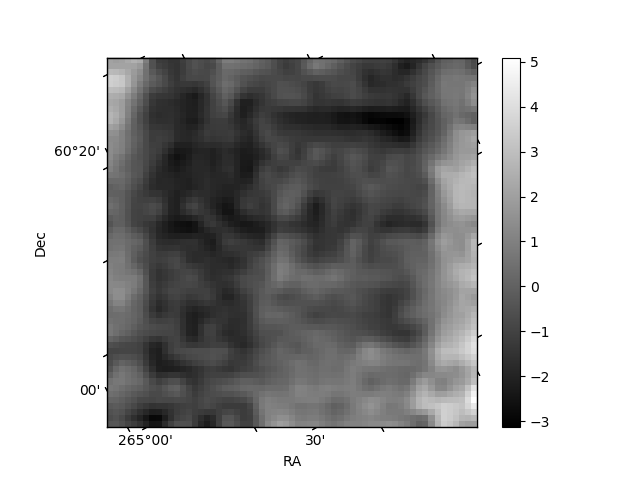
Histogram calculated using DETX and DETY for each event in the final _common_clean file
| Quadrant A | 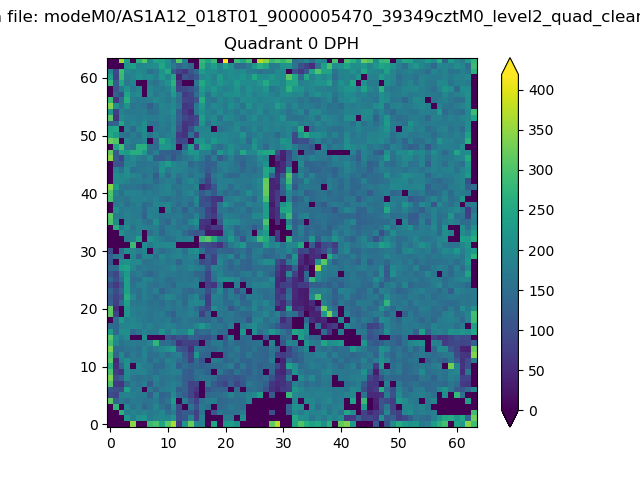 |
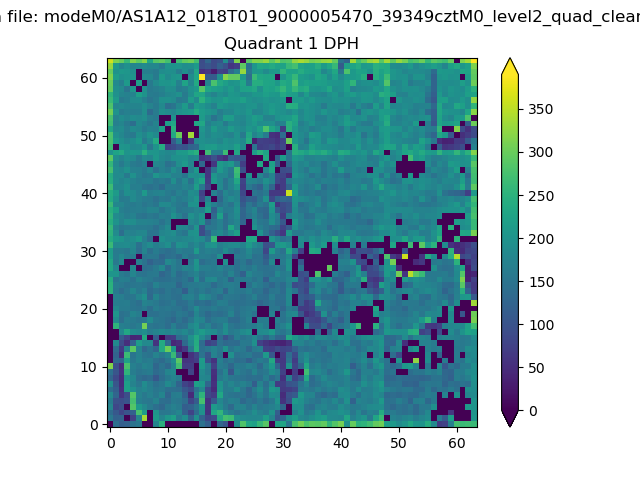 |
Quadrant B |
|---|---|---|---|
| Quadrant D | 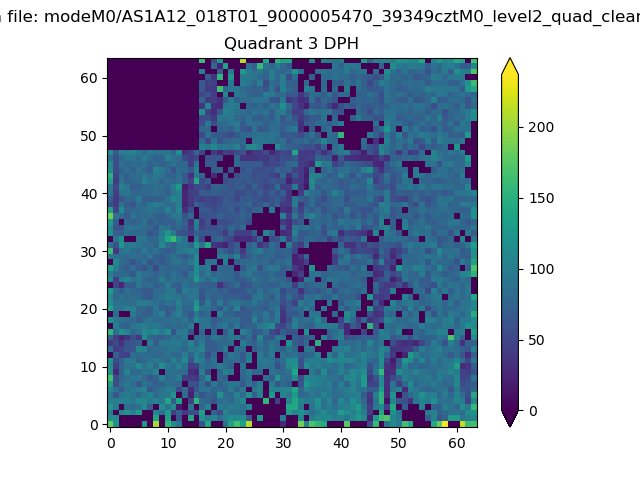 |
 |
Quadrant C |
| Plot type | Count rate plots | Images |
|---|---|---|
| Comparison with Poisson distribution Blue bars denote a histogram of data divided into 1 sec bins. Red curve is a Poisson curve with rate = median count rate of data. |
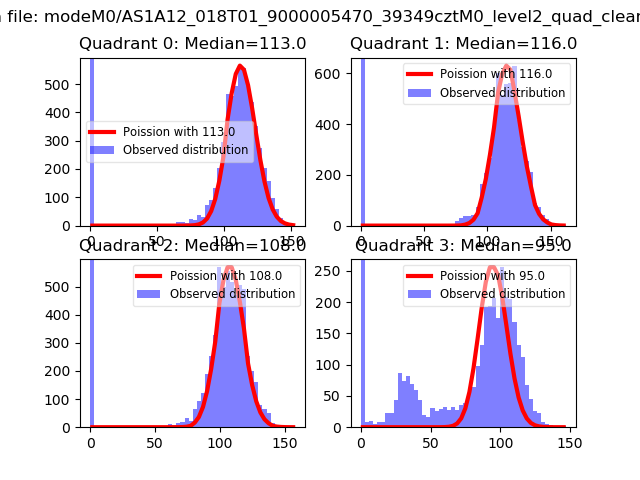 |
 |
| Quadrant-wise count rates Data is divided into 100 sec bins |
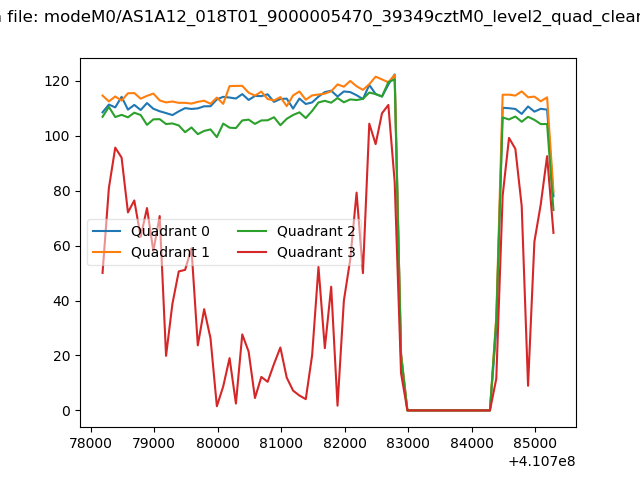 |
|
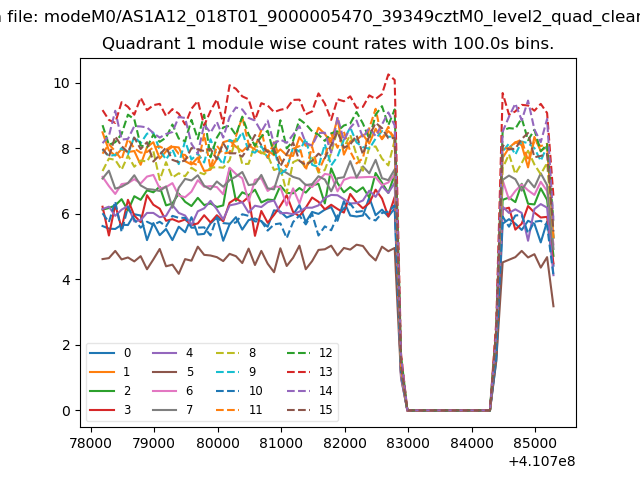
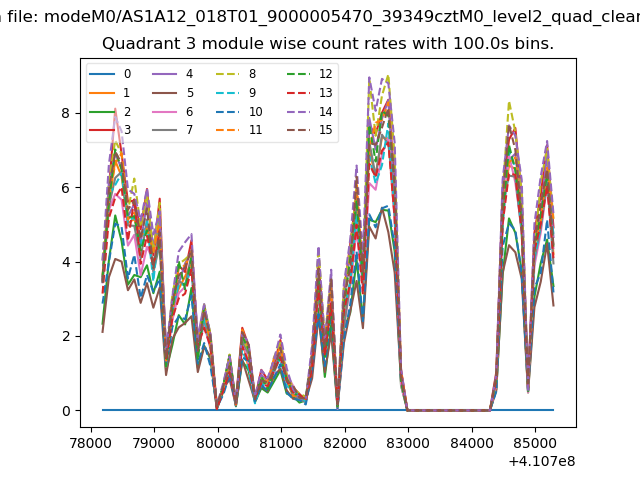
| Module-wise count rates for Quadrant A Data is divided into 100 sec bins |
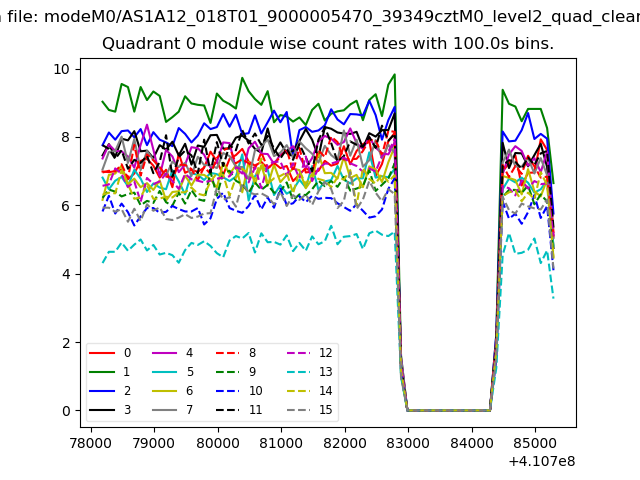 |
 |
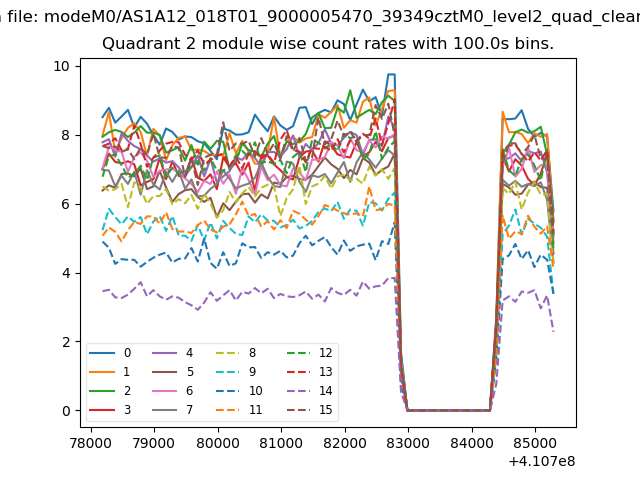
| Module-wise count rates for Quadrant B Data is divided into 100 sec bins |
 |
 |
| Module-wise count rates for Quadrant C Data is divided into 100 sec bins |
 |
 |
| Module-wise count rates for Quadrant D Data is divided into 100 sec bins |
 |
 |
| Parameter | Plot |
|---|---|
| CZT HV Monitor | 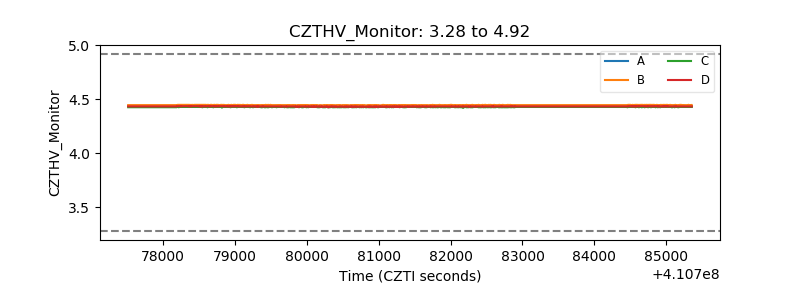 |
| D_VDD | 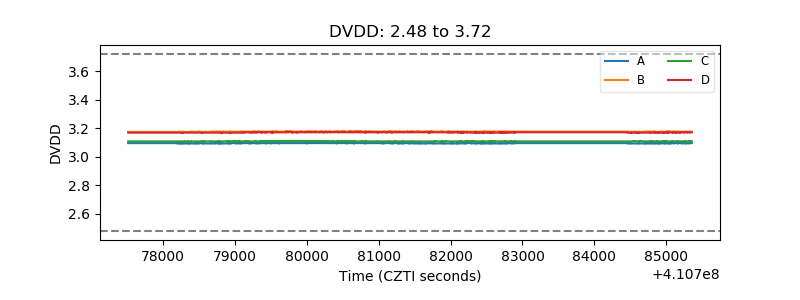 |
| Temperature 1 | 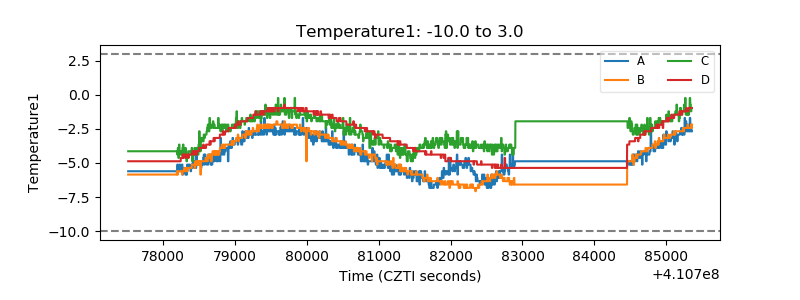 |
| Veto HV Monitor | 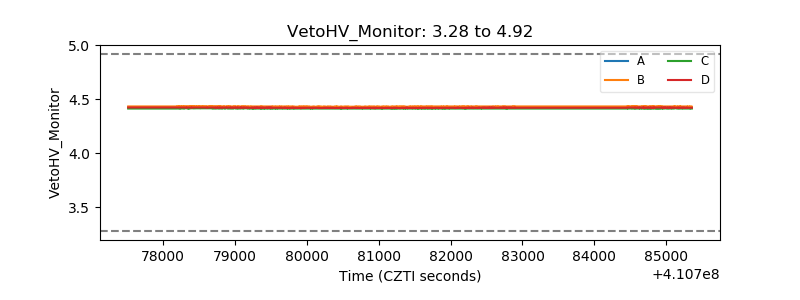 |
| Veto LLD | 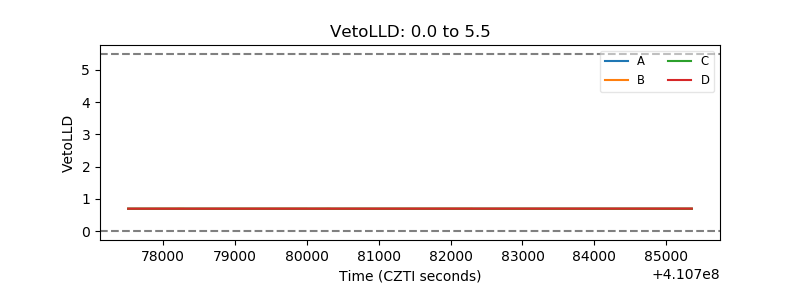 |
| Alpha Counter | 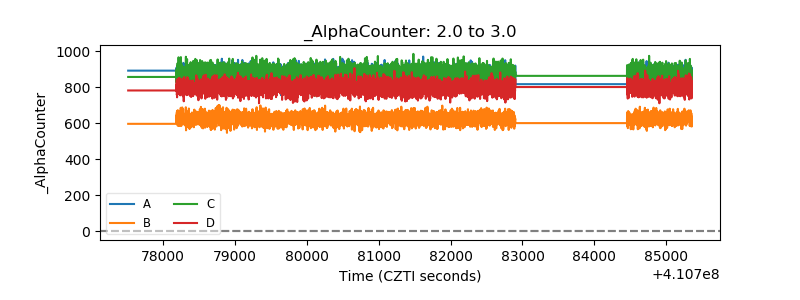 |
| _CPM_Rate | 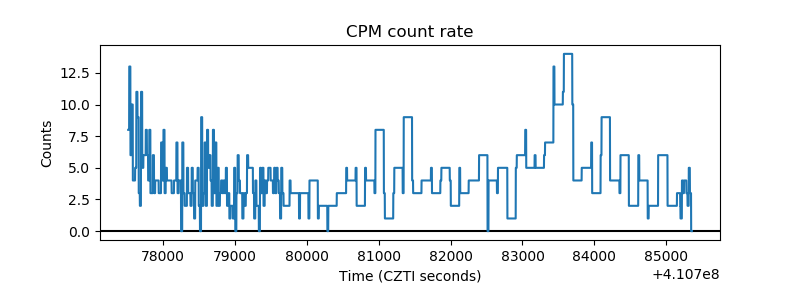 |
| CZT Counter | 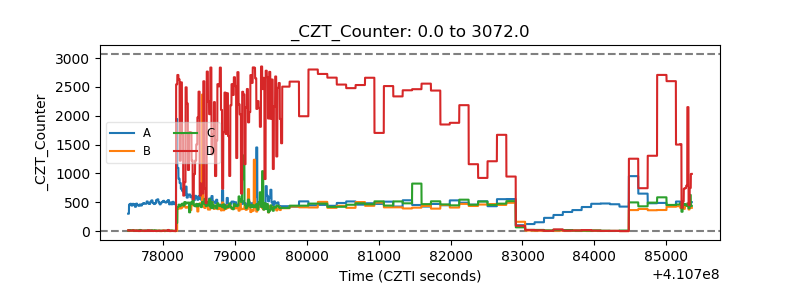 |
| +2.5 Volts monitor | 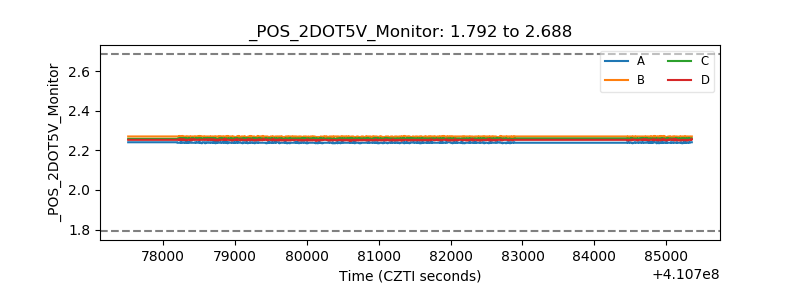 |
| +5 Volts monitor | 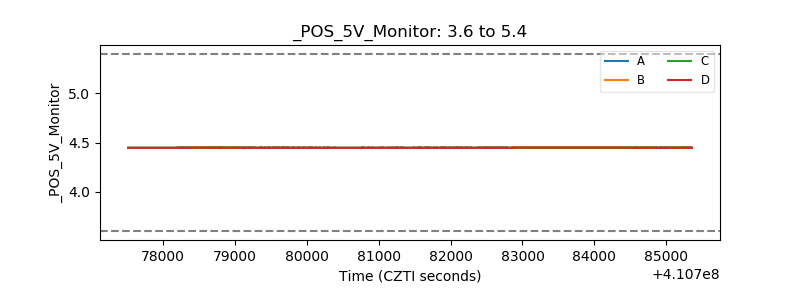 |
| _ROLL_ROT | 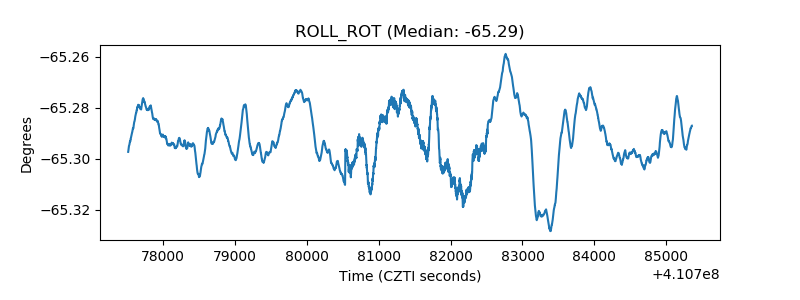 |
| _Roll_DEC | 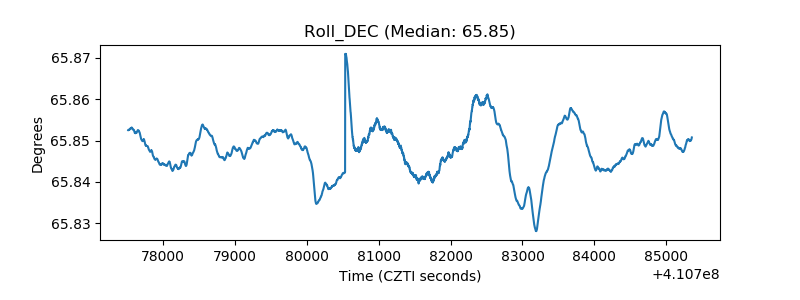 |
| _Roll_RA | 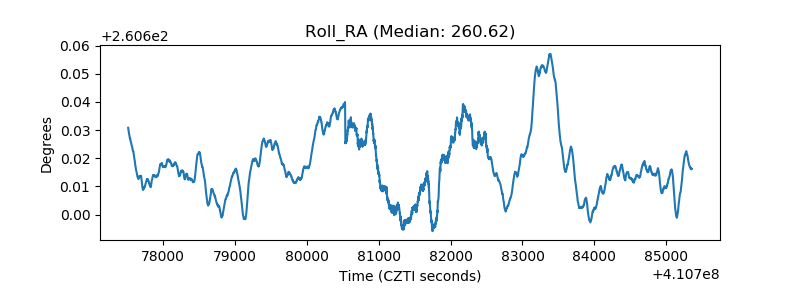 |
| Veto Counter | 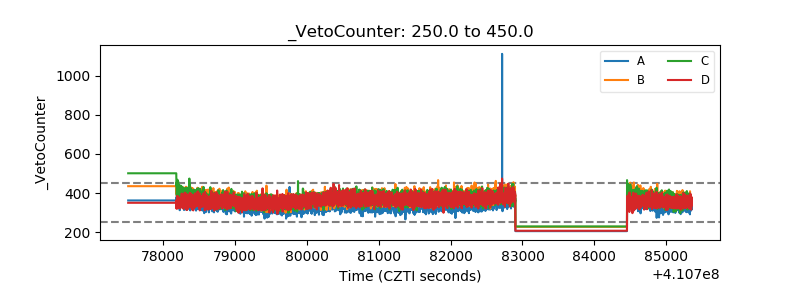 |