| Param | Original file | Final file |
|---|---|---|
| Filename | modeM0/AS1A12_018T01_9000005470_39351cztM0_level2.fits | modeM0/AS1A12_018T01_9000005470_39351cztM0_level2_quad_clean.evt |
| Size (bytes) | 498,458,880 | 90,414,720 |
| Size | 475.4 MB | 86.2 MB |
| Events in quadrant A | 2,992,691 | 647,702 |
| Events in quadrant B | 2,598,166 | 662,937 |
| Events in quadrant C | 3,064,208 | 616,841 |
| Events in quadrant D | 9,342,605 | 402,213 |
| Mode M9 | |||
|---|---|---|---|
| Quadrant | BADHDUFLAG | Total packets | Discarded packets |
| A | 0 | 13 | 0 |
| B | 0 | 13 | 0 |
| C | 0 | 13 | 0 |
| D | 0 | 13 | 0 |
| Mode SS | |||
|---|---|---|---|
| Quadrant | BADHDUFLAG | Total packets | Discarded packets |
| A | 0 | 118 | 0 |
| B | 0 | 118 | 0 |
| C | 0 | 118 | 0 |
| D | 0 | 118 | 0 |
| Mode M0 | |||
|---|---|---|---|
| Quadrant | BADHDUFLAG | Total packets | Discarded packets |
| A | 0 | 12431 | 2 |
| B | 0 | 11846 | 1 |
| C | 0 | 12674 | 1 |
| D | 0 | 31875 | 1 |
| Quadrant | Total seconds | Saturated seconds | Saturation percentage |
|---|---|---|---|
| A | 5837 | 14 | 0.239849% |
| B | 5837 | 16 | 0.274113% |
| C | 5837 | 25 | 0.428302% |
| D | 5837 | 2098 | 35.943121% |
Noise dominated data is calculated using 1-second bins in cleaned event files. If a bin has >2000 counts, and if more than 50% of those come from <1% of pixels, then it is considered to be noise-dominated and hence unusable.
| Quadrant | # 1 sec bins | Bins with >0 counts | Bins with >2000 counts | High rate bins dominated by noise | Noise dominated (total time) | Noise dominated (detector-on time) | Marked lightcurve |
|---|---|---|---|---|---|---|---|
| A | 7120 | 5838 | 6 | 6 | 0.08% | 0.10% | 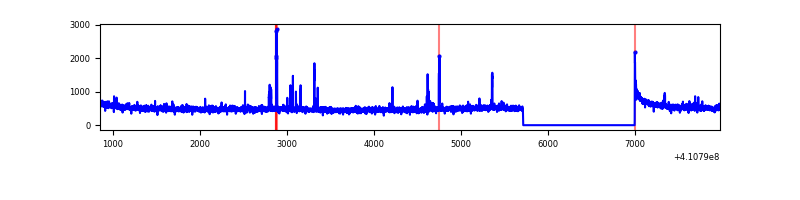 |
| B | 7120 | 5838 | 10 | 10 | 0.14% | 0.17% | 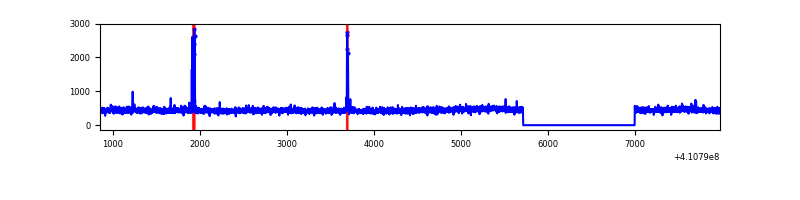 |
| C | 7120 | 5838 | 18 | 18 | 0.25% | 0.31% | 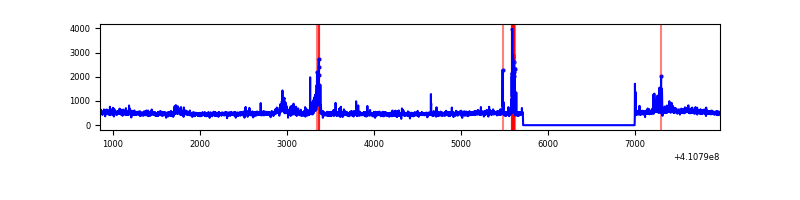 |
| D | 7120 | 5838 | 1655 | 1655 | 23.24% | 28.35% | 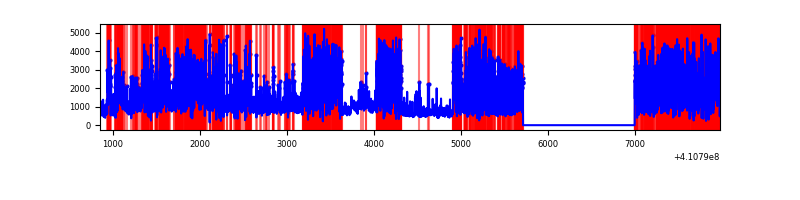 |
Top three noisy pixels from each quadrant. If the there are fewer than three noisy pixels in the level2.evt file, extra rows are filled as -1
| Pixel properties | Quadrant properties | ||||||
|---|---|---|---|---|---|---|---|
| Quadrant | DetID | PixID | Counts | Sigma | Mean | Median | Sigma |
| A | 10 | 83 | 413978 | 3155.7 | 644 | 632 | 131.0 |
| A | 15 | 223 | 54921 | 414.47 | 644 | 632 | 131.0 |
| A | 2 | 79 | 19439 | 143.58 | 644 | 632 | 131.0 |
| B | 15 | 85 | 33675 | 266.9 | 639 | 622 | 123.8 |
| B | 5 | 172 | 24131 | 189.83 | 639 | 622 | 123.8 |
| B | 12 | 111 | 15741 | 122.09 | 639 | 622 | 123.8 |
| C | 15 | 214 | 262021 | 1799.61 | 623 | 626 | 145.3 |
| C | 9 | 187 | 255641 | 1755.69 | 623 | 626 | 145.3 |
| C | 12 | 249 | 52385 | 356.34 | 623 | 626 | 145.3 |
| D | 12 | 235 | 6457893 | 49979.53 | 524 | 508 | 129.2 |
| D | 13 | 249 | 475003 | 3672.54 | 524 | 508 | 129.2 |
| D | 5 | 32 | 149626 | 1154.16 | 524 | 508 | 129.2 |
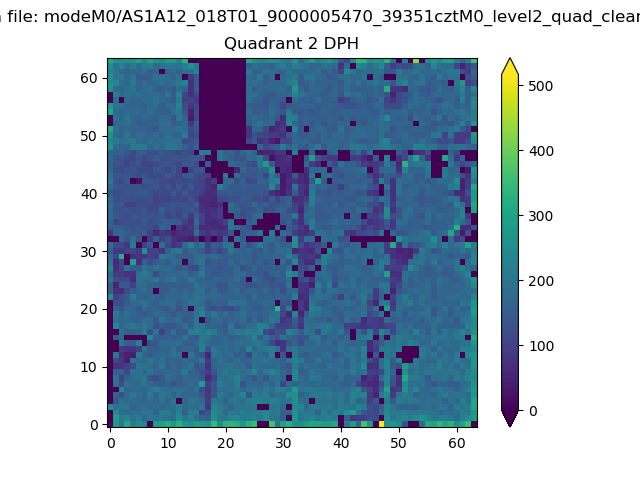
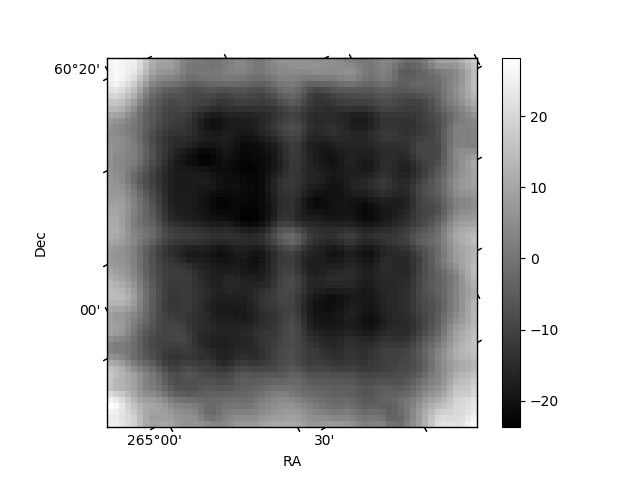
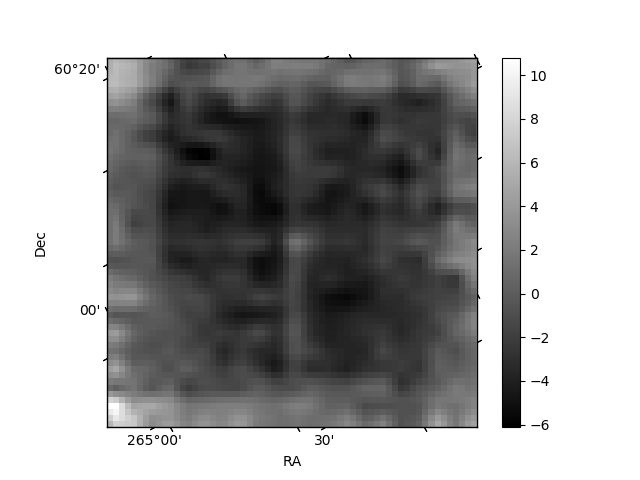
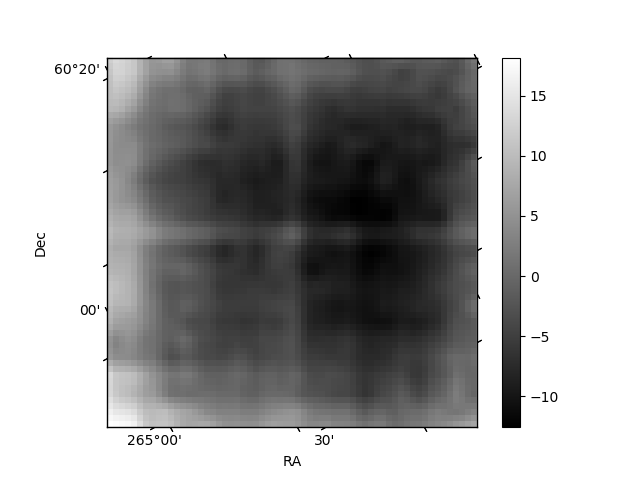
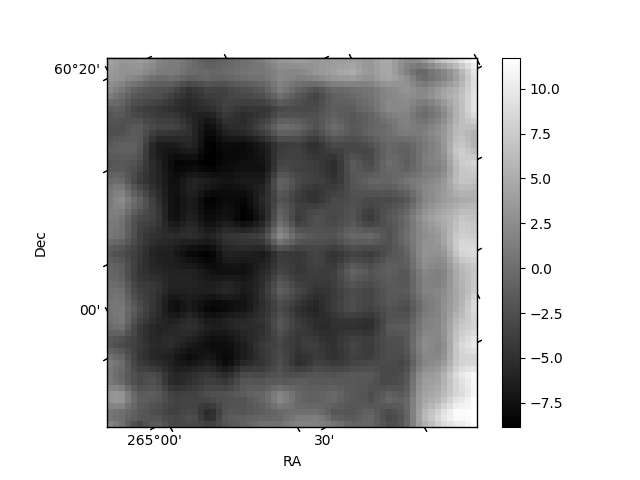
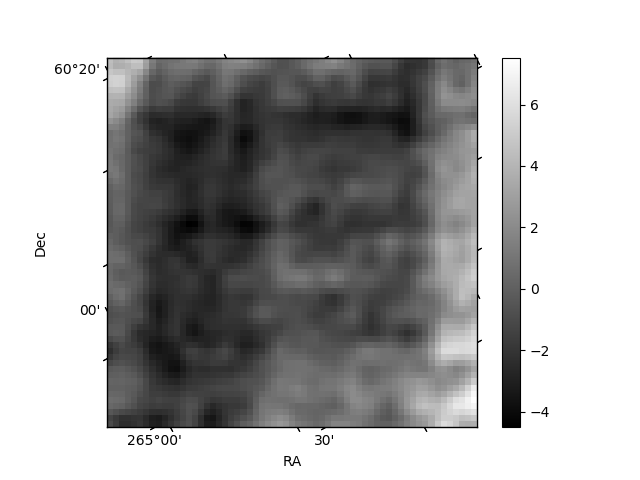
Histogram calculated using DETX and DETY for each event in the final _common_clean file
| Quadrant A | 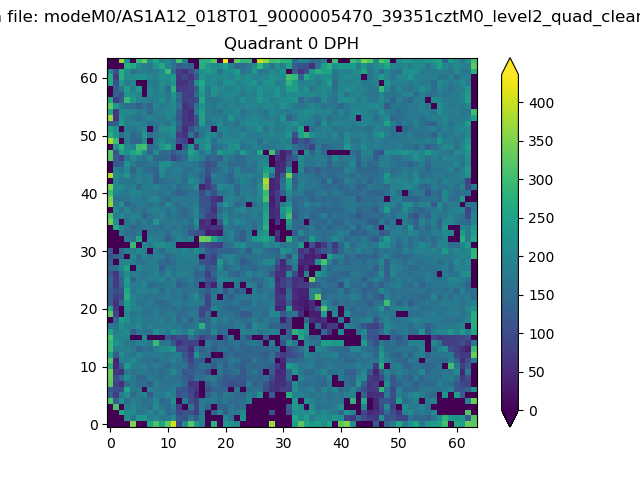 |
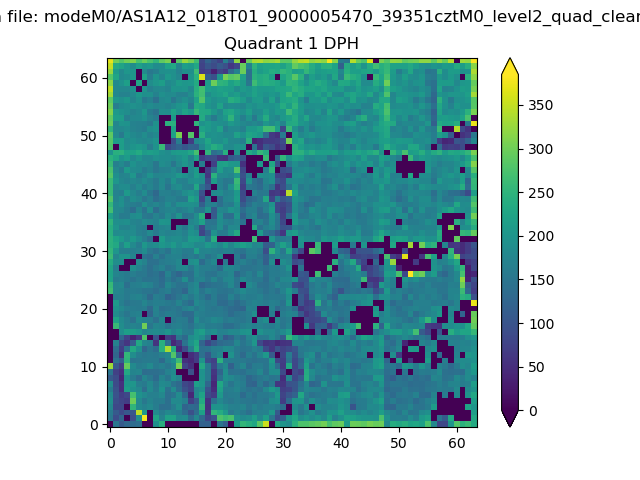 |
Quadrant B |
|---|---|---|---|
| Quadrant D | 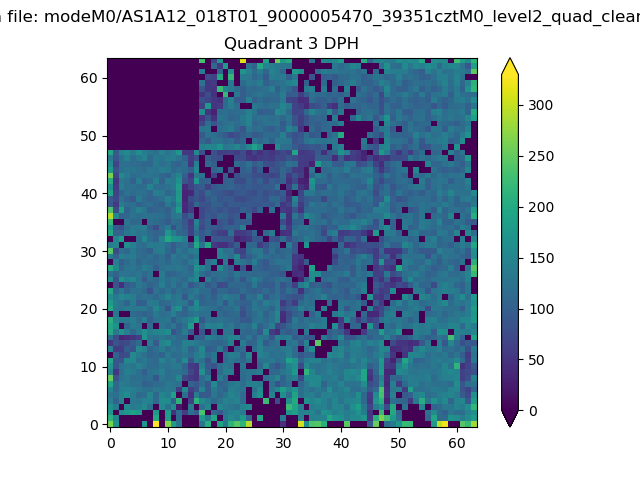 |
 |
Quadrant C |
| Plot type | Count rate plots | Images |
|---|---|---|
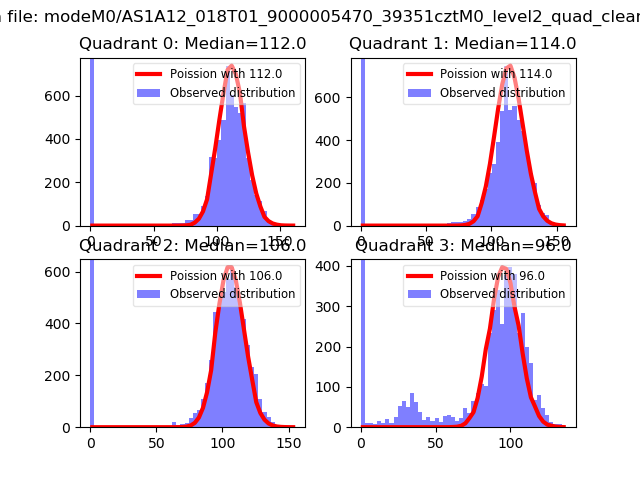
| Comparison with Poisson distribution Blue bars denote a histogram of data divided into 1 sec bins. Red curve is a Poisson curve with rate = median count rate of data. |
 |
 |
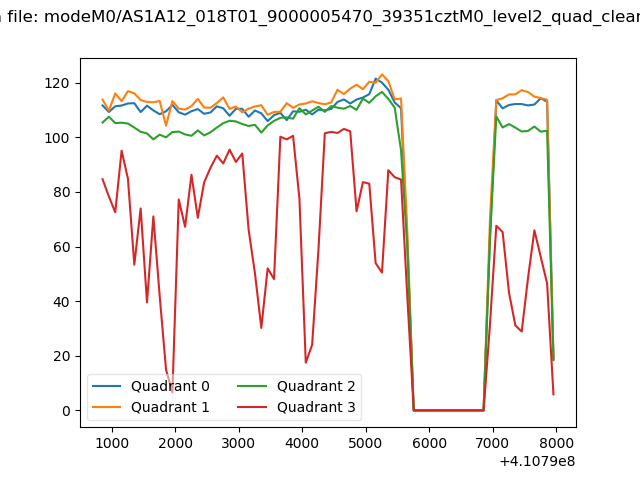
| Quadrant-wise count rates Data is divided into 100 sec bins |
 |
|
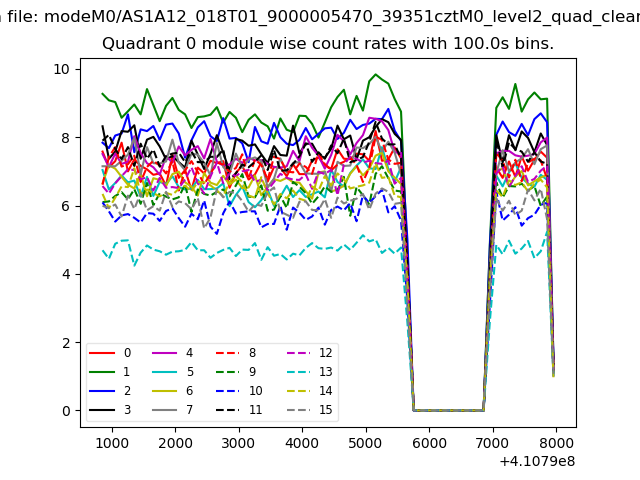
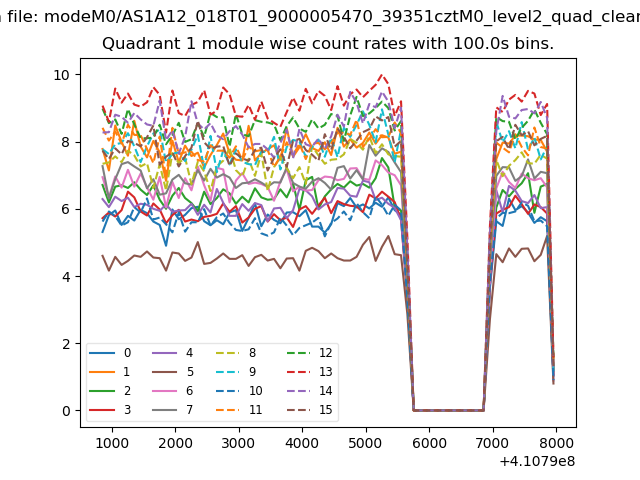
| Module-wise count rates for Quadrant A Data is divided into 100 sec bins |
 |
 |
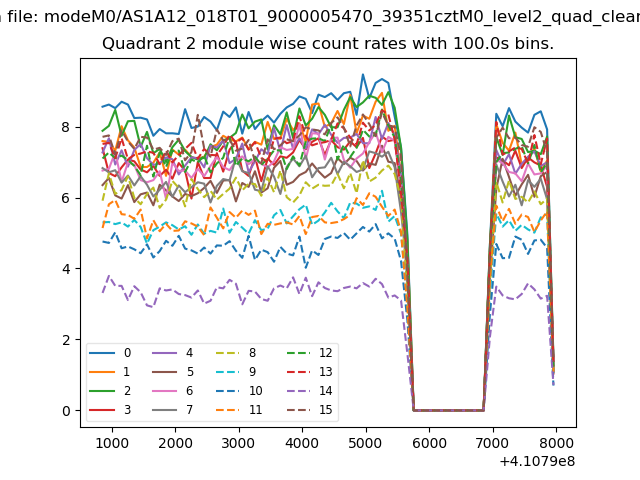
| Module-wise count rates for Quadrant B Data is divided into 100 sec bins |
 |
 |
| Module-wise count rates for Quadrant C Data is divided into 100 sec bins |
 |
 |
| Module-wise count rates for Quadrant D Data is divided into 100 sec bins |
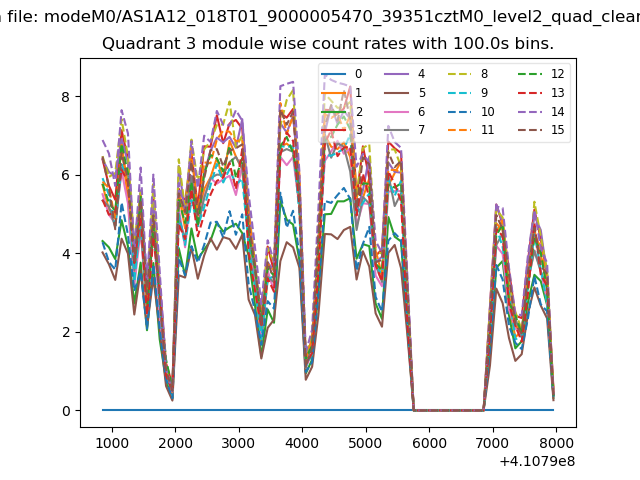 |
 |
| Parameter | Plot |
|---|---|
| CZT HV Monitor |  |
| D_VDD | 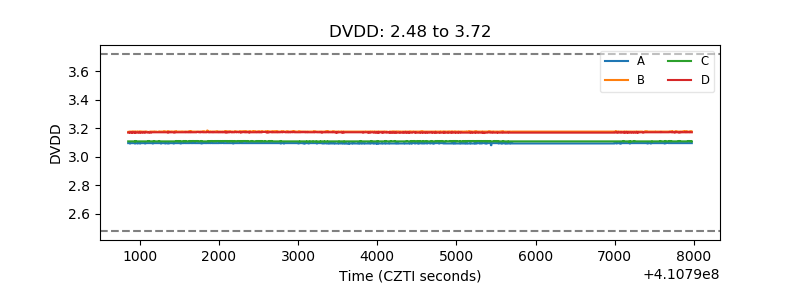 |
| Temperature 1 | 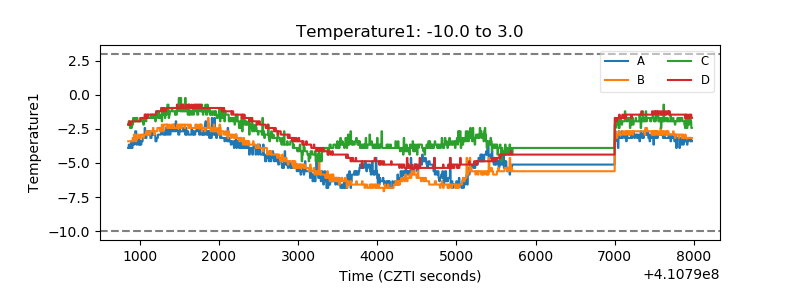 |
| Veto HV Monitor | 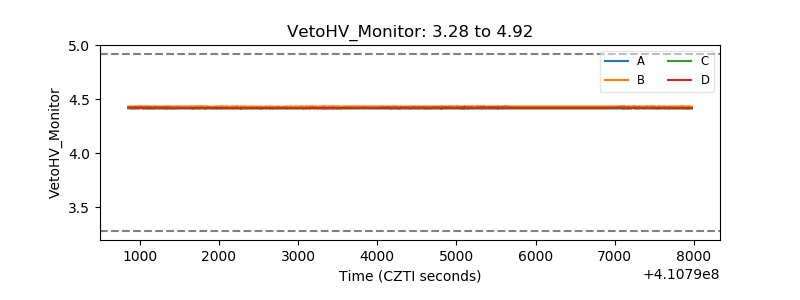 |
| Veto LLD | 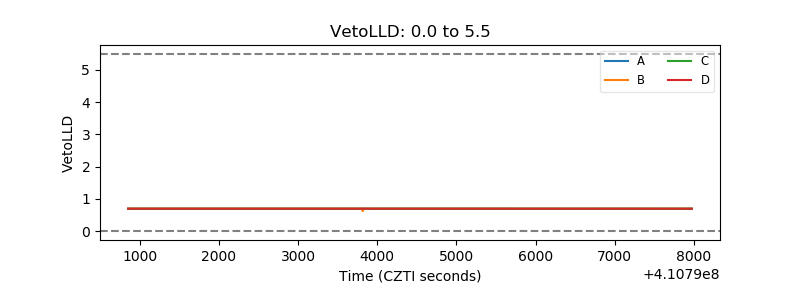 |
| Alpha Counter | 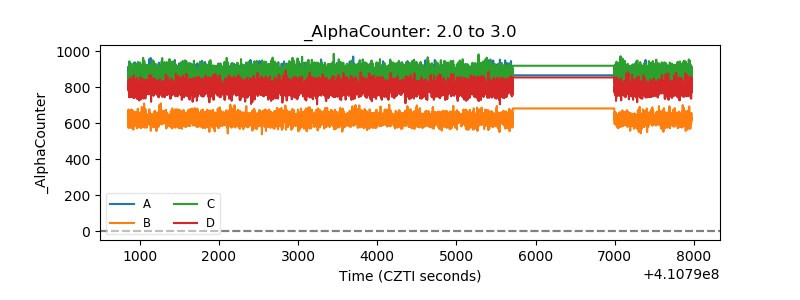 |
| _CPM_Rate | 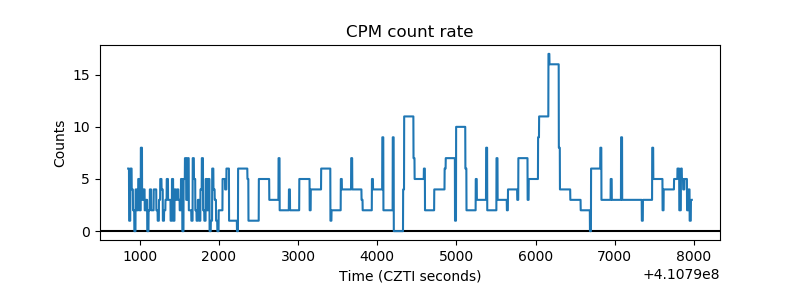 |
| CZT Counter | 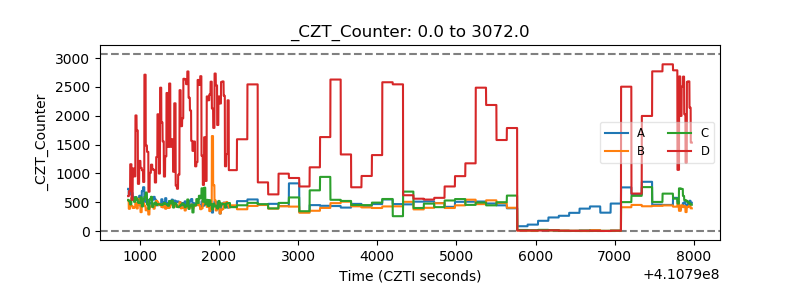 |
| +2.5 Volts monitor | 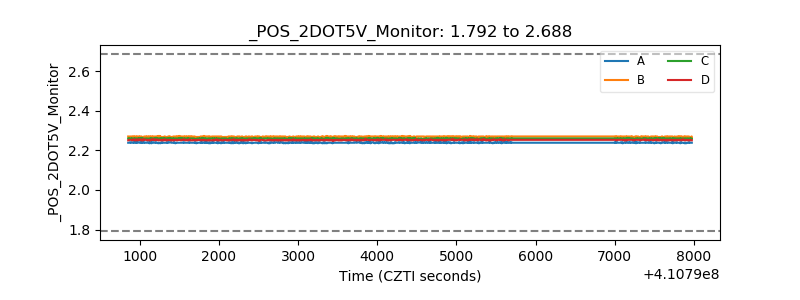 |
| +5 Volts monitor | 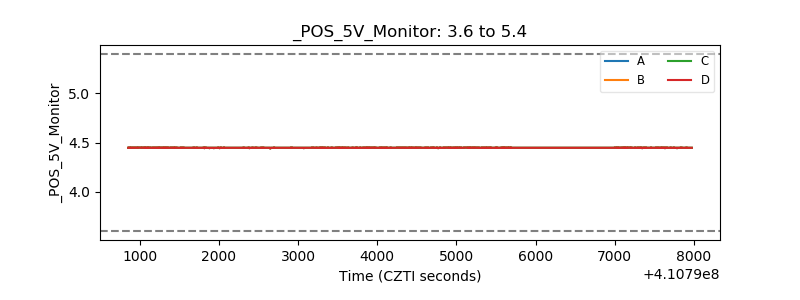 |
| _ROLL_ROT | 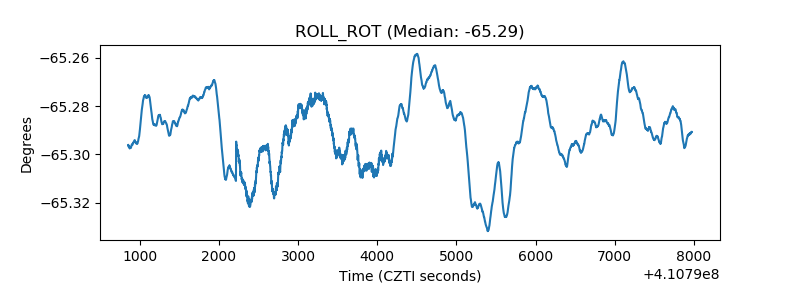 |
| _Roll_DEC | 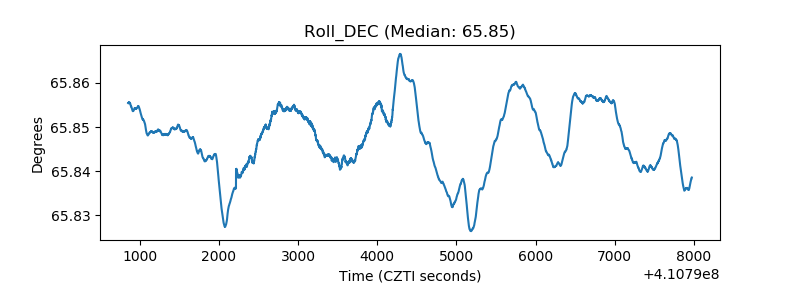 |
| _Roll_RA | 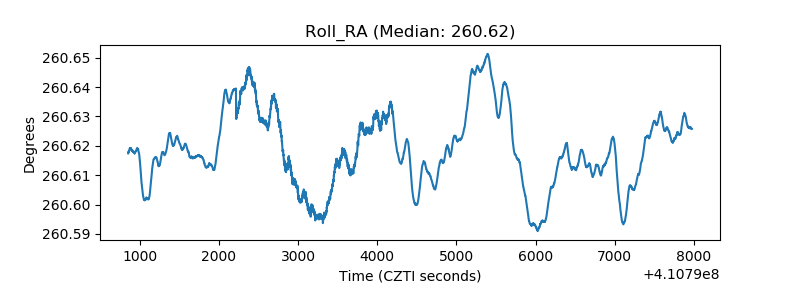 |
| Veto Counter | 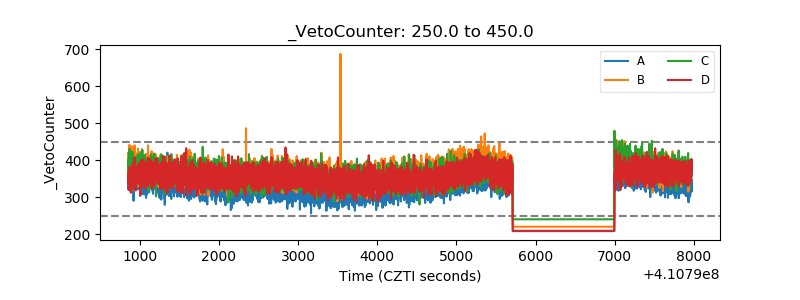 |