| Param | Original file | Final file |
|---|---|---|
| Filename | modeM0/AS1A12_018T01_9000005470_39353cztM0_level2.fits | modeM0/AS1A12_018T01_9000005470_39353cztM0_level2_quad_clean.evt |
| Size (bytes) | 938,119,680 | 163,998,720 |
| Size | 894.7 MB | 156.4 MB |
| Events in quadrant A | 5,539,217 | 1,174,734 |
| Events in quadrant B | 4,767,320 | 1,203,264 |
| Events in quadrant C | 5,518,366 | 1,130,705 |
| Events in quadrant D | 18,066,892 | 710,071 |
| Mode M9 | |||
|---|---|---|---|
| Quadrant | BADHDUFLAG | Total packets | Discarded packets |
| A | 0 | 30 | 0 |
| B | 0 | 30 | 0 |
| C | 0 | 30 | 0 |
| D | 0 | 31 | 0 |
| Mode SS | |||
|---|---|---|---|
| Quadrant | BADHDUFLAG | Total packets | Discarded packets |
| A | 0 | 220 | 0 |
| B | 0 | 220 | 0 |
| C | 0 | 220 | 0 |
| D | 0 | 220 | 0 |
| Mode M0 | |||
|---|---|---|---|
| Quadrant | BADHDUFLAG | Total packets | Discarded packets |
| A | 0 | 23237 | 4 |
| B | 0 | 21803 | 3 |
| C | 0 | 23036 | 3 |
| D | 0 | 61223 | 3 |
| Quadrant | Total seconds | Saturated seconds | Saturation percentage |
|---|---|---|---|
| A | 10775 | 22 | 0.204176% |
| B | 10775 | 15 | 0.139211% |
| C | 10775 | 26 | 0.241299% |
| D | 10775 | 4208 | 39.053364% |
Noise dominated data is calculated using 1-second bins in cleaned event files. If a bin has >2000 counts, and if more than 50% of those come from <1% of pixels, then it is considered to be noise-dominated and hence unusable.
| Quadrant | # 1 sec bins | Bins with >0 counts | Bins with >2000 counts | High rate bins dominated by noise | Noise dominated (total time) | Noise dominated (detector-on time) | Marked lightcurve |
|---|---|---|---|---|---|---|---|
| A | 13552 | 10777 | 12 | 12 | 0.09% | 0.11% | 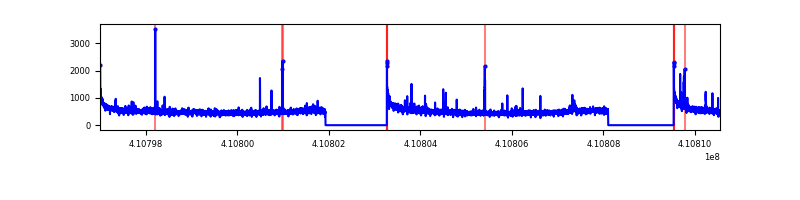 |
| B | 13552 | 10777 | 5 | 5 | 0.04% | 0.05% | 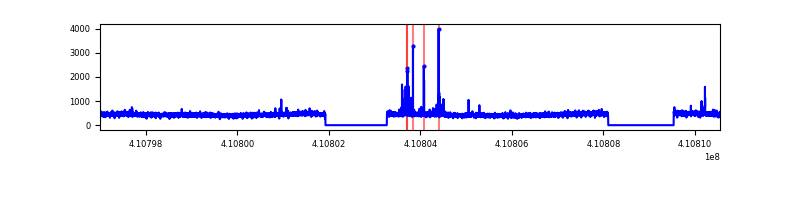 |
| C | 13552 | 10777 | 18 | 18 | 0.13% | 0.17% | 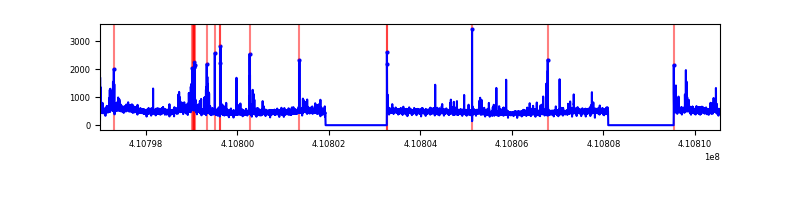 |
| D | 13552 | 10777 | 3407 | 3407 | 25.14% | 31.61% | 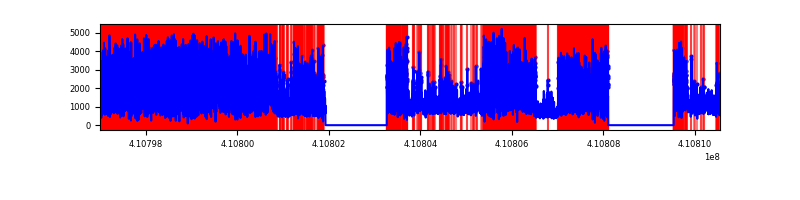 |
Top three noisy pixels from each quadrant. If the there are fewer than three noisy pixels in the level2.evt file, extra rows are filled as -1
| Pixel properties | Quadrant properties | ||||||
|---|---|---|---|---|---|---|---|
| Quadrant | DetID | PixID | Counts | Sigma | Mean | Median | Sigma |
| A | 10 | 83 | 784055 | 3261.22 | 1188 | 1164 | 240.1 |
| A | 15 | 223 | 104436 | 430.19 | 1188 | 1164 | 240.1 |
| A | 2 | 79 | 33895 | 136.34 | 1188 | 1164 | 240.1 |
| B | 0 | 183 | 78009 | 340.22 | 1182 | 1150 | 225.9 |
| B | 12 | 111 | 29381 | 124.97 | 1182 | 1150 | 225.9 |
| B | 11 | 111 | 27383 | 116.12 | 1182 | 1150 | 225.9 |
| C | 15 | 214 | 480649 | 1775.06 | 1159 | 1165 | 270.1 |
| C | 9 | 187 | 326675 | 1205.05 | 1159 | 1165 | 270.1 |
| C | 3 | 110 | 64707 | 235.23 | 1159 | 1165 | 270.1 |
| D | 12 | 235 | 13324661 | 56389.39 | 967 | 936 | 236.3 |
| D | 13 | 249 | 522890 | 2209.04 | 967 | 936 | 236.3 |
| D | 2 | 249 | 192387 | 810.27 | 967 | 936 | 236.3 |
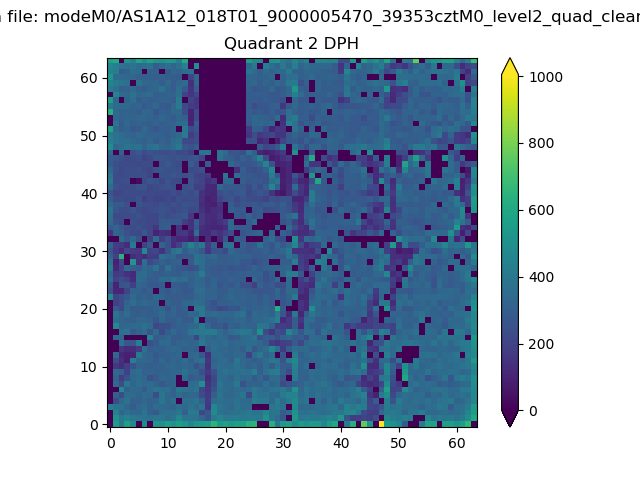
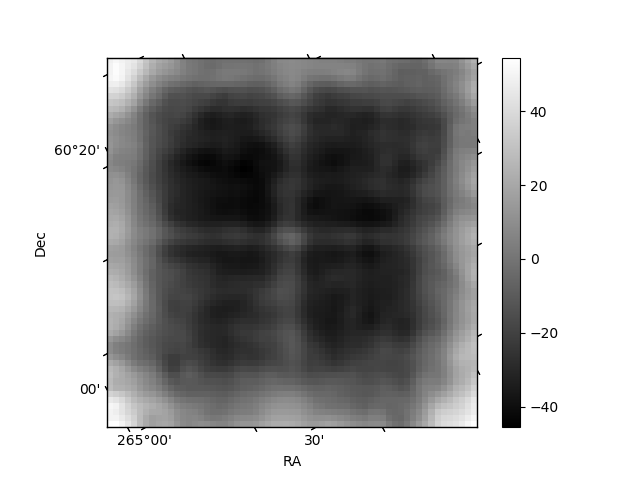
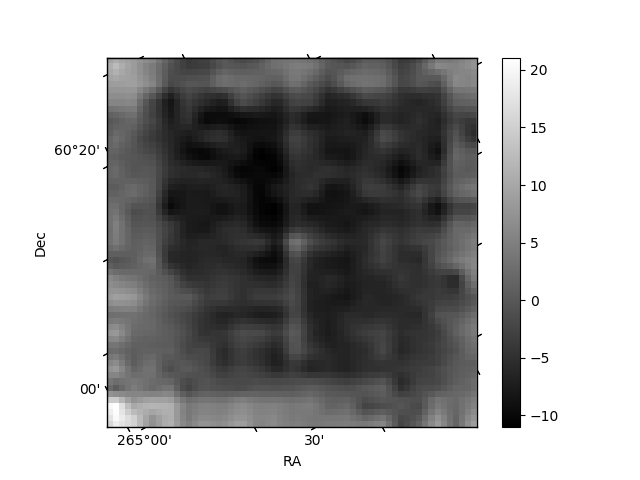
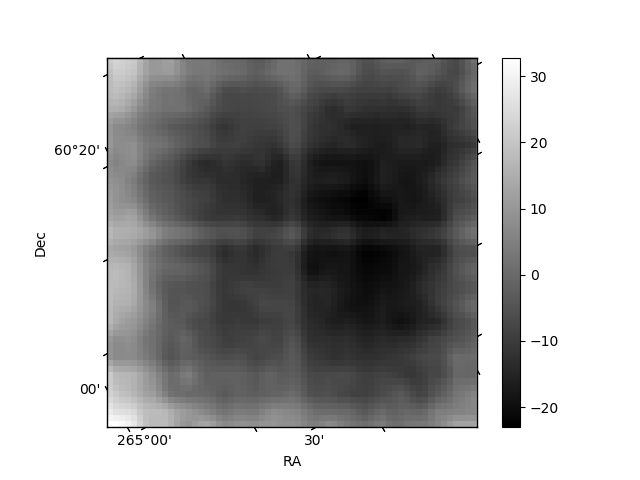
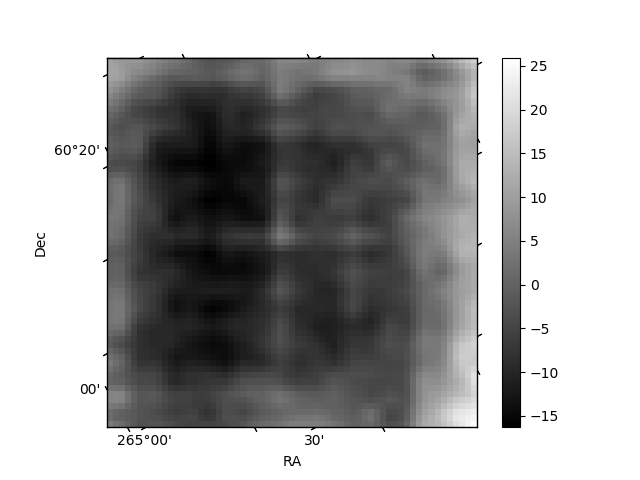
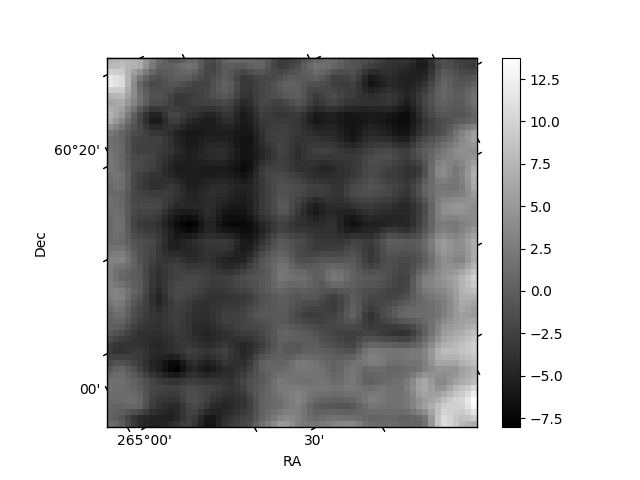
Histogram calculated using DETX and DETY for each event in the final _common_clean file
| Quadrant A | 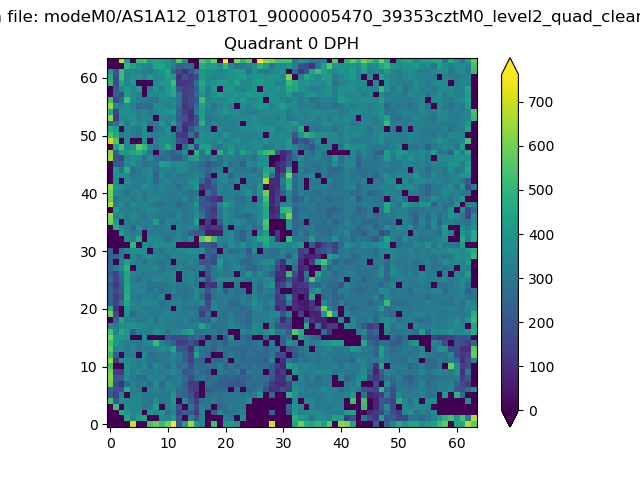 |
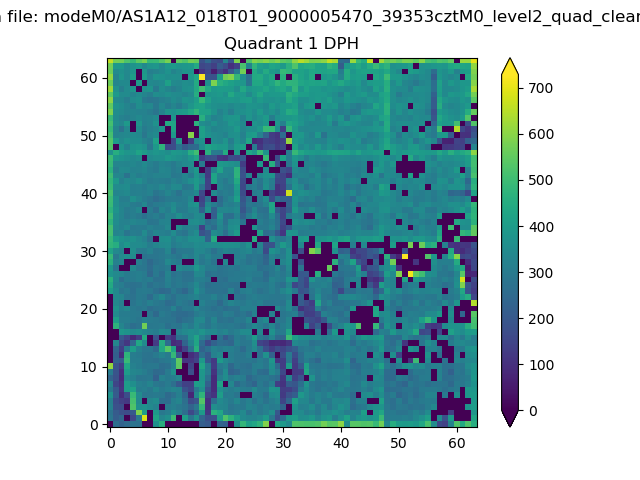 |
Quadrant B |
|---|---|---|---|
| Quadrant D | 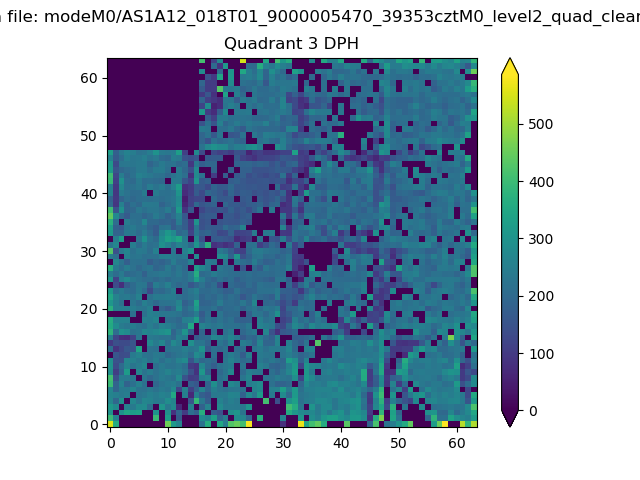 |
 |
Quadrant C |
| Plot type | Count rate plots | Images |
|---|---|---|
| Comparison with Poisson distribution Blue bars denote a histogram of data divided into 1 sec bins. Red curve is a Poisson curve with rate = median count rate of data. |
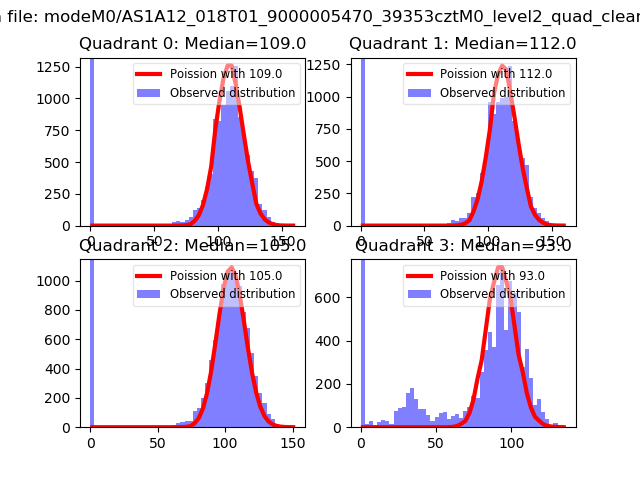 |
 |
| Quadrant-wise count rates Data is divided into 100 sec bins |
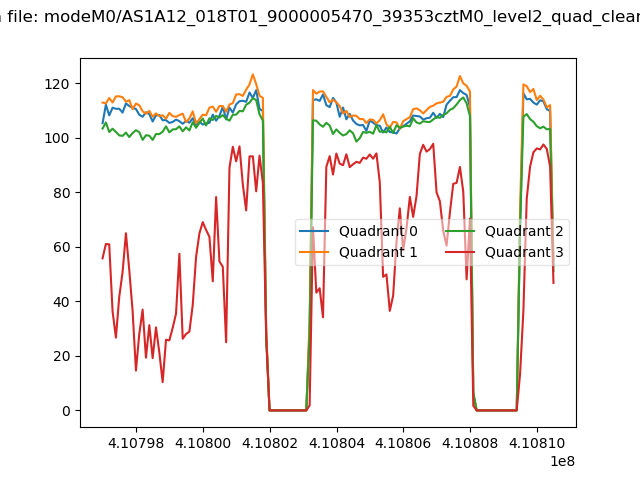 |
|
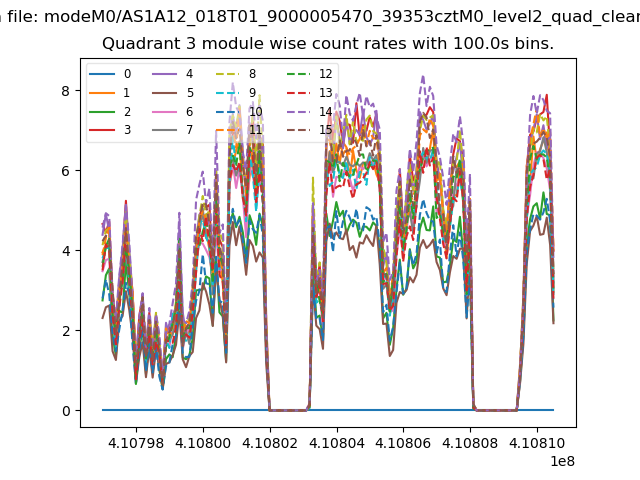
| Module-wise count rates for Quadrant A Data is divided into 100 sec bins |
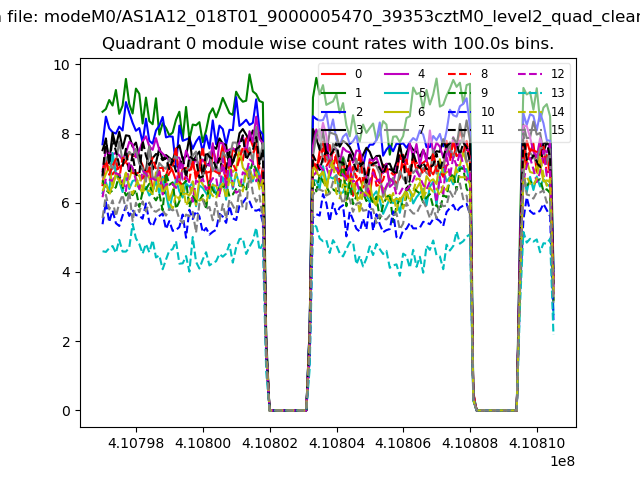 |
 |
| Module-wise count rates for Quadrant B Data is divided into 100 sec bins |
 |
 |
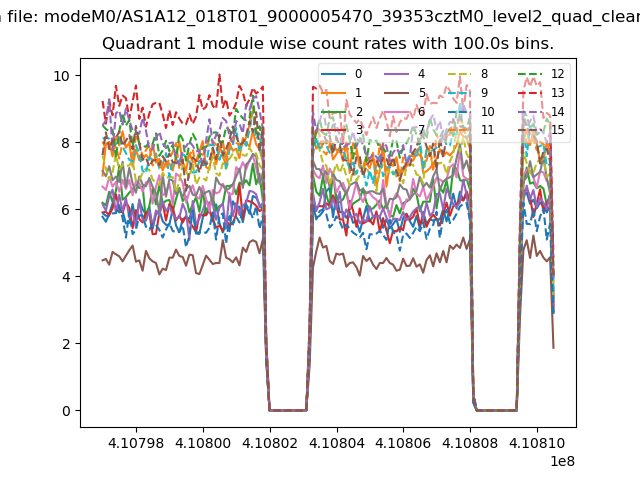
| Module-wise count rates for Quadrant C Data is divided into 100 sec bins |
 |
 |
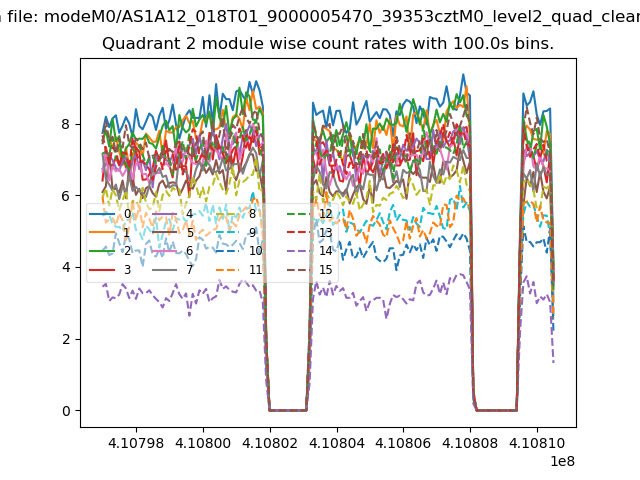
| Module-wise count rates for Quadrant D Data is divided into 100 sec bins |
 |
 |
| Parameter | Plot |
|---|---|
| CZT HV Monitor | 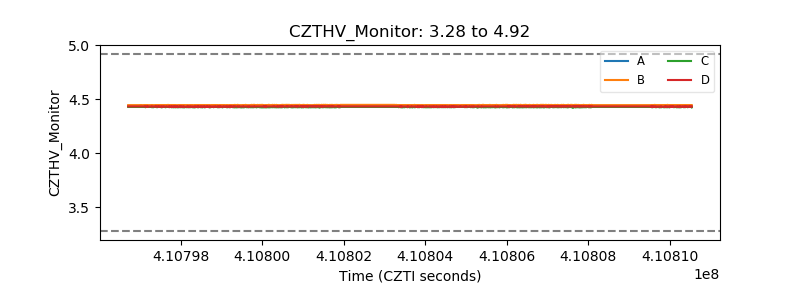 |
| D_VDD | 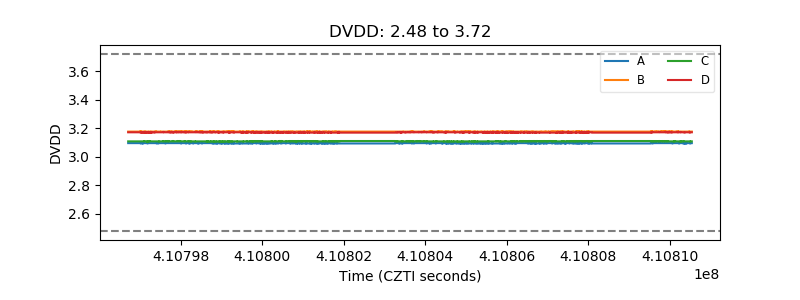 |
| Temperature 1 | 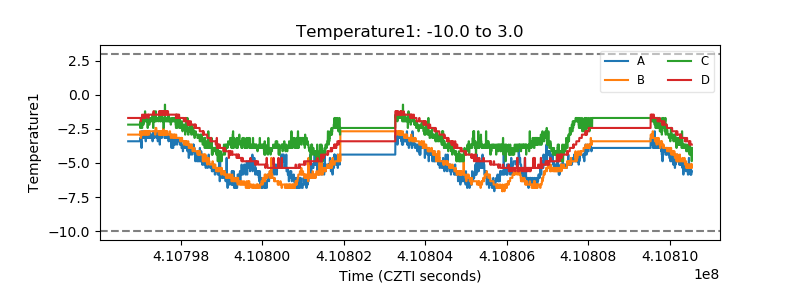 |
| Veto HV Monitor | 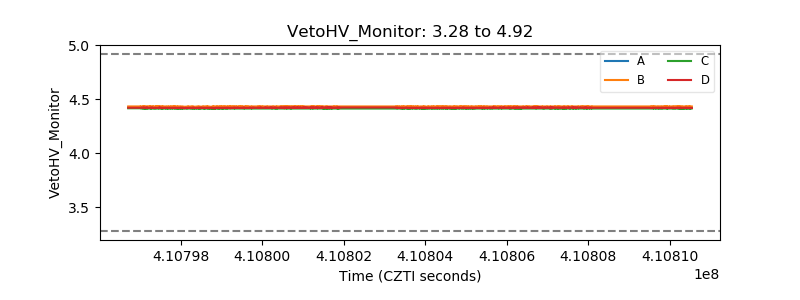 |
| Veto LLD | 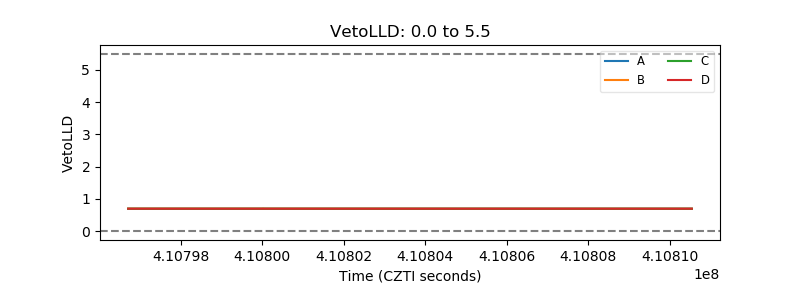 |
| Alpha Counter | 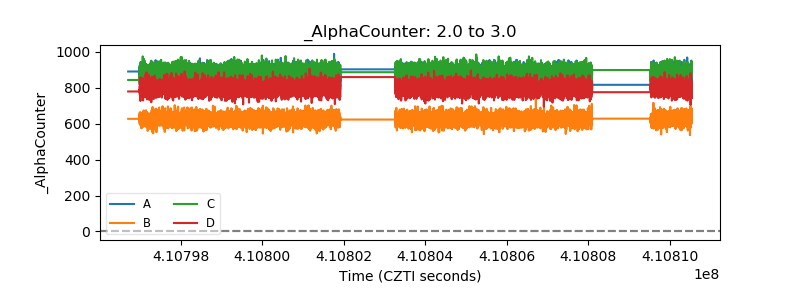 |
| _CPM_Rate | 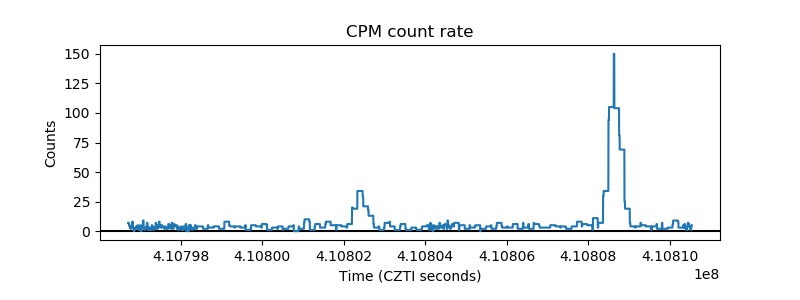 |
| CZT Counter | 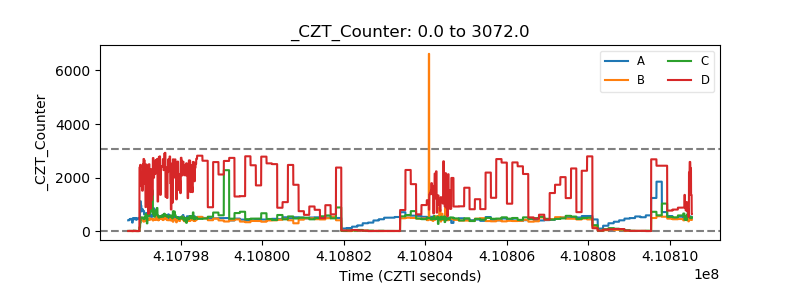 |
| +2.5 Volts monitor |  |
| +5 Volts monitor | 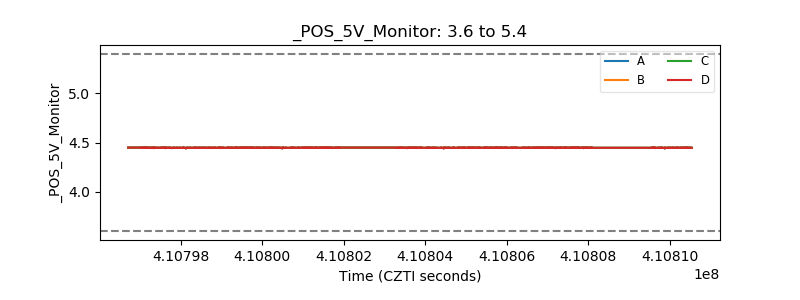 |
| _ROLL_ROT | 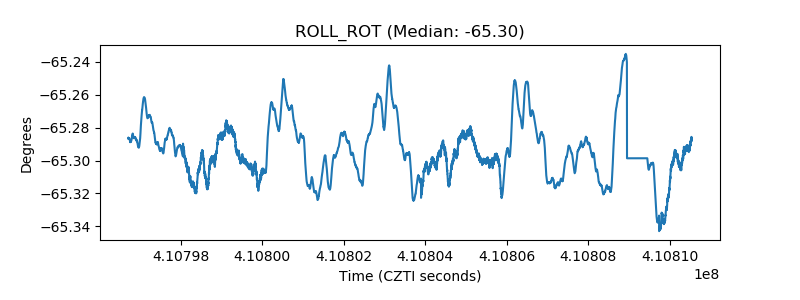 |
| _Roll_DEC | 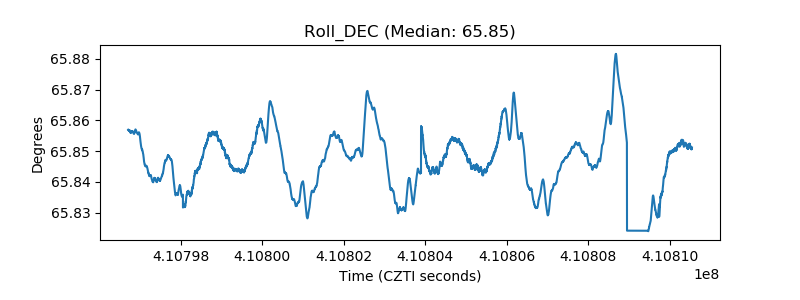 |
| _Roll_RA | 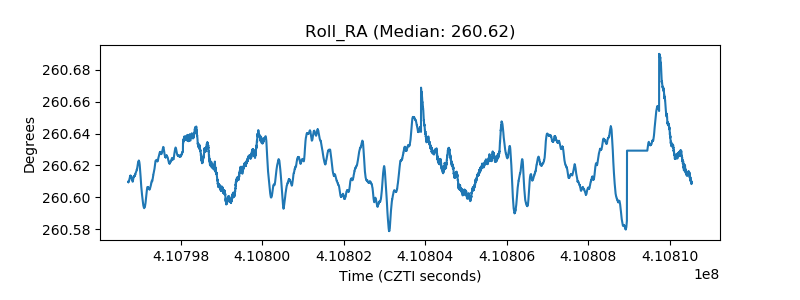 |
| Veto Counter | 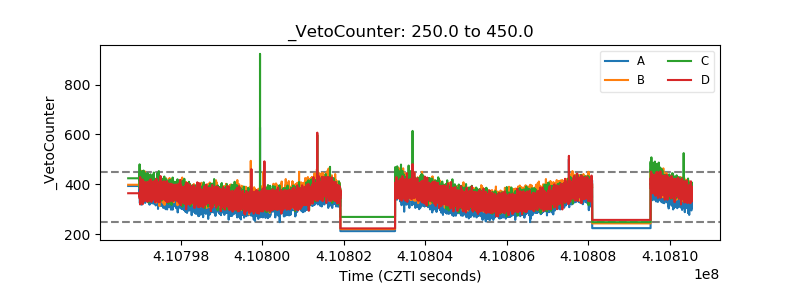 |