| Param | Original file | Final file |
|---|---|---|
| Filename | modeM0/AS1A12_018T01_9000005470_39355cztM0_level2.fits | modeM0/AS1A12_018T01_9000005470_39355cztM0_level2_quad_clean.evt |
| Size (bytes) | 431,501,760 | 87,756,480 |
| Size | 411.5 MB | 83.7 MB |
| Events in quadrant A | 2,717,276 | 609,839 |
| Events in quadrant B | 2,385,145 | 623,969 |
| Events in quadrant C | 2,762,772 | 595,931 |
| Events in quadrant D | 7,684,160 | 446,558 |
| Mode M9 | |||
|---|---|---|---|
| Quadrant | BADHDUFLAG | Total packets | Discarded packets |
| A | 0 | 17 | 0 |
| B | 0 | 17 | 0 |
| C | 0 | 17 | 0 |
| D | 0 | 17 | 0 |
| Mode SS | |||
|---|---|---|---|
| Quadrant | BADHDUFLAG | Total packets | Discarded packets |
| A | 0 | 110 | 0 |
| B | 0 | 110 | 0 |
| C | 0 | 110 | 0 |
| D | 0 | 110 | 0 |
| Mode M0 | |||
|---|---|---|---|
| Quadrant | BADHDUFLAG | Total packets | Discarded packets |
| A | 0 | 11596 | 2 |
| B | 0 | 10986 | 1 |
| C | 0 | 11737 | 1 |
| D | 0 | 26599 | 1 |
| Quadrant | Total seconds | Saturated seconds | Saturation percentage |
|---|---|---|---|
| A | 5444 | 9 | 0.165320% |
| B | 5444 | 5 | 0.091844% |
| C | 5444 | 19 | 0.349008% |
| D | 5444 | 1429 | 26.249082% |
Noise dominated data is calculated using 1-second bins in cleaned event files. If a bin has >2000 counts, and if more than 50% of those come from <1% of pixels, then it is considered to be noise-dominated and hence unusable.
| Quadrant | # 1 sec bins | Bins with >0 counts | Bins with >2000 counts | High rate bins dominated by noise | Noise dominated (total time) | Noise dominated (detector-on time) | Marked lightcurve |
|---|---|---|---|---|---|---|---|
| A | 7117 | 5445 | 2 | 2 | 0.03% | 0.04% | 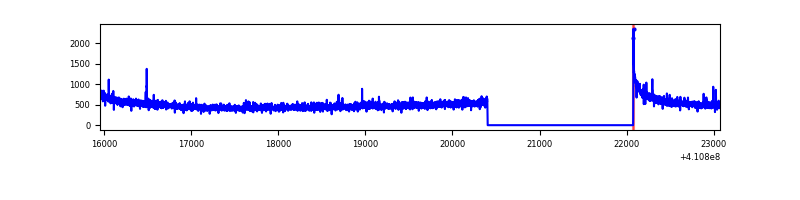 |
| B | 7117 | 5445 | 3 | 3 | 0.04% | 0.06% | 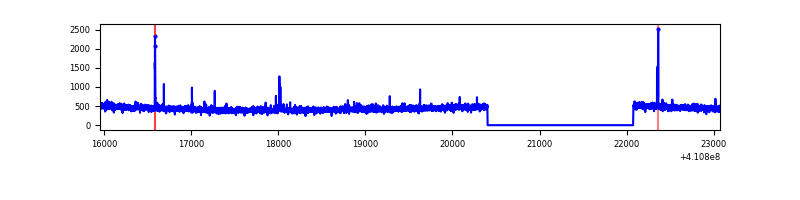 |
| C | 7117 | 5445 | 15 | 15 | 0.21% | 0.28% | 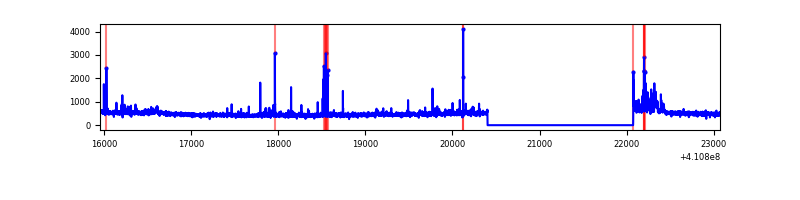 |
| D | 7117 | 5445 | 1232 | 1232 | 17.31% | 22.63% | 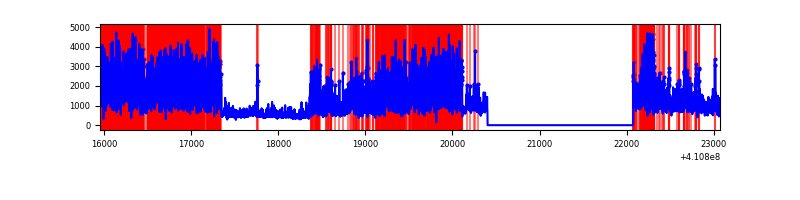 |
Top three noisy pixels from each quadrant. If the there are fewer than three noisy pixels in the level2.evt file, extra rows are filled as -1
| Pixel properties | Quadrant properties | ||||||
|---|---|---|---|---|---|---|---|
| Quadrant | DetID | PixID | Counts | Sigma | Mean | Median | Sigma |
| A | 10 | 83 | 377319 | 3084.25 | 596 | 583 | 122.1 |
| A | 15 | 223 | 12447 | 97.13 | 596 | 583 | 122.1 |
| A | 13 | 248 | 10527 | 81.41 | 596 | 583 | 122.1 |
| B | 5 | 172 | 35017 | 298.73 | 595 | 577 | 115.3 |
| B | 12 | 111 | 14675 | 122.28 | 595 | 577 | 115.3 |
| B | 11 | 111 | 13389 | 111.13 | 595 | 577 | 115.3 |
| C | 15 | 214 | 245037 | 1768.77 | 585 | 587 | 138.2 |
| C | 9 | 187 | 95115 | 683.98 | 585 | 587 | 138.2 |
| C | 14 | 254 | 87183 | 626.58 | 585 | 587 | 138.2 |
| D | 12 | 235 | 5217866 | 40953.91 | 527 | 513 | 127.4 |
| D | 2 | 249 | 193138 | 1512.02 | 527 | 513 | 127.4 |
| D | 13 | 249 | 108840 | 850.32 | 527 | 513 | 127.4 |
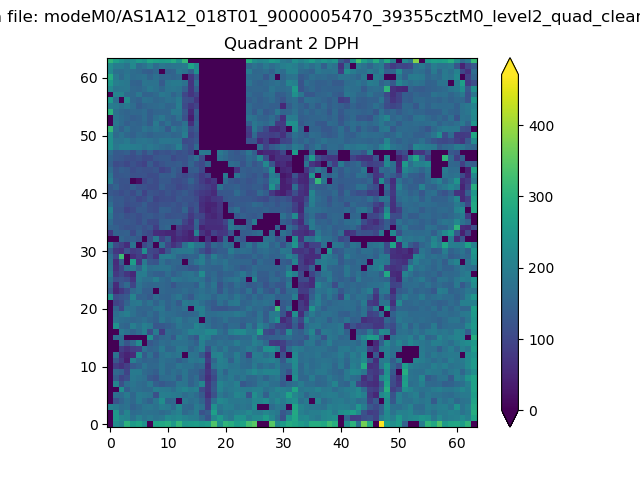
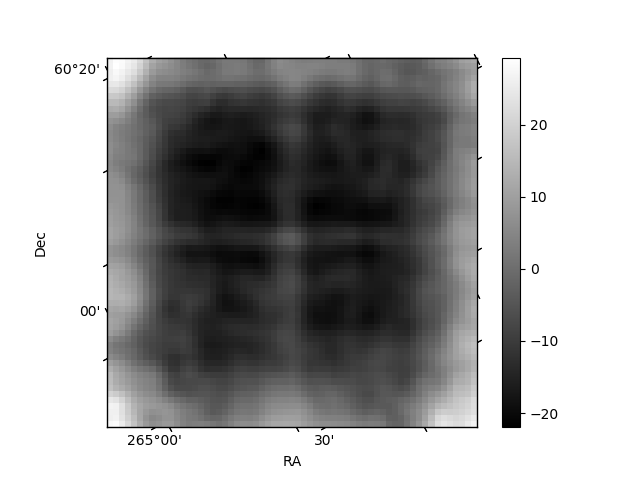
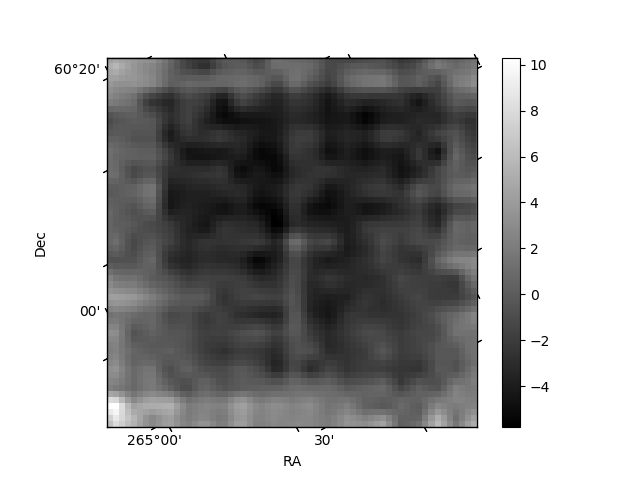
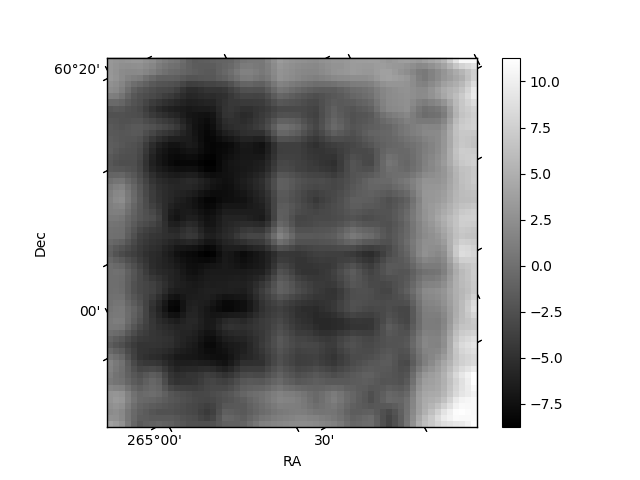
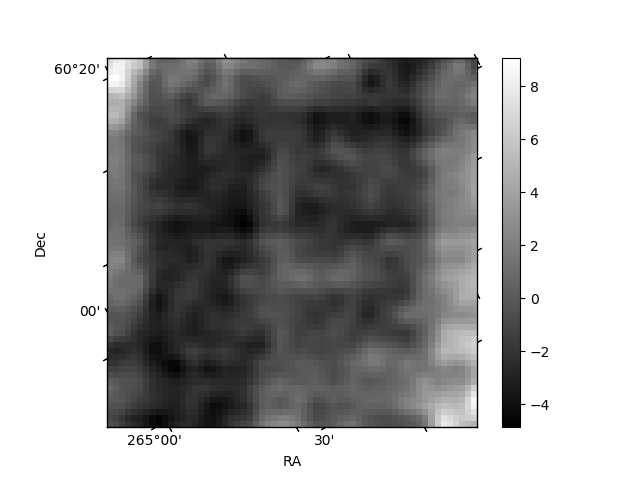
Histogram calculated using DETX and DETY for each event in the final _common_clean file
| Quadrant A | 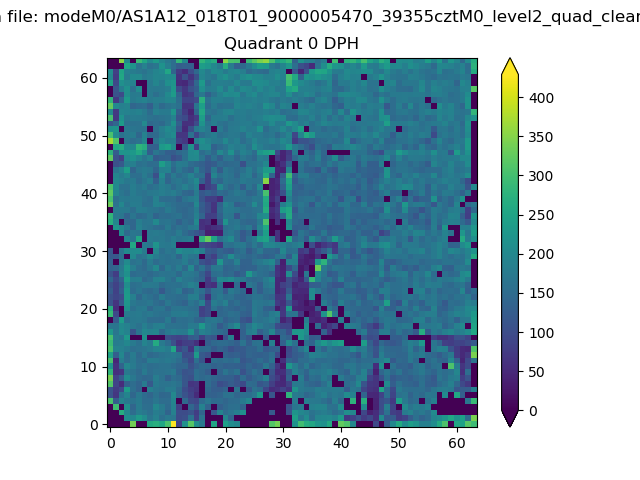 |
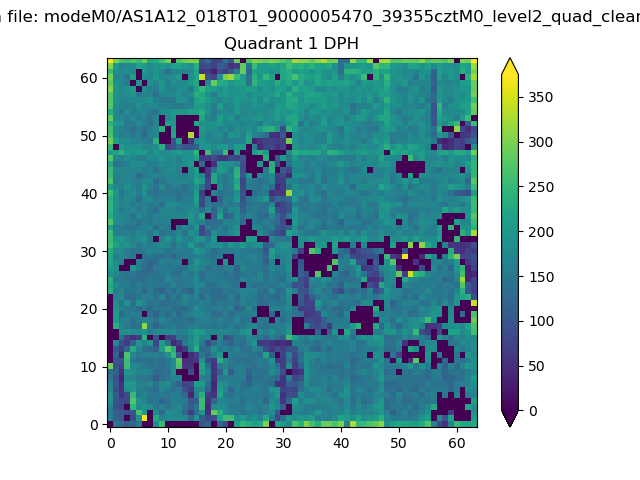 |
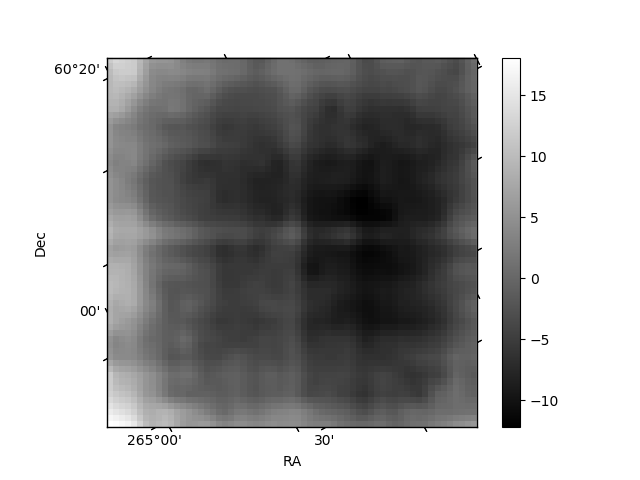
Quadrant B |
|---|---|---|---|
| Quadrant D | 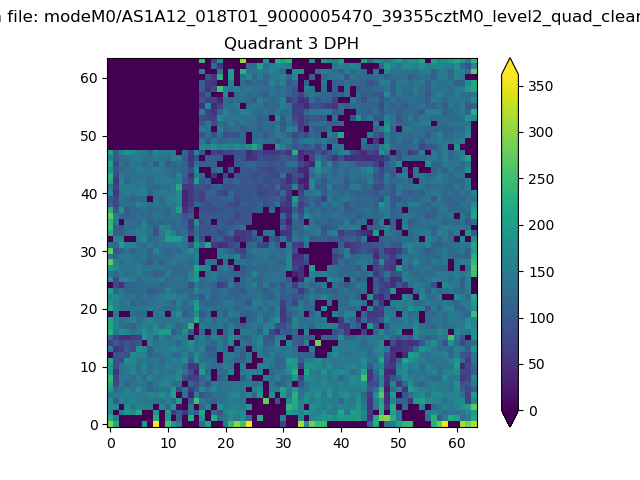 |
 |
Quadrant C |
| Plot type | Count rate plots | Images |
|---|---|---|
| Comparison with Poisson distribution Blue bars denote a histogram of data divided into 1 sec bins. Red curve is a Poisson curve with rate = median count rate of data. |
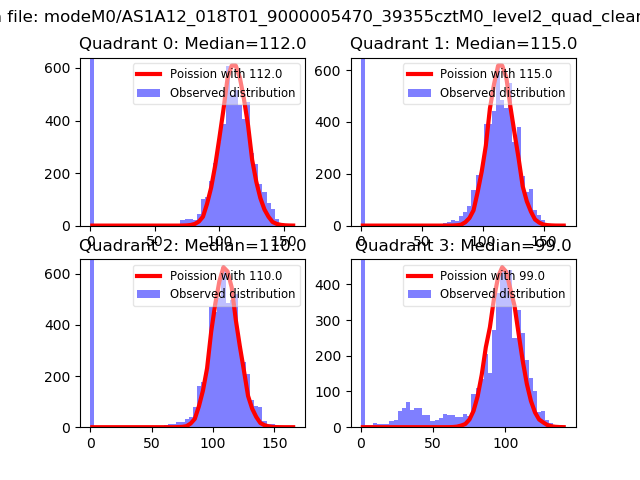 |
 |
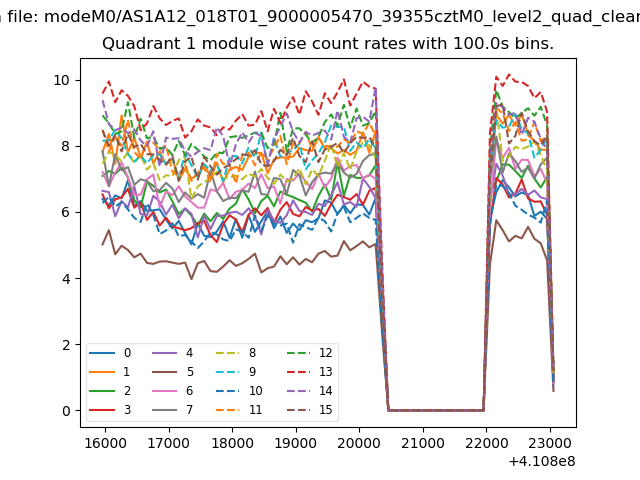
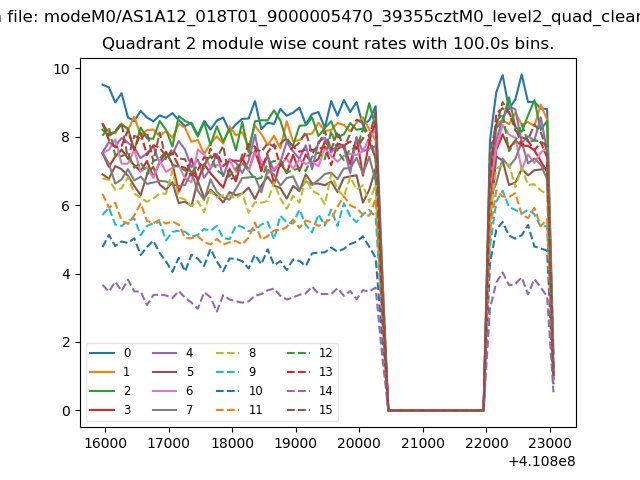
| Quadrant-wise count rates Data is divided into 100 sec bins |
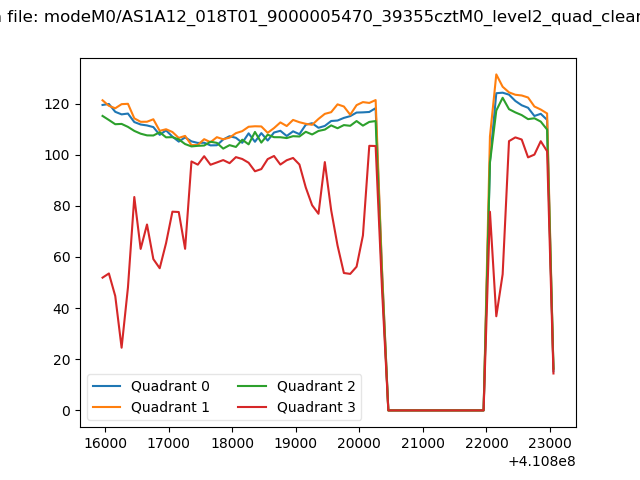 |
|
| Module-wise count rates for Quadrant A Data is divided into 100 sec bins |
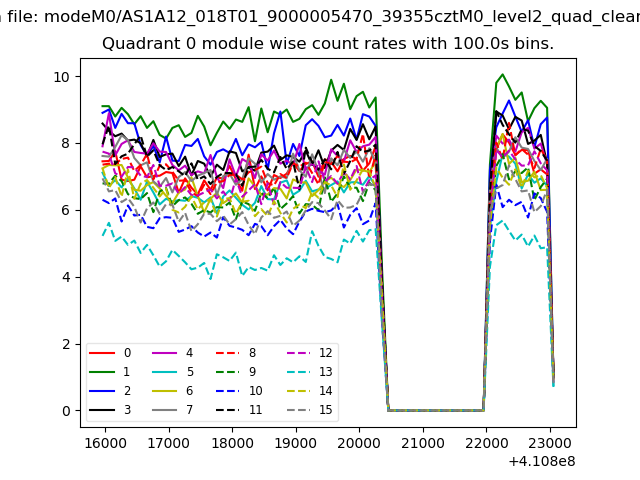 |
 |
| Module-wise count rates for Quadrant B Data is divided into 100 sec bins |
 |
 |
| Module-wise count rates for Quadrant C Data is divided into 100 sec bins |
 |
 |
| Module-wise count rates for Quadrant D Data is divided into 100 sec bins |
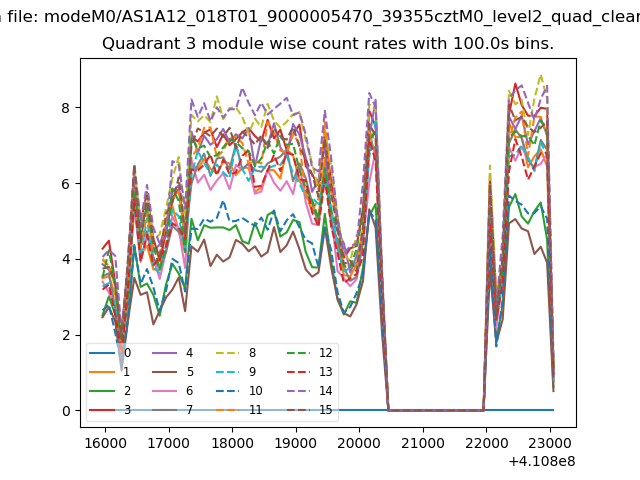 |
 |
| Parameter | Plot |
|---|---|
| CZT HV Monitor | 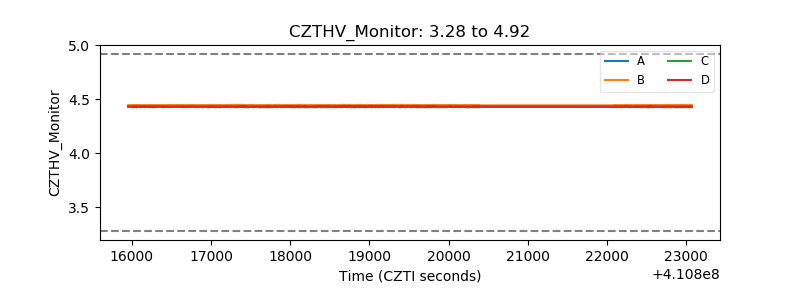 |
| D_VDD | 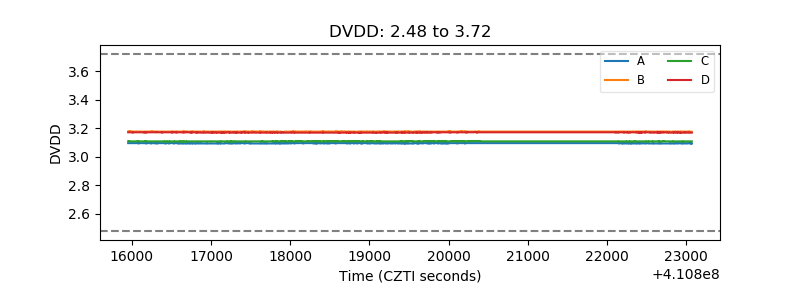 |
| Temperature 1 | 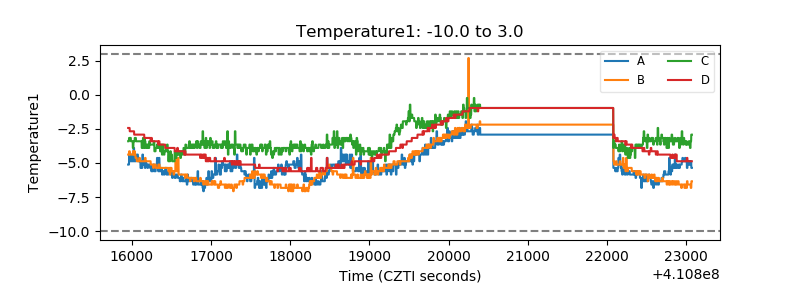 |
| Veto HV Monitor | 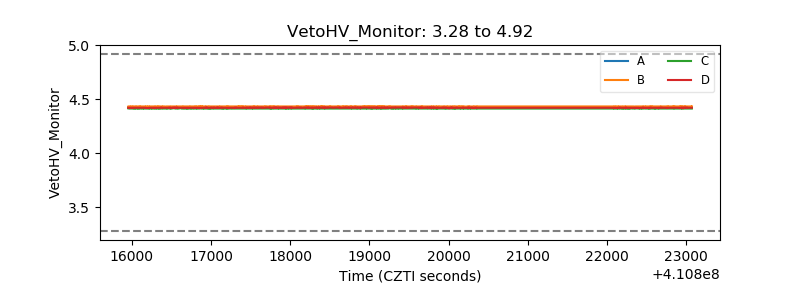 |
| Veto LLD | 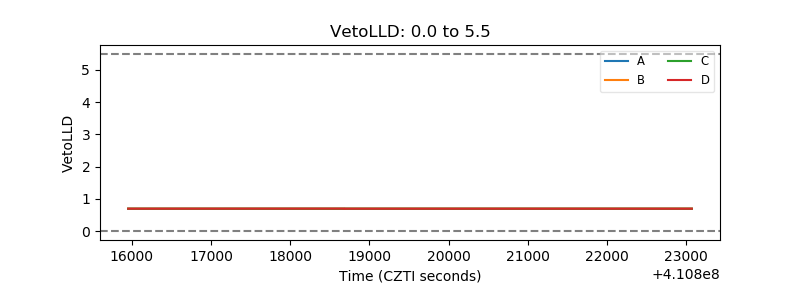 |
| Alpha Counter | 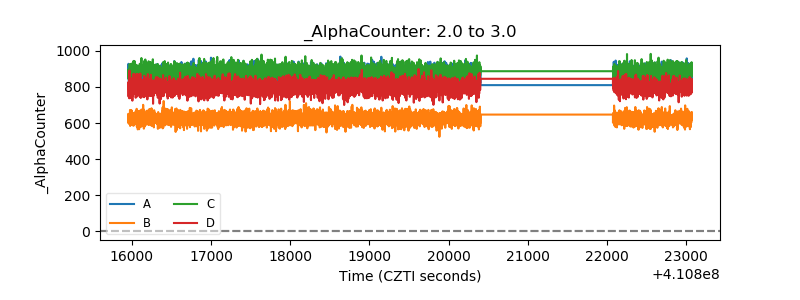 |
| _CPM_Rate | 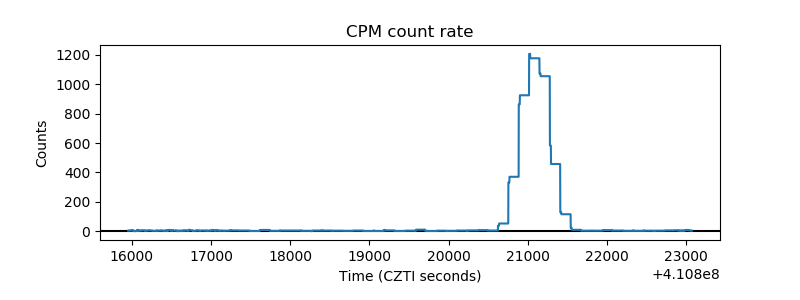 |
| CZT Counter | 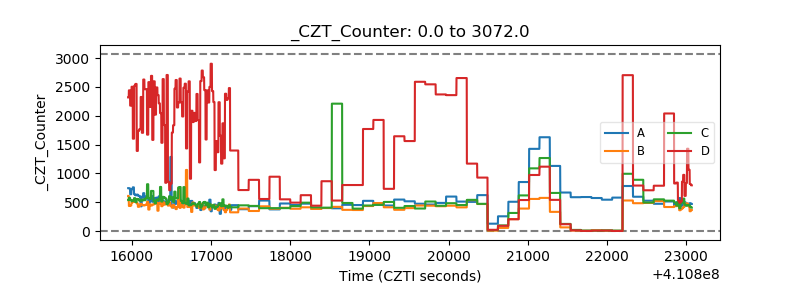 |
| +2.5 Volts monitor |  |
| +5 Volts monitor | 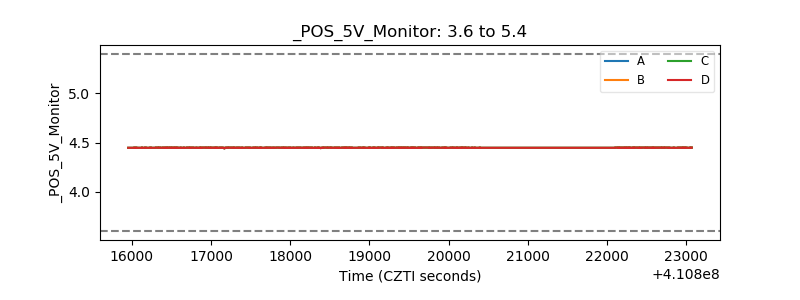 |
| _ROLL_ROT | 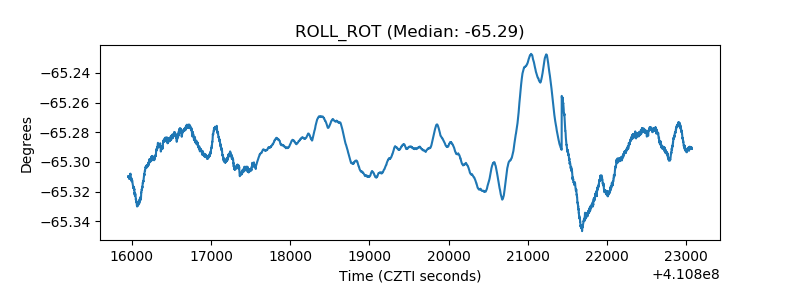 |
| _Roll_DEC | 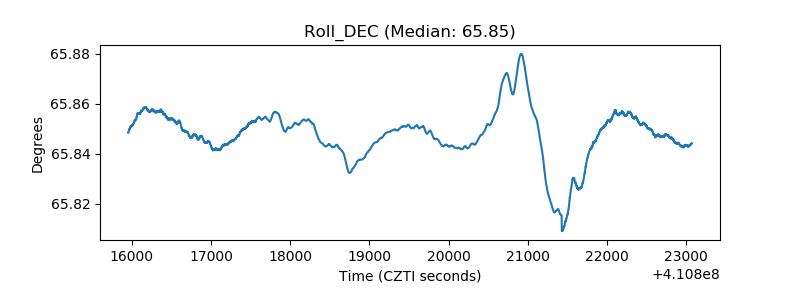 |
| _Roll_RA | 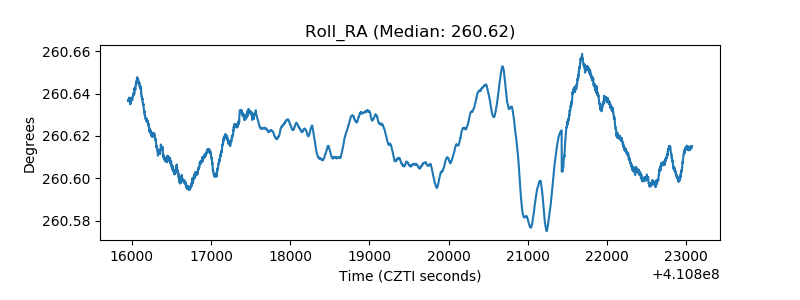 |
| Veto Counter | 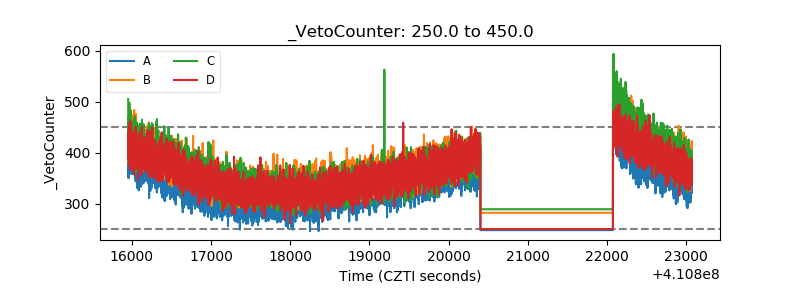 |