| Param | Original file | Final file |
|---|---|---|
| Filename | modeM0/AS1A12_018T01_9000005470_39358cztM0_level2.fits | modeM0/AS1A12_018T01_9000005470_39358cztM0_level2_quad_clean.evt |
| Size (bytes) | 392,719,680 | 95,348,160 |
| Size | 374.5 MB | 90.9 MB |
| Events in quadrant A | 2,840,845 | 652,053 |
| Events in quadrant B | 2,466,799 | 678,206 |
| Events in quadrant C | 2,811,194 | 638,663 |
| Events in quadrant D | 5,996,060 | 537,784 |
| Mode M9 | |||
|---|---|---|---|
| Quadrant | BADHDUFLAG | Total packets | Discarded packets |
| A | 0 | 21 | 0 |
| B | 0 | 21 | 0 |
| C | 0 | 21 | 0 |
| D | 0 | 22 | 0 |
| Mode SS | |||
|---|---|---|---|
| Quadrant | BADHDUFLAG | Total packets | Discarded packets |
| A | 0 | 112 | 0 |
| B | 0 | 112 | 0 |
| C | 0 | 112 | 0 |
| D | 0 | 112 | 0 |
| Mode M0 | |||
|---|---|---|---|
| Quadrant | BADHDUFLAG | Total packets | Discarded packets |
| A | 0 | 11811 | 3 |
| B | 0 | 11053 | 2 |
| C | 0 | 11752 | 2 |
| D | 0 | 21607 | 2 |
| Quadrant | Total seconds | Saturated seconds | Saturation percentage |
|---|---|---|---|
| A | 5431 | 16 | 0.294605% |
| B | 5431 | 10 | 0.184128% |
| C | 5431 | 18 | 0.331431% |
| D | 5431 | 616 | 11.342294% |
Noise dominated data is calculated using 1-second bins in cleaned event files. If a bin has >2000 counts, and if more than 50% of those come from <1% of pixels, then it is considered to be noise-dominated and hence unusable.
| Quadrant | # 1 sec bins | Bins with >0 counts | Bins with >2000 counts | High rate bins dominated by noise | Noise dominated (total time) | Noise dominated (detector-on time) | Marked lightcurve |
|---|---|---|---|---|---|---|---|
| A | 7343 | 5432 | 7 | 7 | 0.10% | 0.13% | 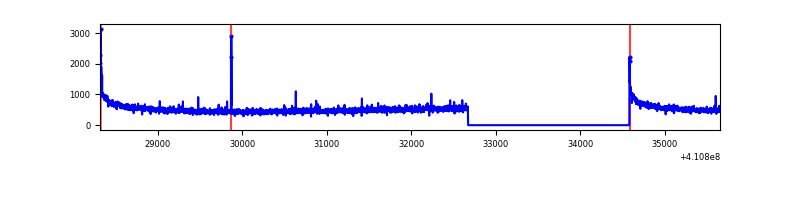 |
| B | 7343 | 5432 | 5 | 5 | 0.07% | 0.09% | 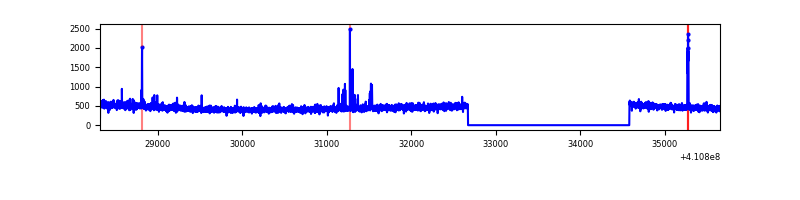 |
| C | 7343 | 5432 | 12 | 12 | 0.16% | 0.22% | 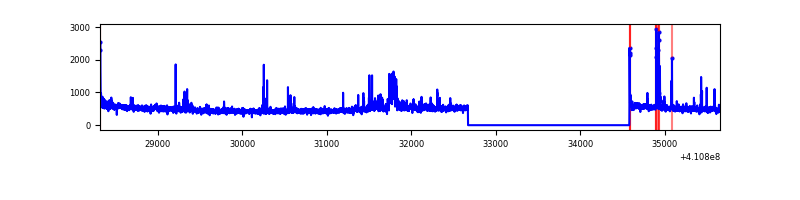 |
| D | 7343 | 5432 | 616 | 616 | 8.39% | 11.34% | 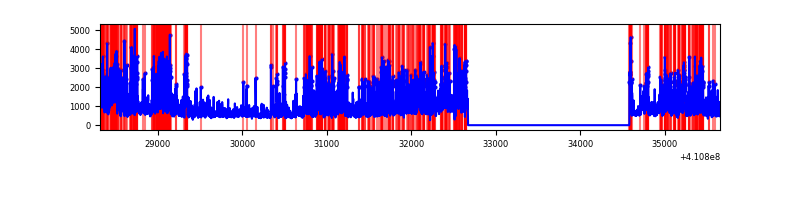 |
Top three noisy pixels from each quadrant. If the there are fewer than three noisy pixels in the level2.evt file, extra rows are filled as -1
| Pixel properties | Quadrant properties | ||||||
|---|---|---|---|---|---|---|---|
| Quadrant | DetID | PixID | Counts | Sigma | Mean | Median | Sigma |
| A | 10 | 83 | 422630 | 3394.42 | 611 | 599 | 124.3 |
| A | 15 | 223 | 22703 | 177.78 | 611 | 599 | 124.3 |
| A | 2 | 79 | 14873 | 114.81 | 611 | 599 | 124.3 |
| B | 5 | 172 | 56206 | 473.08 | 612 | 595 | 117.6 |
| B | 12 | 111 | 14547 | 118.69 | 612 | 595 | 117.6 |
| B | 11 | 111 | 13209 | 107.31 | 612 | 595 | 117.6 |
| C | 15 | 214 | 248361 | 1795.87 | 595 | 600 | 138.0 |
| C | 9 | 187 | 114413 | 824.96 | 595 | 600 | 138.0 |
| C | 14 | 254 | 66510 | 477.74 | 595 | 600 | 138.0 |
| D | 12 | 235 | 3001153 | 21679.36 | 563 | 546 | 138.4 |
| D | 2 | 249 | 229509 | 1654.26 | 563 | 546 | 138.4 |
| D | 13 | 249 | 204407 | 1472.89 | 563 | 546 | 138.4 |
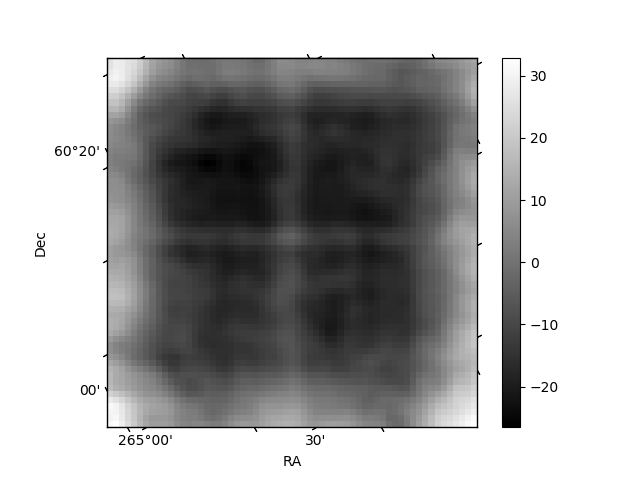
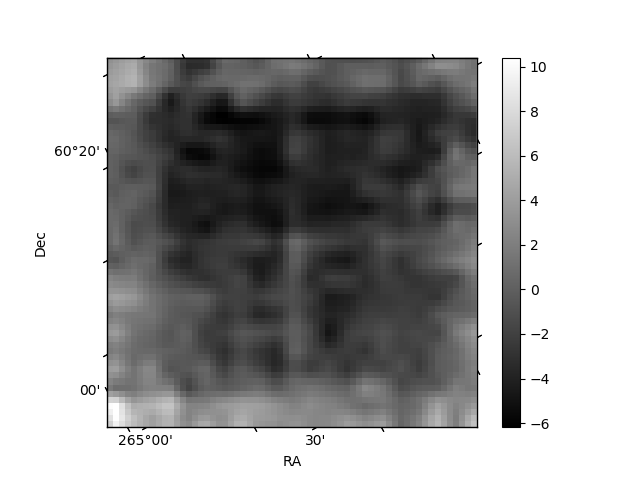
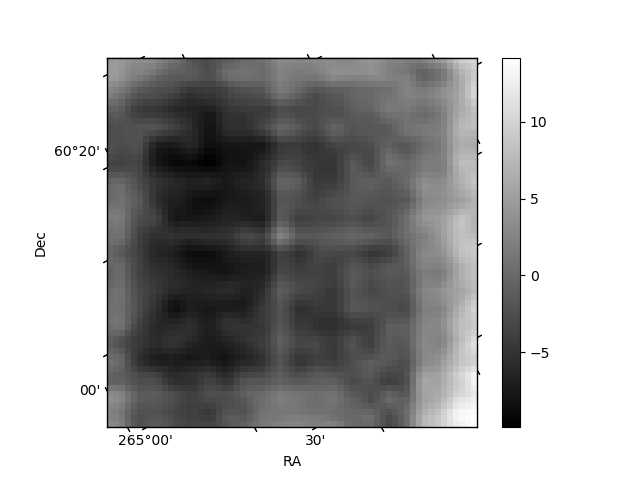
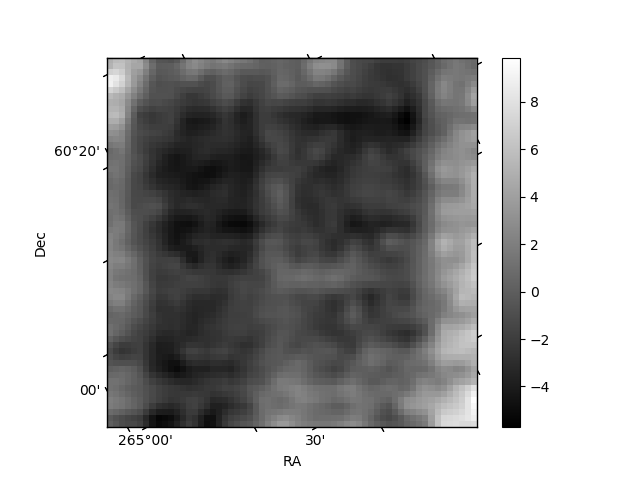
Histogram calculated using DETX and DETY for each event in the final _common_clean file
| Quadrant A | 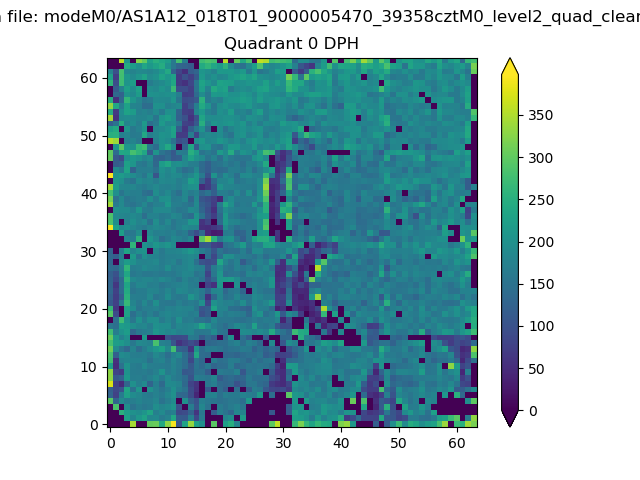 |
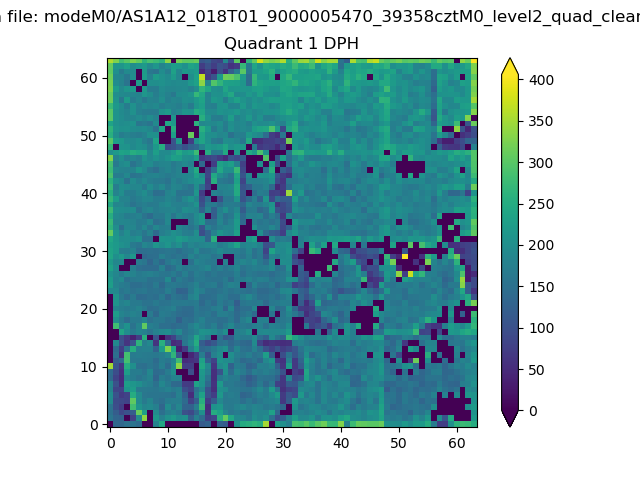 |
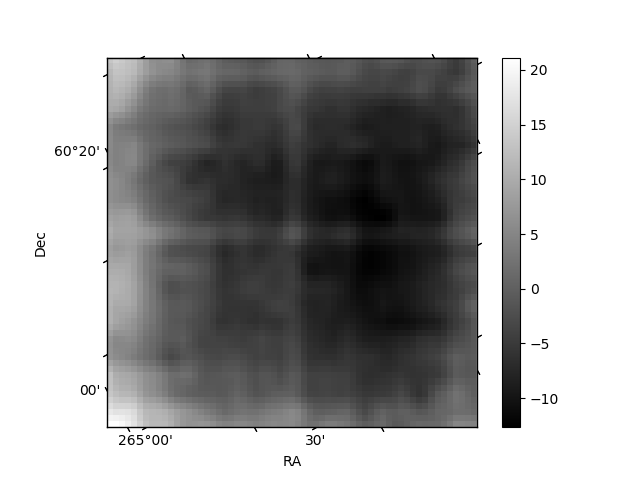
Quadrant B |
|---|---|---|---|
| Quadrant D | 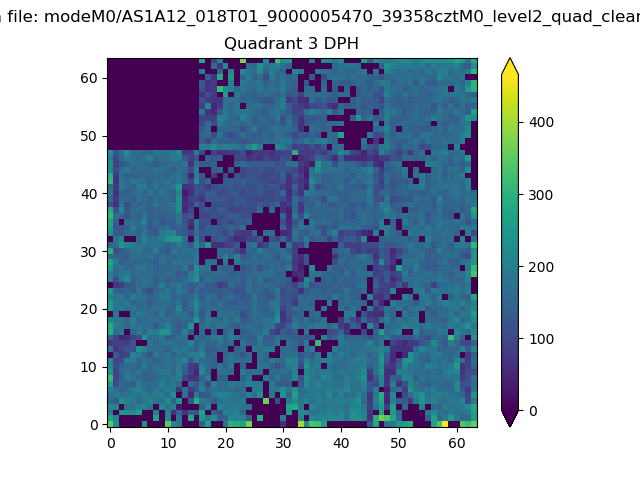 |
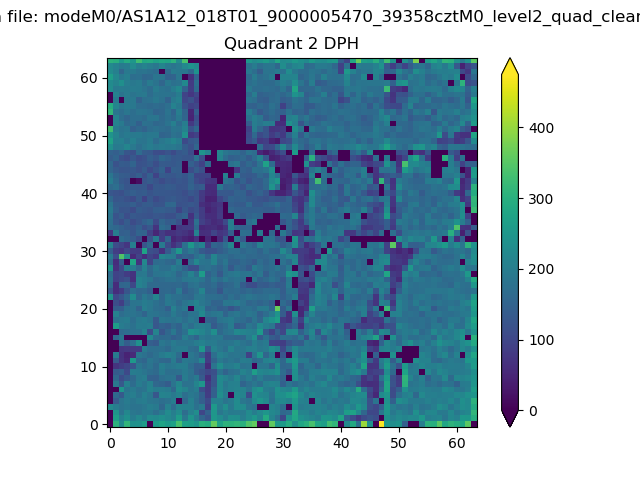 |
Quadrant C |
| Plot type | Count rate plots | Images |
|---|---|---|
| Comparison with Poisson distribution Blue bars denote a histogram of data divided into 1 sec bins. Red curve is a Poisson curve with rate = median count rate of data. |
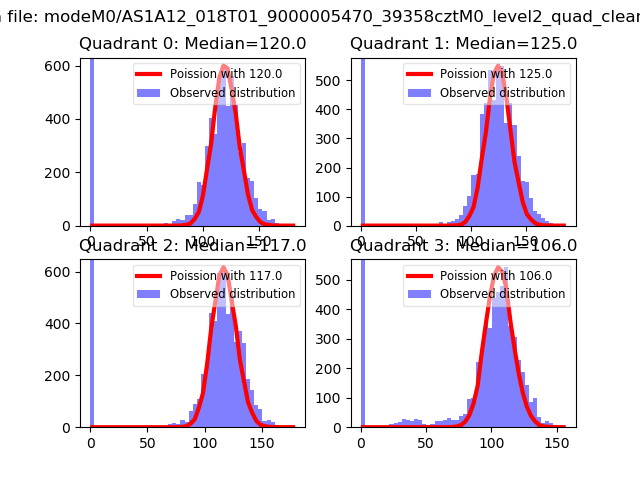 |
 |
| Quadrant-wise count rates Data is divided into 100 sec bins |
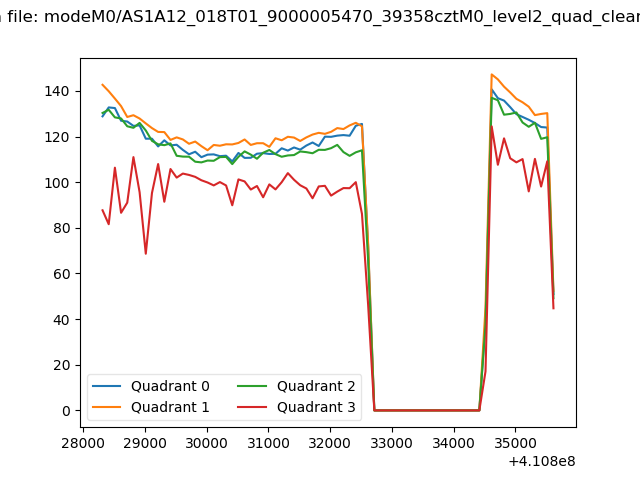 |
|
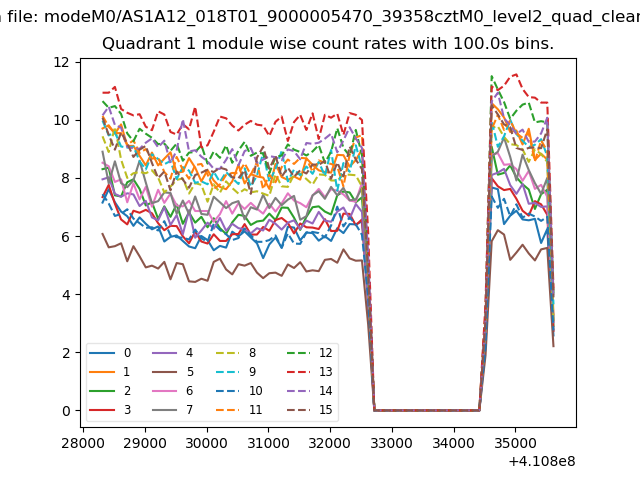
| Module-wise count rates for Quadrant A Data is divided into 100 sec bins |
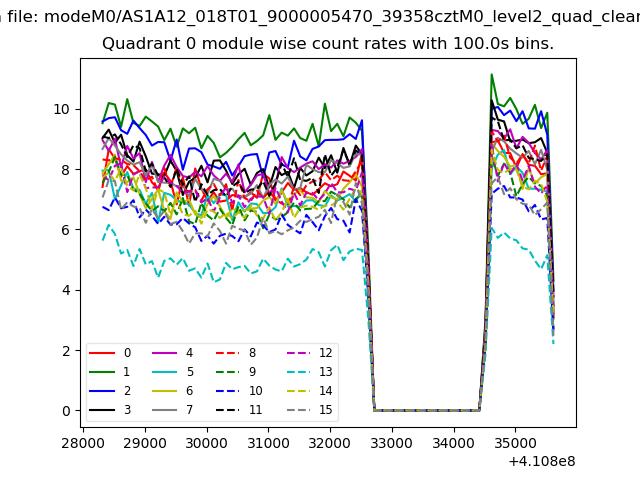 |
 |
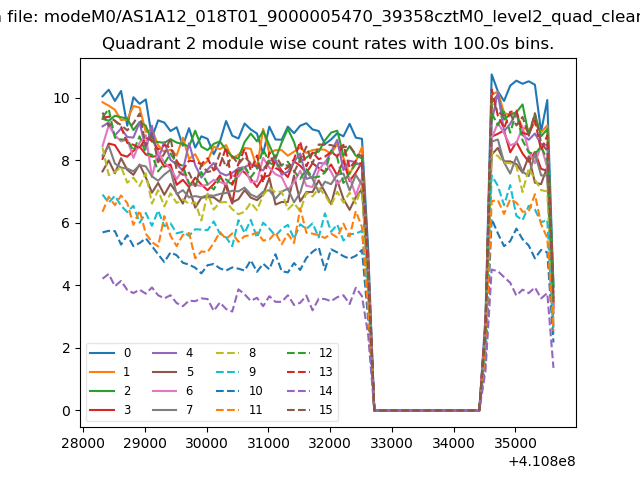
| Module-wise count rates for Quadrant B Data is divided into 100 sec bins |
 |
 |
| Module-wise count rates for Quadrant C Data is divided into 100 sec bins |
 |
 |
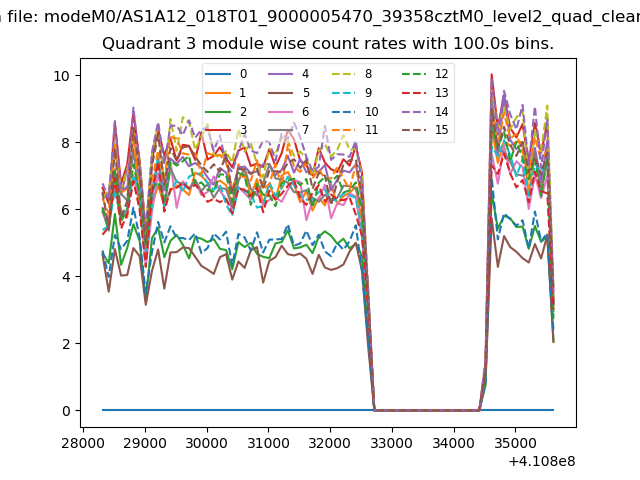
| Module-wise count rates for Quadrant D Data is divided into 100 sec bins |
 |
 |
| Parameter | Plot |
|---|---|
| CZT HV Monitor | 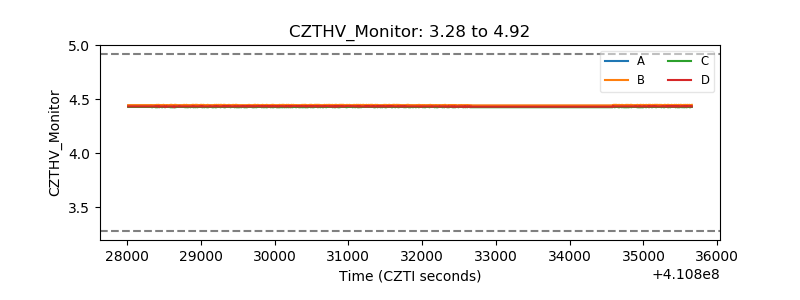 |
| D_VDD | 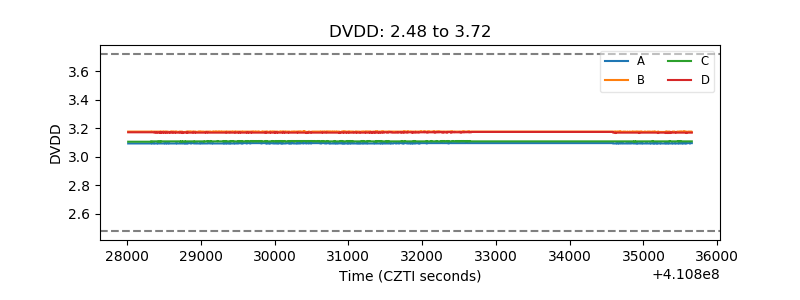 |
| Temperature 1 | 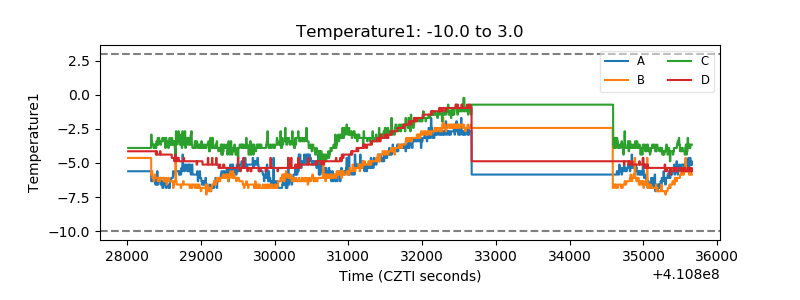 |
| Veto HV Monitor | 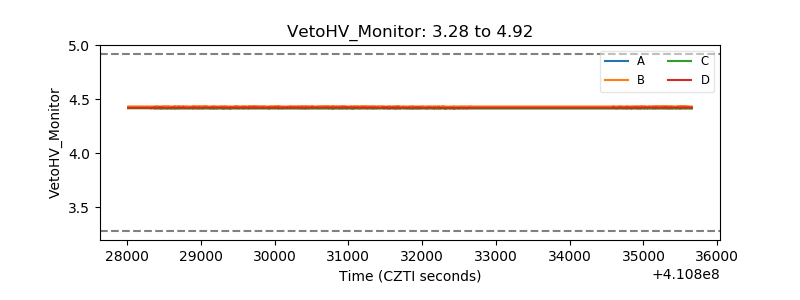 |
| Veto LLD | 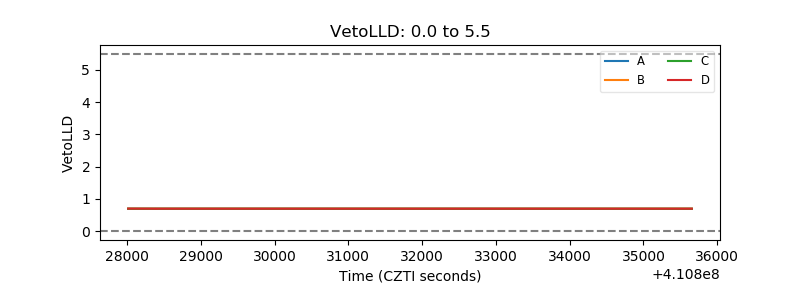 |
| Alpha Counter |  |
| _CPM_Rate | 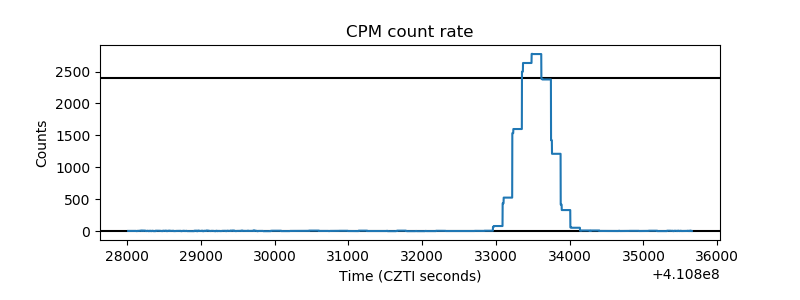 |
| CZT Counter | 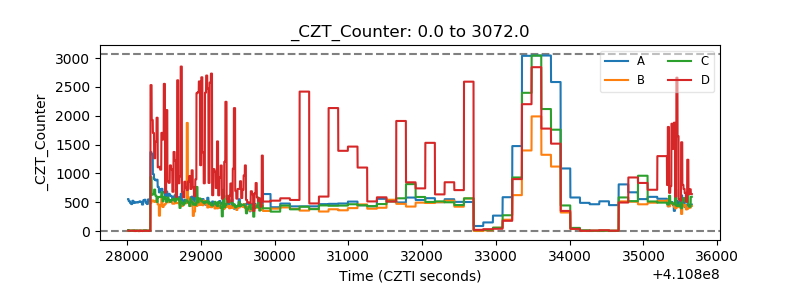 |
| +2.5 Volts monitor |  |
| +5 Volts monitor | 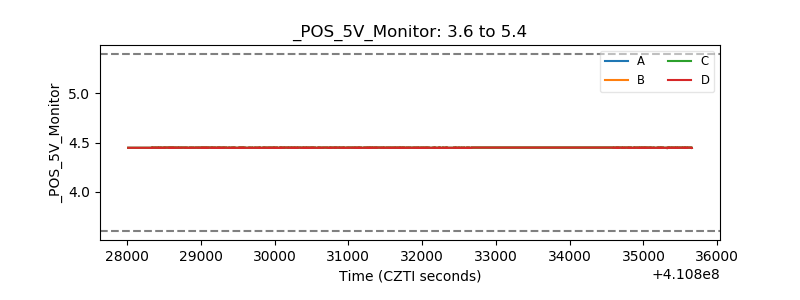 |
| _ROLL_ROT | 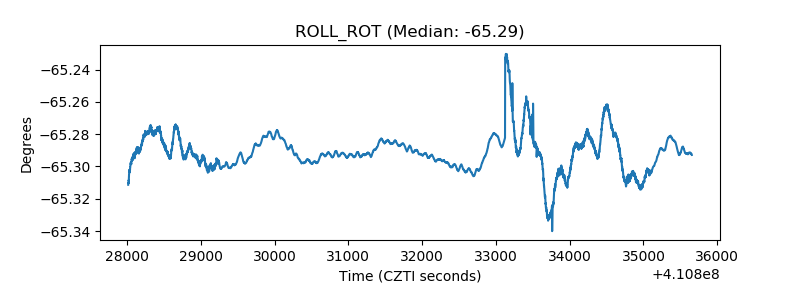 |
| _Roll_DEC | 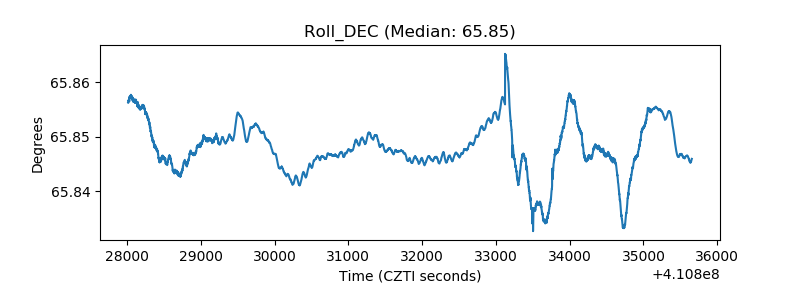 |
| _Roll_RA | 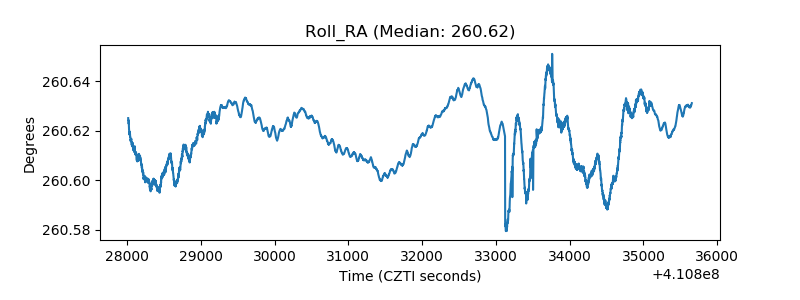 |
| Veto Counter | 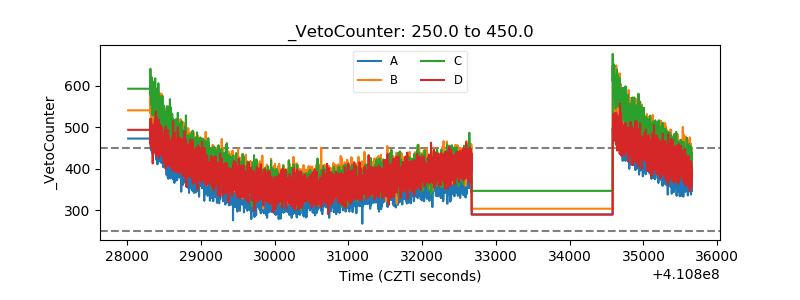 |