| Param | Original file | Final file |
|---|---|---|
| Filename | modeM0/AS1A12_018T01_9000005470_39359cztM0_level2.fits | modeM0/AS1A12_018T01_9000005470_39359cztM0_level2_quad_clean.evt |
| Size (bytes) | 360,227,520 | 95,688,000 |
| Size | 343.5 MB | 91.3 MB |
| Events in quadrant A | 2,821,050 | 653,933 |
| Events in quadrant B | 2,430,562 | 680,906 |
| Events in quadrant C | 2,734,159 | 635,130 |
| Events in quadrant D | 4,937,696 | 557,718 |
| Mode M9 | |||
|---|---|---|---|
| Quadrant | BADHDUFLAG | Total packets | Discarded packets |
| A | 0 | 23 | 0 |
| B | 0 | 23 | 0 |
| C | 0 | 23 | 0 |
| D | 0 | 24 | 0 |
| Mode SS | |||
|---|---|---|---|
| Quadrant | BADHDUFLAG | Total packets | Discarded packets |
| A | 0 | 108 | 0 |
| B | 0 | 108 | 0 |
| C | 0 | 108 | 0 |
| D | 0 | 108 | 0 |
| Mode M0 | |||
|---|---|---|---|
| Quadrant | BADHDUFLAG | Total packets | Discarded packets |
| A | 0 | 11579 | 3 |
| B | 0 | 10733 | 2 |
| C | 0 | 11423 | 2 |
| D | 0 | 18388 | 2 |
| Quadrant | Total seconds | Saturated seconds | Saturation percentage |
|---|---|---|---|
| A | 5284 | 13 | 0.246026% |
| B | 5284 | 7 | 0.132475% |
| C | 5284 | 13 | 0.246026% |
| D | 5284 | 279 | 5.280091% |
Noise dominated data is calculated using 1-second bins in cleaned event files. If a bin has >2000 counts, and if more than 50% of those come from <1% of pixels, then it is considered to be noise-dominated and hence unusable.
| Quadrant | # 1 sec bins | Bins with >0 counts | Bins with >2000 counts | High rate bins dominated by noise | Noise dominated (total time) | Noise dominated (detector-on time) | Marked lightcurve |
|---|---|---|---|---|---|---|---|
| A | 7316 | 5285 | 8 | 8 | 0.11% | 0.15% | 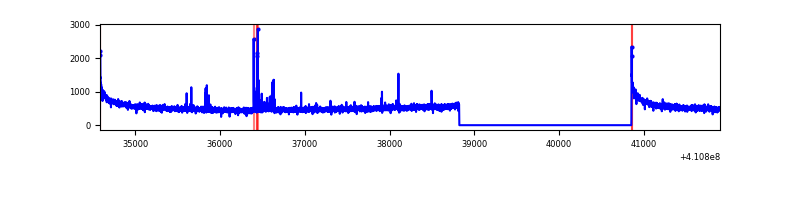 |
| B | 7316 | 5285 | 3 | 3 | 0.04% | 0.06% | 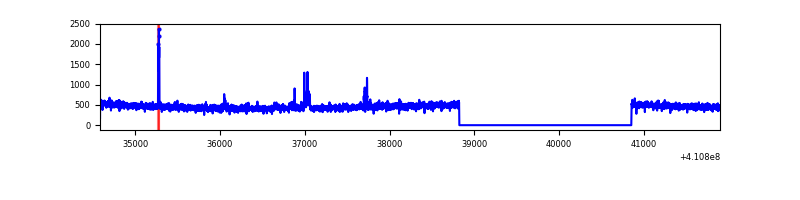 |
| C | 7316 | 5285 | 14 | 14 | 0.19% | 0.26% | 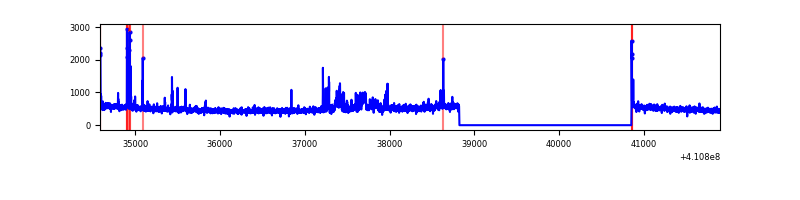 |
| D | 7316 | 5285 | 314 | 314 | 4.29% | 5.94% | 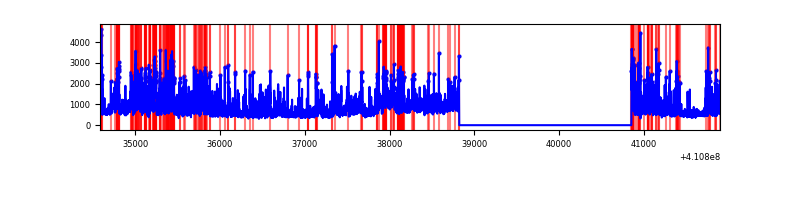 |
Top three noisy pixels from each quadrant. If the there are fewer than three noisy pixels in the level2.evt file, extra rows are filled as -1
| Pixel properties | Quadrant properties | ||||||
|---|---|---|---|---|---|---|---|
| Quadrant | DetID | PixID | Counts | Sigma | Mean | Median | Sigma |
| A | 10 | 83 | 421017 | 3460.13 | 602 | 593 | 121.5 |
| A | 13 | 248 | 52202 | 424.75 | 602 | 593 | 121.5 |
| A | 2 | 79 | 16418 | 130.24 | 602 | 593 | 121.5 |
| B | 5 | 172 | 68935 | 589.85 | 602 | 587 | 115.9 |
| B | 12 | 111 | 14039 | 116.09 | 602 | 587 | 115.9 |
| B | 11 | 111 | 12899 | 106.25 | 602 | 587 | 115.9 |
| C | 15 | 214 | 234975 | 1745.36 | 581 | 584 | 134.3 |
| C | 9 | 187 | 134424 | 996.62 | 581 | 584 | 134.3 |
| C | 14 | 254 | 52058 | 383.29 | 581 | 584 | 134.3 |
| D | 12 | 235 | 1801494 | 13127.49 | 565 | 548 | 137.2 |
| D | 12 | 227 | 638007 | 4646.58 | 565 | 548 | 137.2 |
| D | 2 | 249 | 113530 | 823.55 | 565 | 548 | 137.2 |
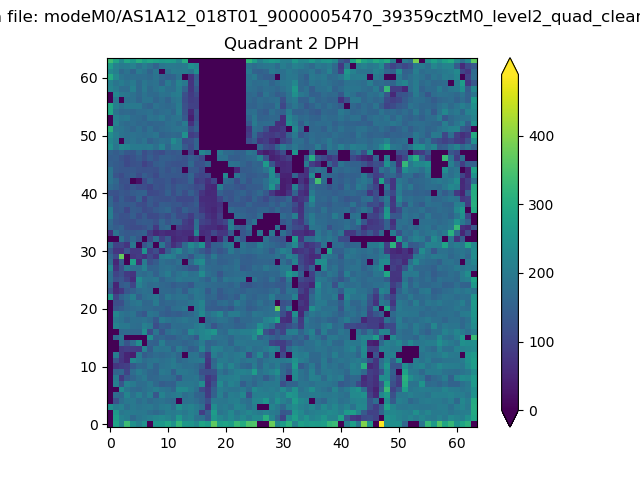
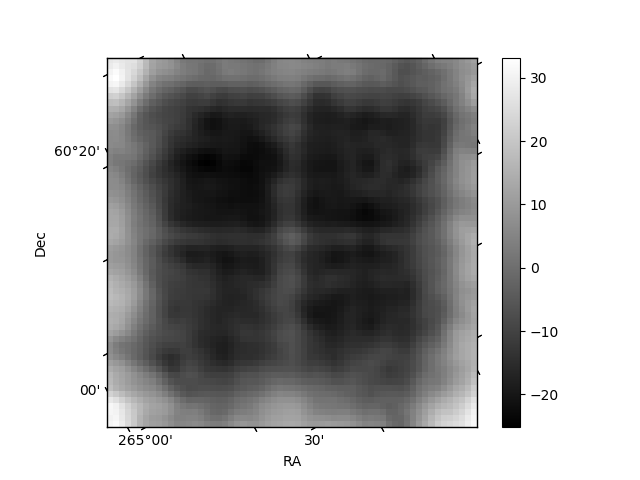
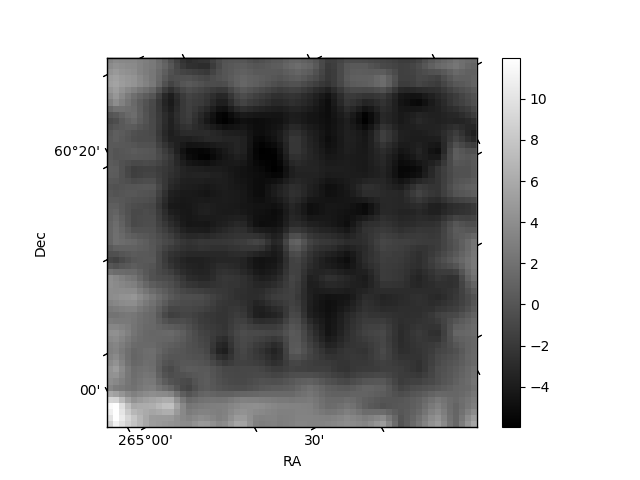
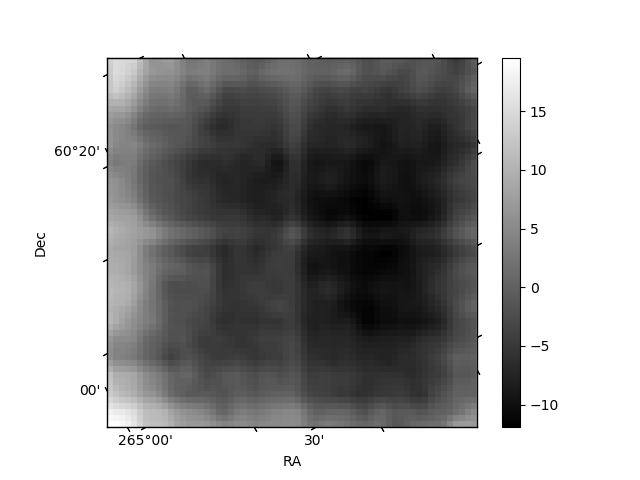
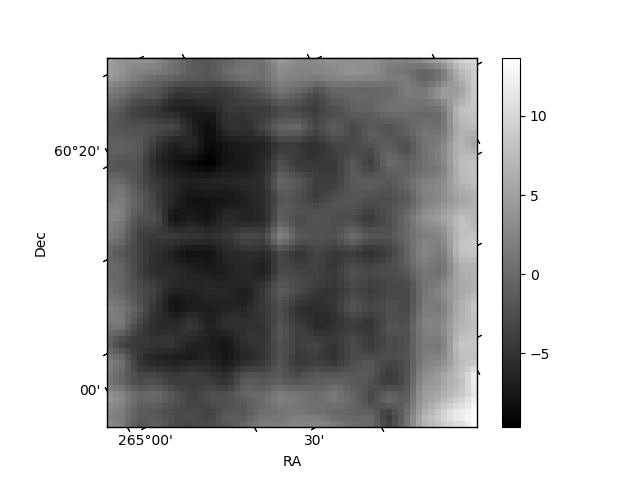
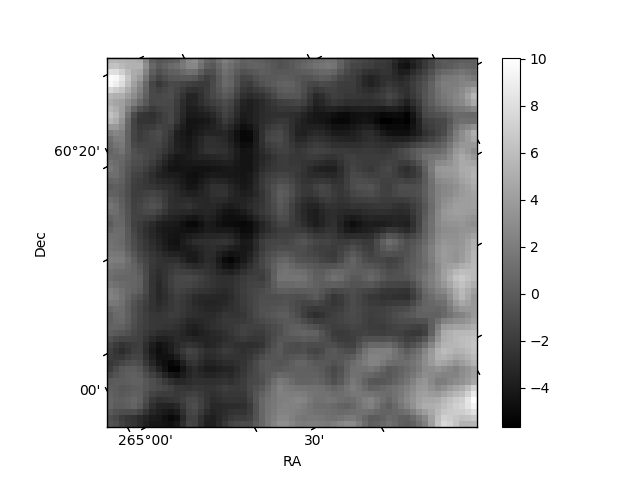
Histogram calculated using DETX and DETY for each event in the final _common_clean file
| Quadrant A | 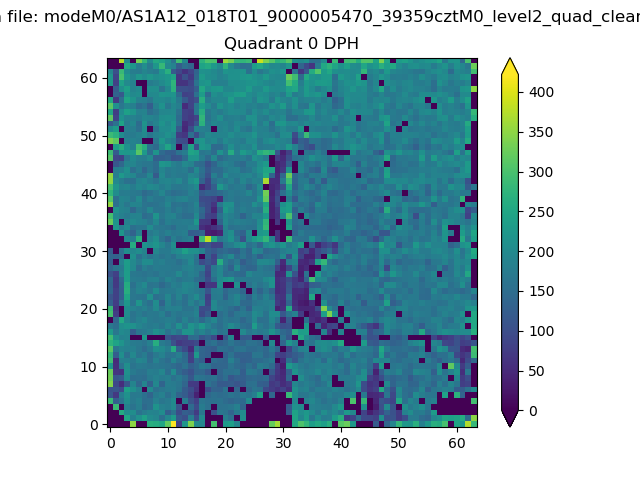 |
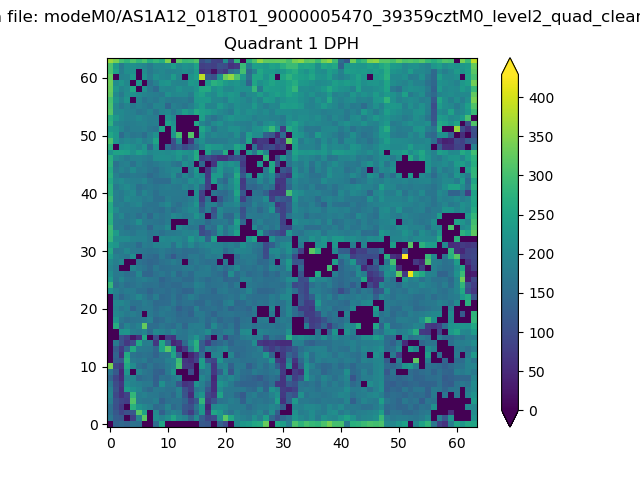 |
Quadrant B |
|---|---|---|---|
| Quadrant D | 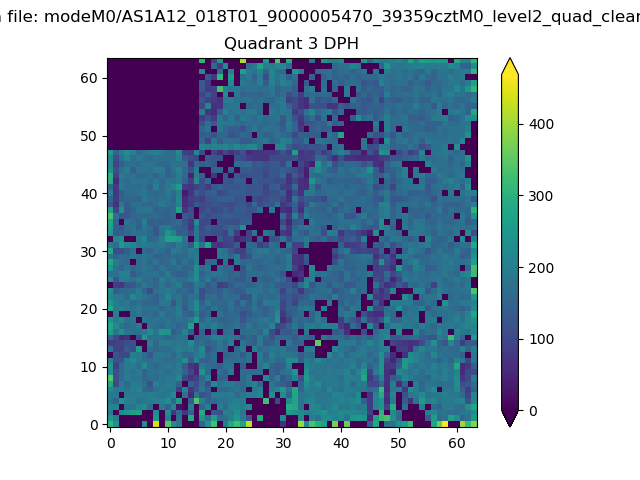 |
 |
Quadrant C |
| Plot type | Count rate plots | Images |
|---|---|---|
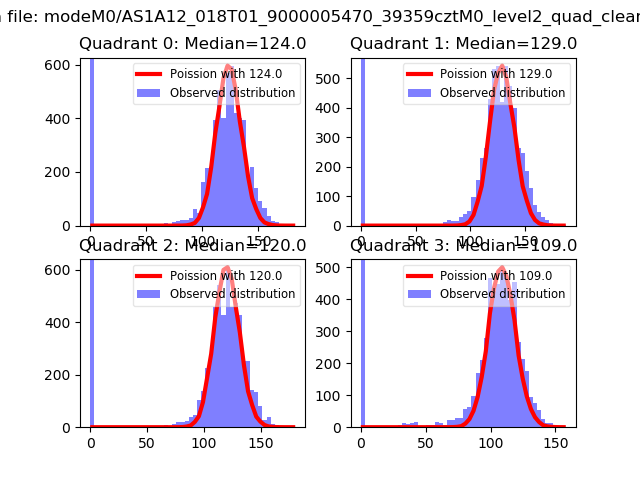
| Comparison with Poisson distribution Blue bars denote a histogram of data divided into 1 sec bins. Red curve is a Poisson curve with rate = median count rate of data. |
 |
 |
| Quadrant-wise count rates Data is divided into 100 sec bins |
 |
|
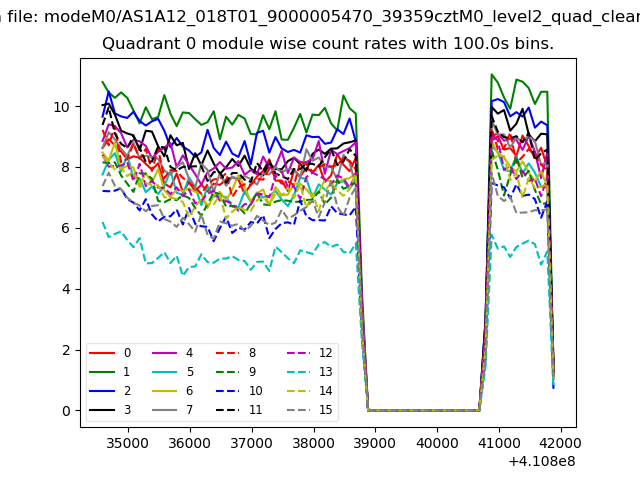
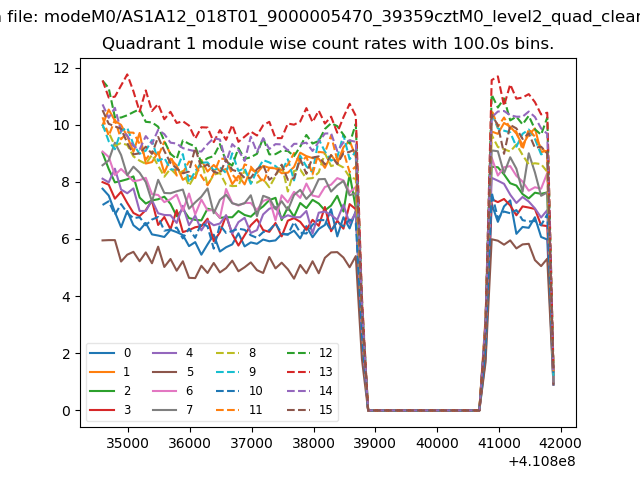
| Module-wise count rates for Quadrant A Data is divided into 100 sec bins |
 |
 |
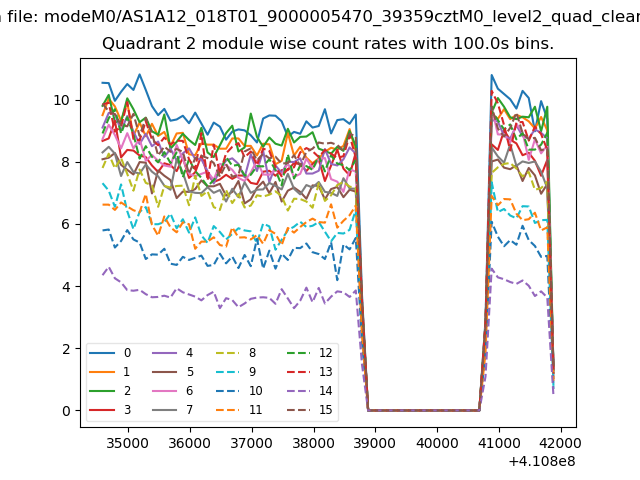
| Module-wise count rates for Quadrant B Data is divided into 100 sec bins |
 |
 |
| Module-wise count rates for Quadrant C Data is divided into 100 sec bins |
 |
 |
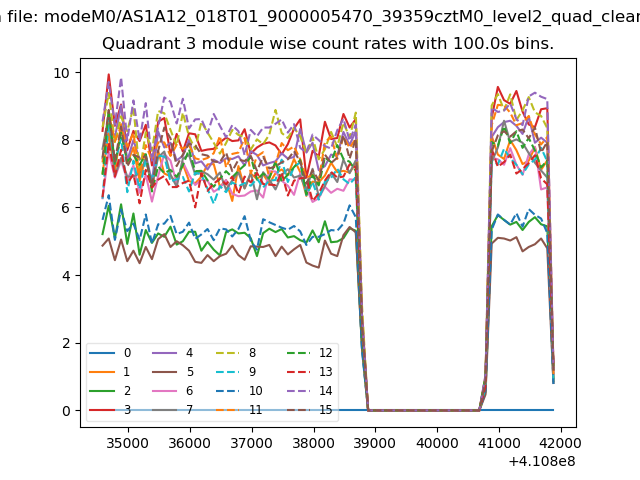
| Module-wise count rates for Quadrant D Data is divided into 100 sec bins |
 |
 |
| Parameter | Plot |
|---|---|
| CZT HV Monitor | 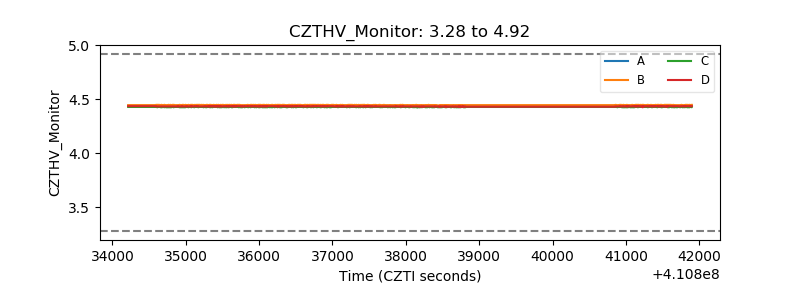 |
| D_VDD | 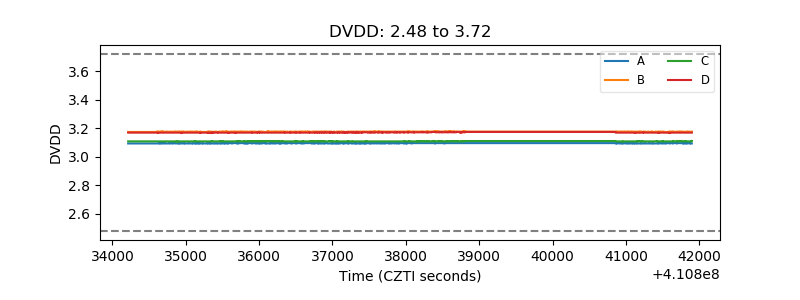 |
| Temperature 1 | 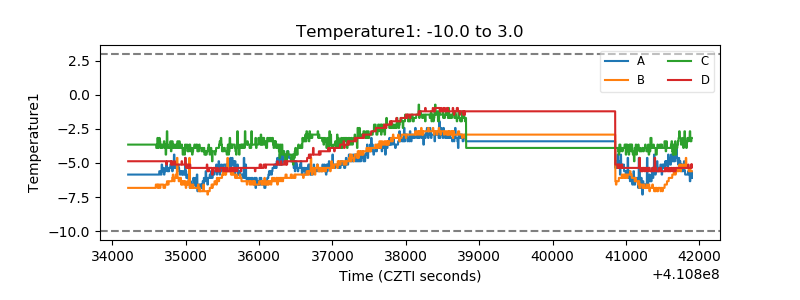 |
| Veto HV Monitor | 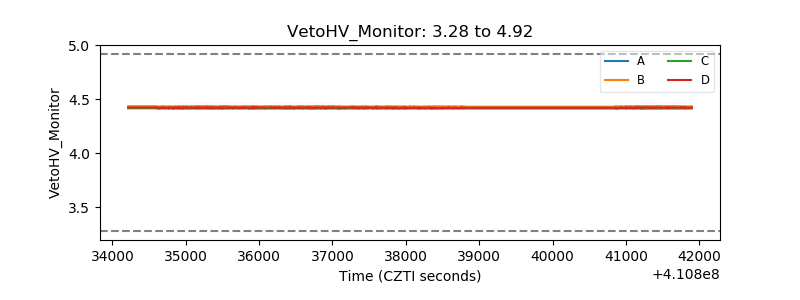 |
| Veto LLD | 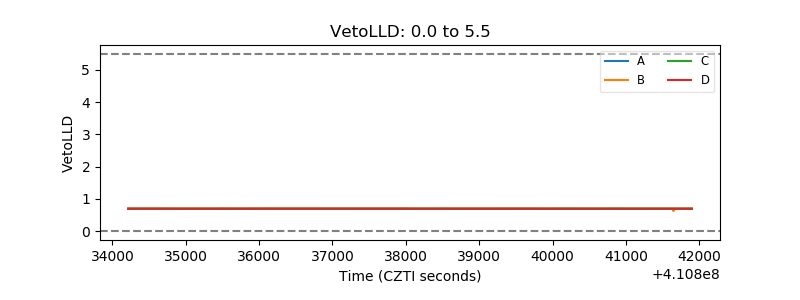 |
| Alpha Counter | 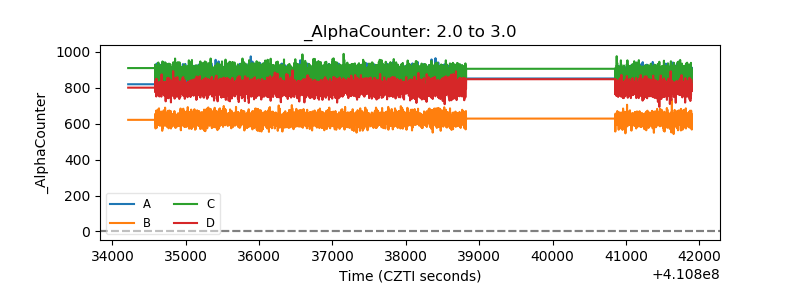 |
| _CPM_Rate | 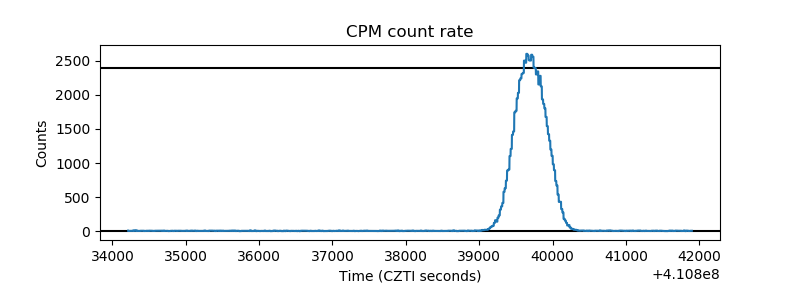 |
| CZT Counter | 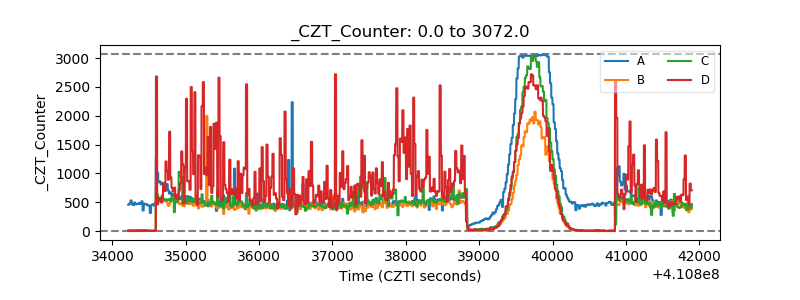 |
| +2.5 Volts monitor | 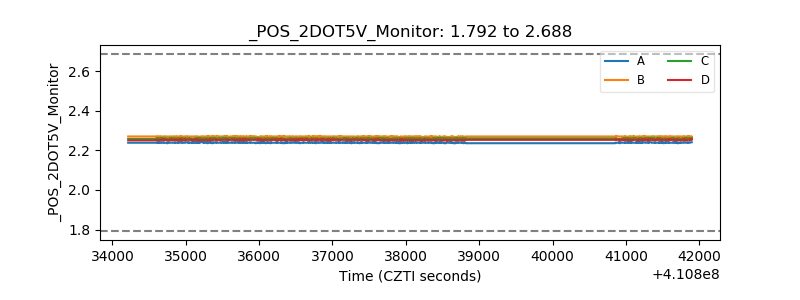 |
| +5 Volts monitor | 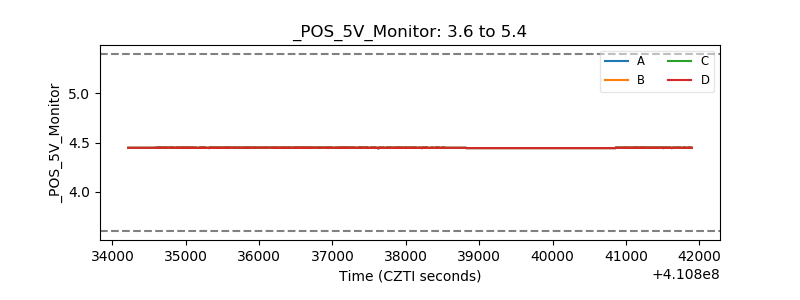 |
| _ROLL_ROT | 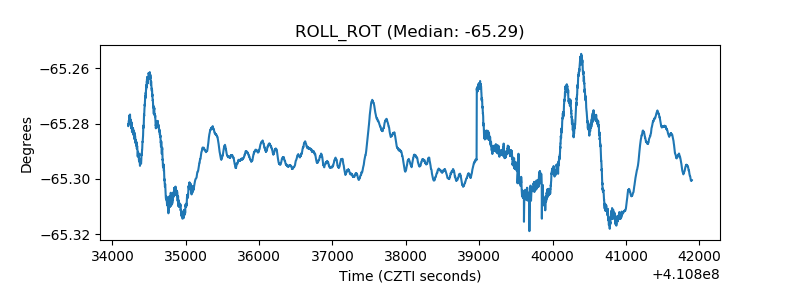 |
| _Roll_DEC | 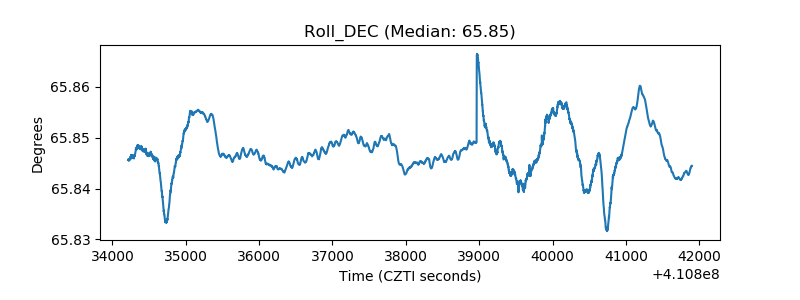 |
| _Roll_RA | 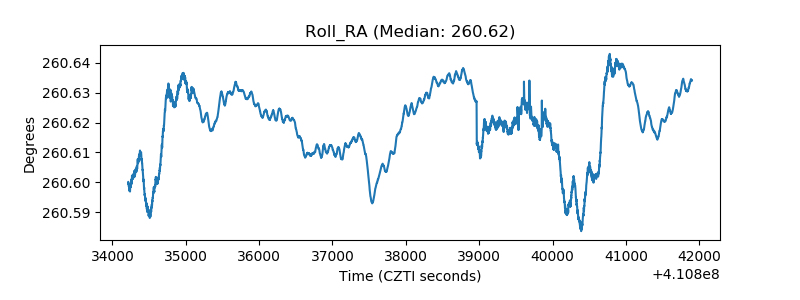 |
| Veto Counter | 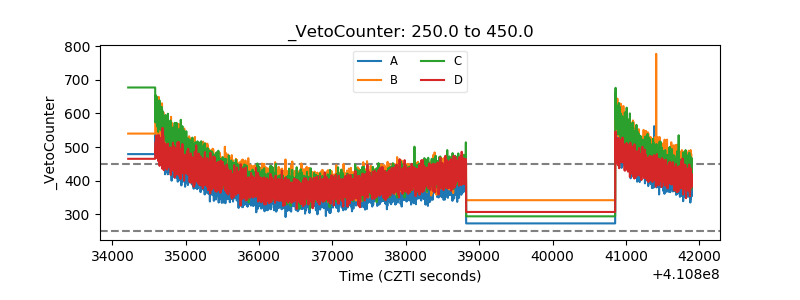 |