| Param | Original file | Final file |
|---|---|---|
| Filename | modeM0/AS1A12_018T01_9000005470_39362cztM0_level2.fits | modeM0/AS1A12_018T01_9000005470_39362cztM0_level2_quad_clean.evt |
| Size (bytes) | 874,656,000 | 148,610,880 |
| Size | 834.1 MB | 141.7 MB |
| Events in quadrant A | 5,111,498 | 1,095,657 |
| Events in quadrant B | 4,784,132 | 1,125,348 |
| Events in quadrant C | 4,692,063 | 1,045,578 |
| Events in quadrant D | 17,063,908 | 583,572 |
| Mode M9 | |||
|---|---|---|---|
| Quadrant | BADHDUFLAG | Total packets | Discarded packets |
| A | 0 | 41 | 0 |
| B | 0 | 41 | 0 |
| C | 0 | 41 | 0 |
| D | 0 | 41 | 0 |
| Mode SS | |||
|---|---|---|---|
| Quadrant | BADHDUFLAG | Total packets | Discarded packets |
| A | 0 | 192 | 0 |
| B | 0 | 192 | 0 |
| C | 0 | 192 | 0 |
| D | 0 | 192 | 0 |
| Mode M0 | |||
|---|---|---|---|
| Quadrant | BADHDUFLAG | Total packets | Discarded packets |
| A | 0 | 20819 | 4 |
| B | 0 | 20764 | 3 |
| C | 0 | 20004 | 3 |
| D | 0 | 57201 | 6 |
| Quadrant | Total seconds | Saturated seconds | Saturation percentage |
|---|---|---|---|
| A | 9364 | 45 | 0.480564% |
| B | 9364 | 115 | 1.228108% |
| C | 9364 | 17 | 0.181546% |
| D | 9363 | 4190 | 44.750614% |
Noise dominated data is calculated using 1-second bins in cleaned event files. If a bin has >2000 counts, and if more than 50% of those come from <1% of pixels, then it is considered to be noise-dominated and hence unusable.
| Quadrant | # 1 sec bins | Bins with >0 counts | Bins with >2000 counts | High rate bins dominated by noise | Noise dominated (total time) | Noise dominated (detector-on time) | Marked lightcurve |
|---|---|---|---|---|---|---|---|
| A | 13519 | 9366 | 27 | 27 | 0.20% | 0.29% | 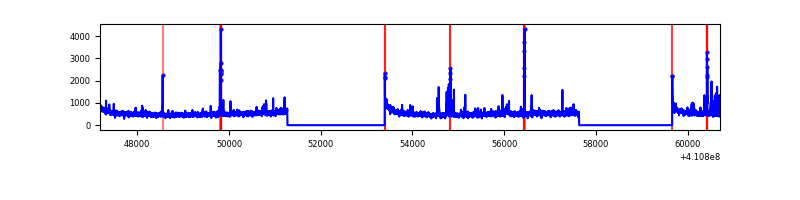 |
| B | 13519 | 9366 | 79 | 79 | 0.58% | 0.84% | 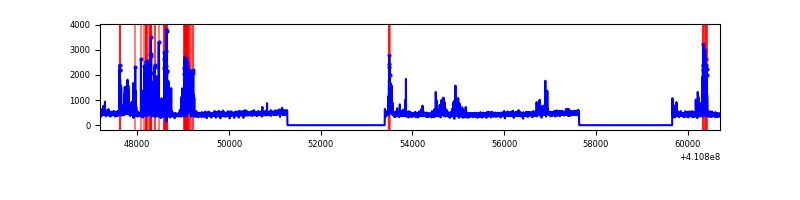 |
| C | 13519 | 9366 | 11 | 11 | 0.08% | 0.12% | 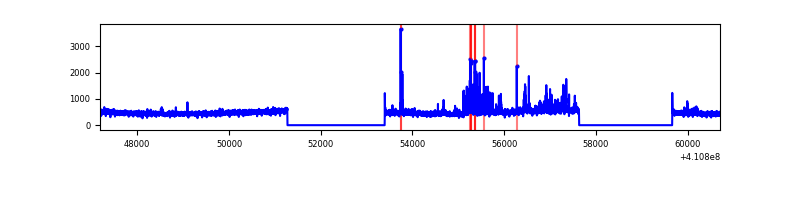 |
| D | 13519 | 9366 | 3843 | 3843 | 28.43% | 41.03% | 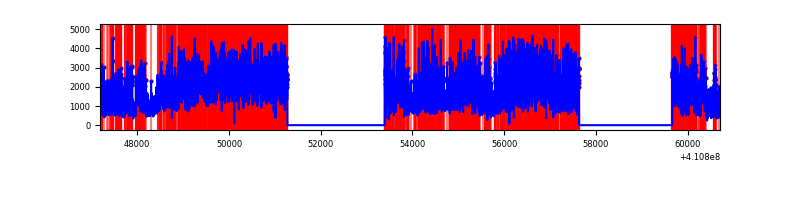 |
Top three noisy pixels from each quadrant. If the there are fewer than three noisy pixels in the level2.evt file, extra rows are filled as -1
| Pixel properties | Quadrant properties | ||||||
|---|---|---|---|---|---|---|---|
| Quadrant | DetID | PixID | Counts | Sigma | Mean | Median | Sigma |
| A | 10 | 83 | 683639 | 3293.35 | 1042 | 1023 | 207.3 |
| A | 15 | 223 | 171540 | 822.68 | 1042 | 1023 | 207.3 |
| A | 2 | 79 | 112442 | 537.55 | 1042 | 1023 | 207.3 |
| B | 4 | 170 | 489507 | 2484.19 | 1029 | 1001 | 196.6 |
| B | 5 | 255 | 251830 | 1275.53 | 1029 | 1001 | 196.6 |
| B | 12 | 111 | 24162 | 117.78 | 1029 | 1001 | 196.6 |
| C | 15 | 214 | 393564 | 1710.17 | 996 | 1001 | 229.5 |
| C | 9 | 187 | 361188 | 1569.13 | 996 | 1001 | 229.5 |
| C | 14 | 254 | 27090 | 113.65 | 996 | 1001 | 229.5 |
| D | 12 | 235 | 13115948 | 67268.17 | 807 | 782 | 195.0 |
| D | 13 | 249 | 206582 | 1055.56 | 807 | 782 | 195.0 |
| D | 12 | 227 | 193772 | 989.85 | 807 | 782 | 195.0 |
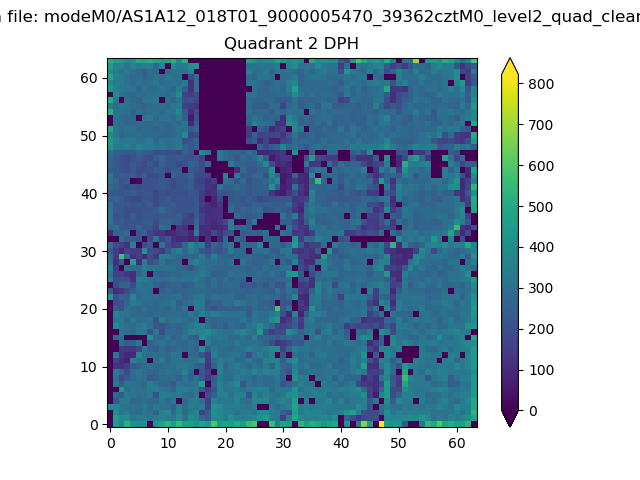
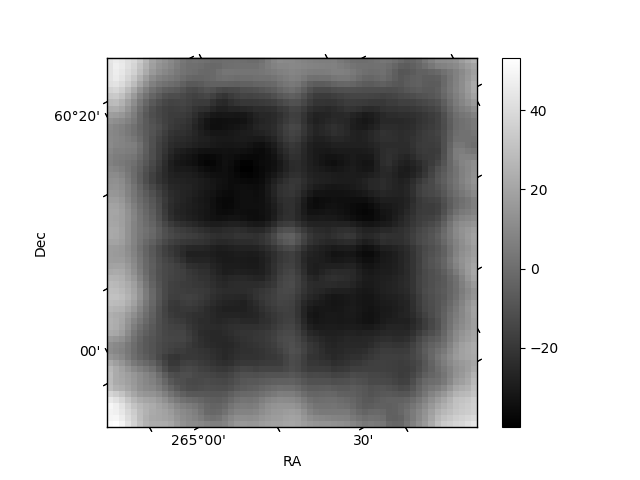
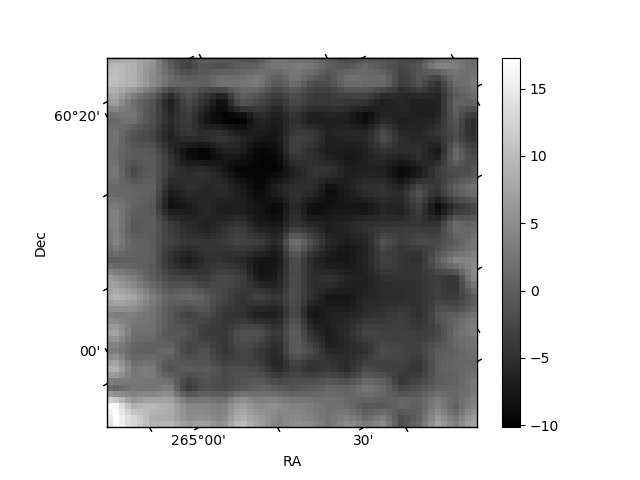
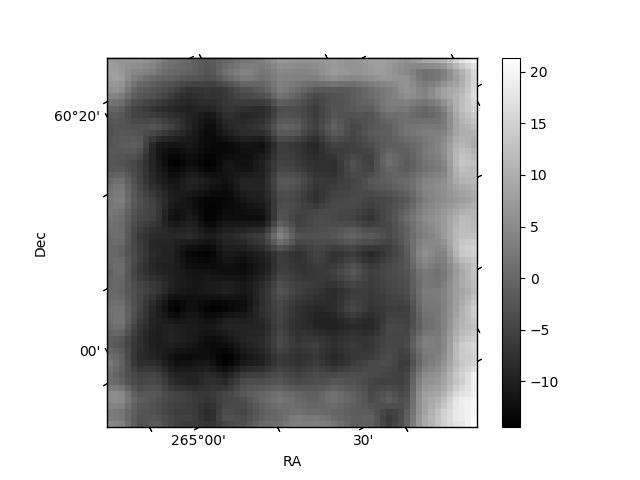
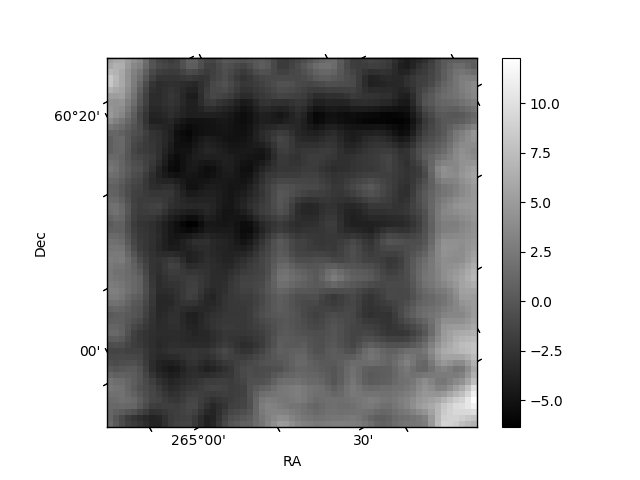
Histogram calculated using DETX and DETY for each event in the final _common_clean file
| Quadrant A | 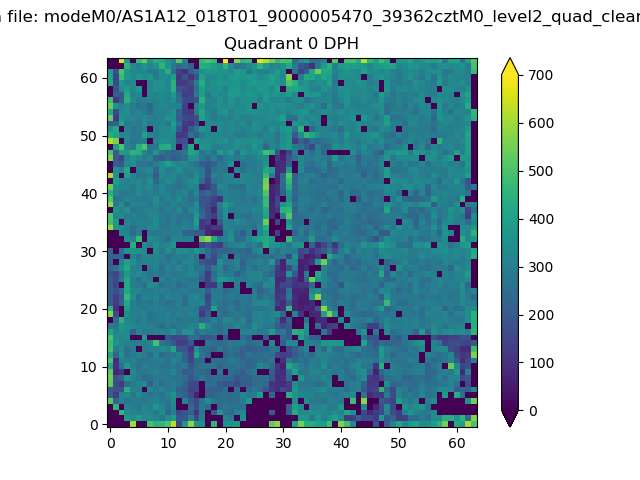 |
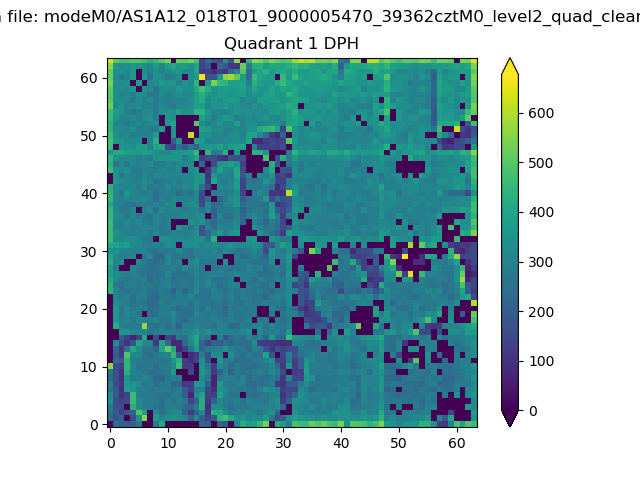 |
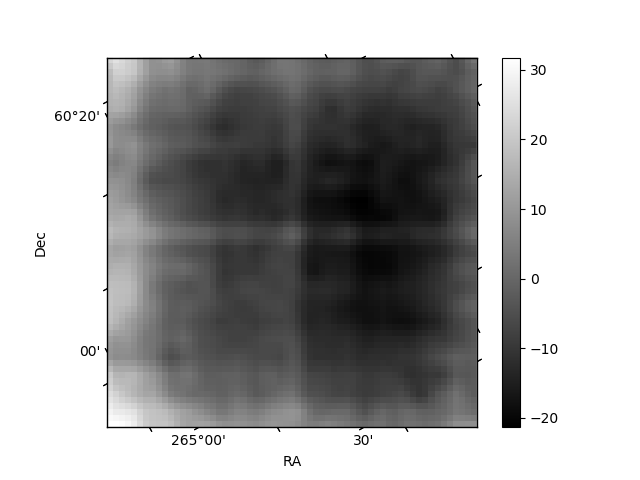
Quadrant B |
|---|---|---|---|
| Quadrant D | 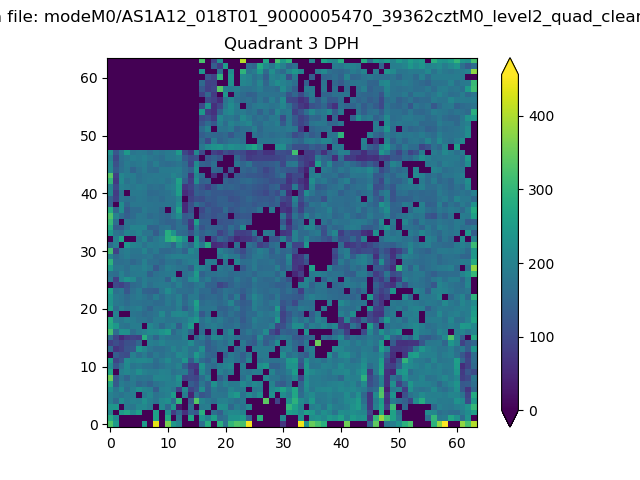 |
 |
Quadrant C |
| Plot type | Count rate plots | Images |
|---|---|---|
| Comparison with Poisson distribution Blue bars denote a histogram of data divided into 1 sec bins. Red curve is a Poisson curve with rate = median count rate of data. |
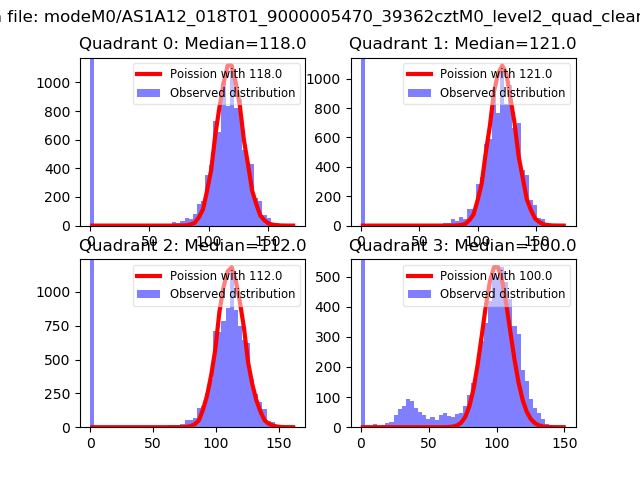 |
 |
| Quadrant-wise count rates Data is divided into 100 sec bins |
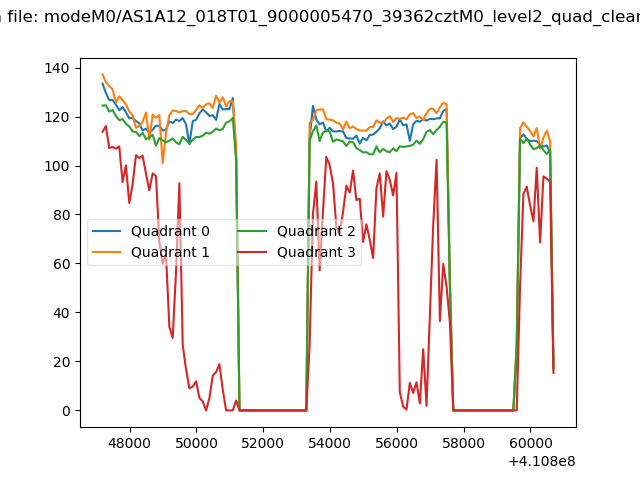 |
|
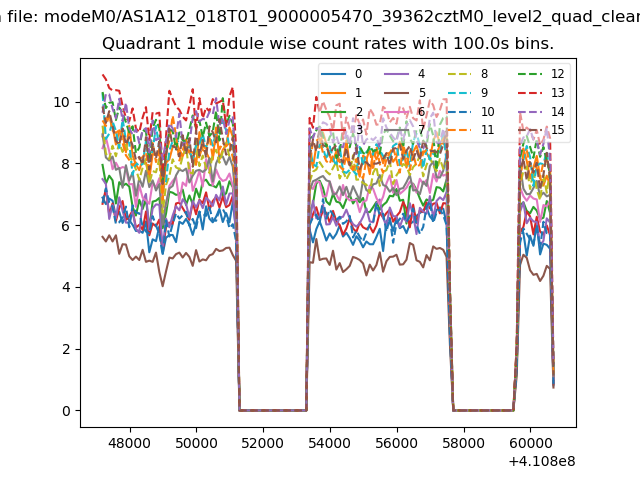
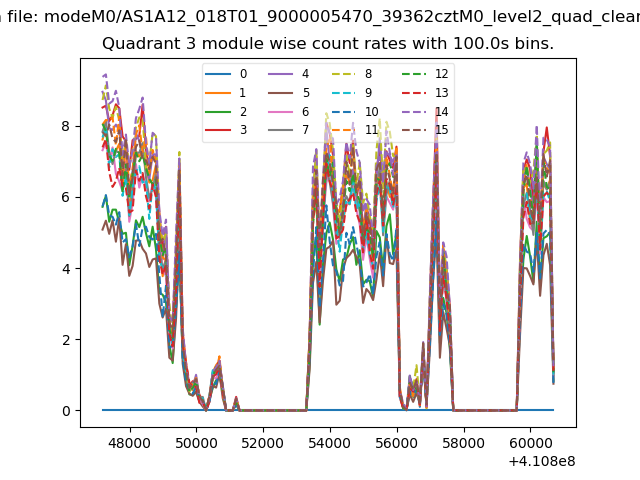
| Module-wise count rates for Quadrant A Data is divided into 100 sec bins |
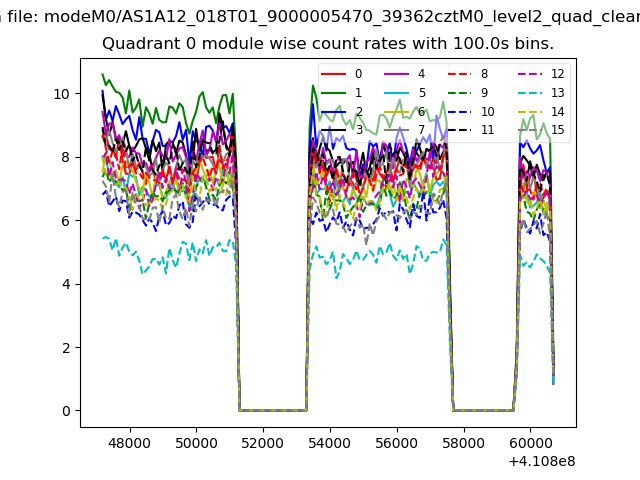 |
 |
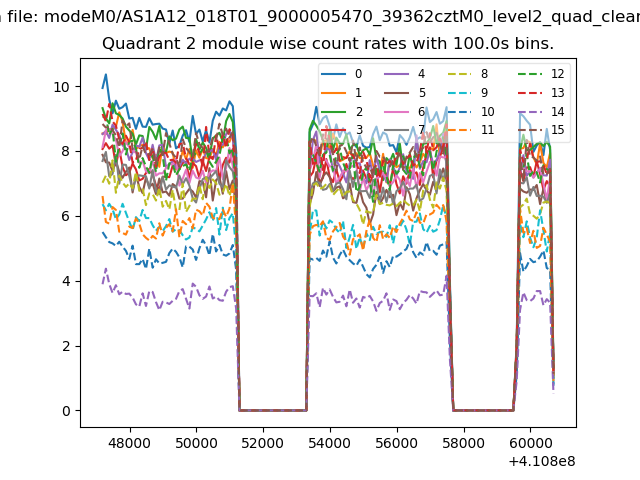
| Module-wise count rates for Quadrant B Data is divided into 100 sec bins |
 |
 |
| Module-wise count rates for Quadrant C Data is divided into 100 sec bins |
 |
 |
| Module-wise count rates for Quadrant D Data is divided into 100 sec bins |
 |
 |
| Parameter | Plot |
|---|---|
| CZT HV Monitor | 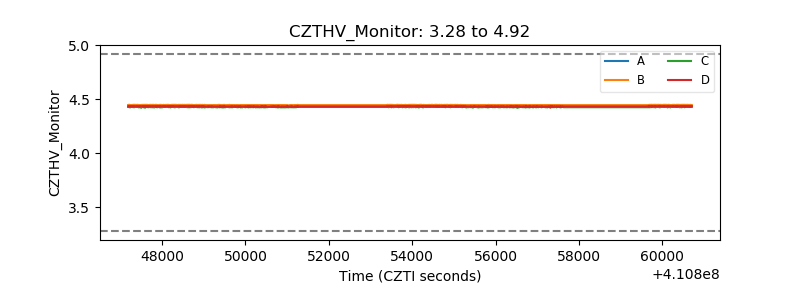 |
| D_VDD | 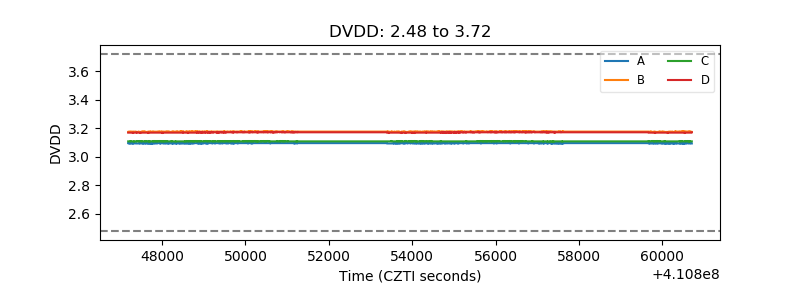 |
| Temperature 1 | 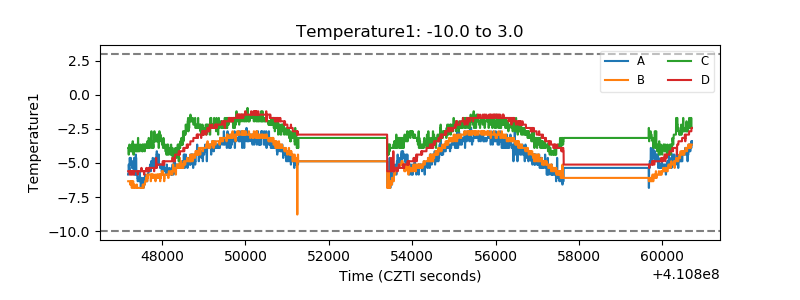 |
| Veto HV Monitor |  |
| Veto LLD | 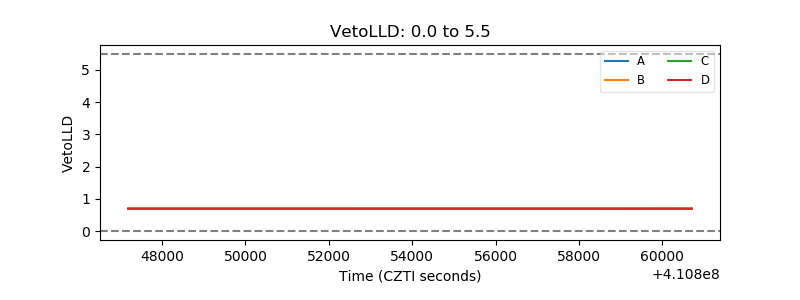 |
| Alpha Counter | 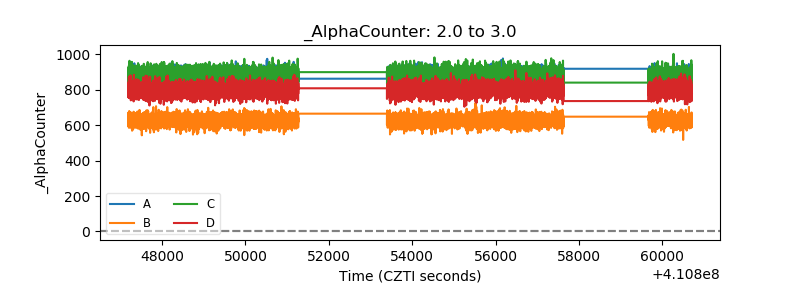 |
| _CPM_Rate | 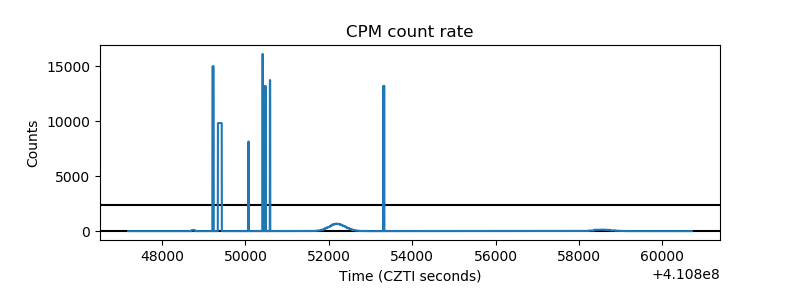 |
| CZT Counter | 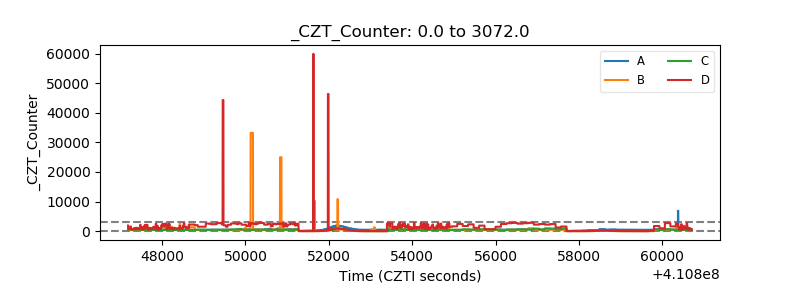 |
| +2.5 Volts monitor | 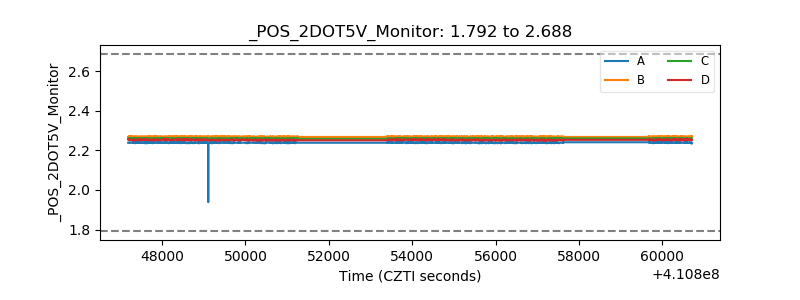 |
| +5 Volts monitor | 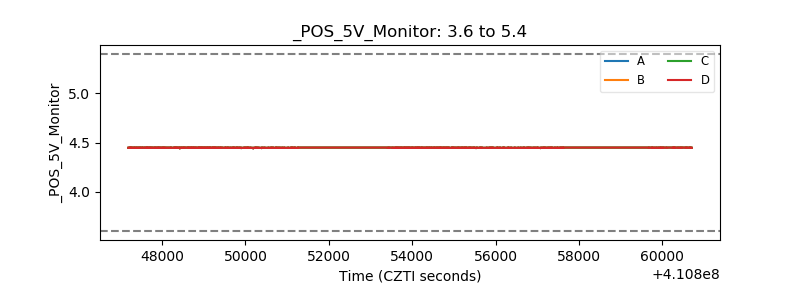 |
| _ROLL_ROT | 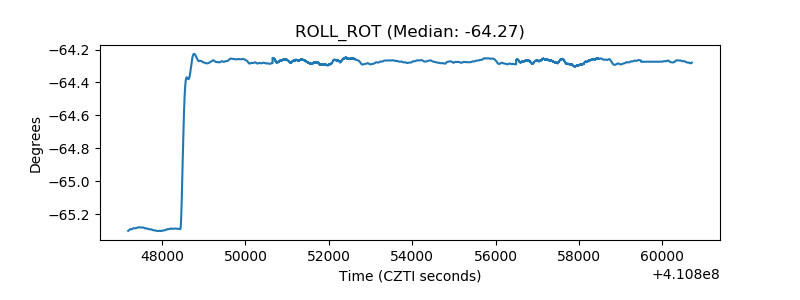 |
| _Roll_DEC | 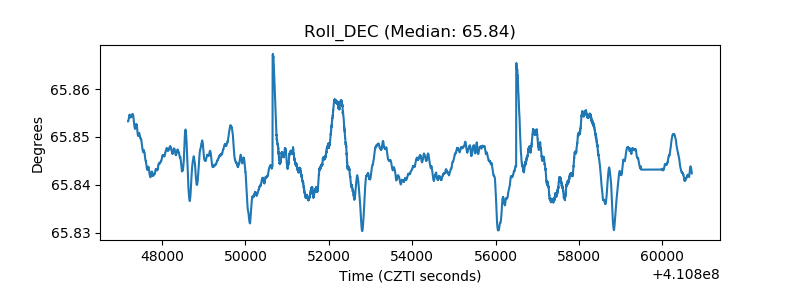 |
| _Roll_RA | 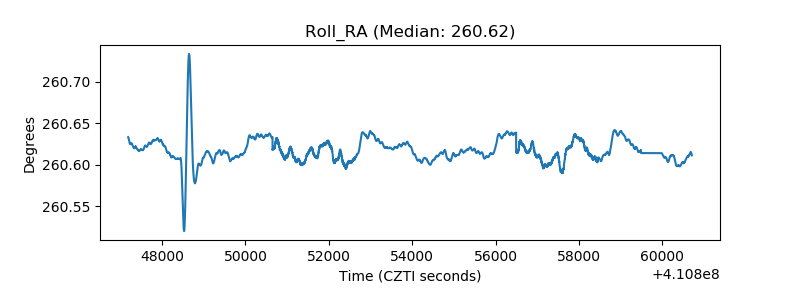 |
| Veto Counter | 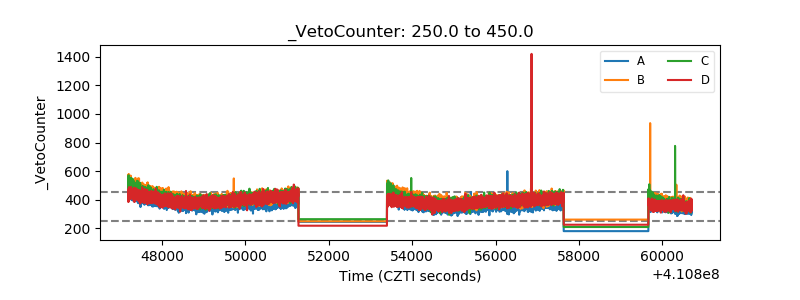 |