| Param | Original file | Final file |
|---|---|---|
| Filename | modeM0/AS1A12_018T01_9000005470_39363cztM0_level2.fits | modeM0/AS1A12_018T01_9000005470_39363cztM0_level2_quad_clean.evt |
| Size (bytes) | 802,961,280 | 149,872,320 |
| Size | 765.8 MB | 142.9 MB |
| Events in quadrant A | 5,075,990 | 1,068,052 |
| Events in quadrant B | 4,247,538 | 1,099,540 |
| Events in quadrant C | 4,766,242 | 1,022,293 |
| Events in quadrant D | 14,905,981 | 696,974 |
| Mode M9 | |||
|---|---|---|---|
| Quadrant | BADHDUFLAG | Total packets | Discarded packets |
| A | 0 | 38 | 0 |
| B | 0 | 38 | 0 |
| C | 0 | 38 | 0 |
| D | 0 | 38 | 0 |
| Mode SS | |||
|---|---|---|---|
| Quadrant | BADHDUFLAG | Total packets | Discarded packets |
| A | 0 | 190 | 0 |
| B | 0 | 190 | 0 |
| C | 0 | 190 | 0 |
| D | 0 | 190 | 0 |
| Mode M0 | |||
|---|---|---|---|
| Quadrant | BADHDUFLAG | Total packets | Discarded packets |
| A | 0 | 20595 | 3 |
| B | 0 | 19390 | 2 |
| C | 0 | 20307 | 2 |
| D | 0 | 50801 | 2 |
| Quadrant | Total seconds | Saturated seconds | Saturation percentage |
|---|---|---|---|
| A | 9392 | 68 | 0.724020% |
| B | 9392 | 26 | 0.276831% |
| C | 9392 | 14 | 0.149063% |
| D | 9392 | 2922 | 31.111584% |
Noise dominated data is calculated using 1-second bins in cleaned event files. If a bin has >2000 counts, and if more than 50% of those come from <1% of pixels, then it is considered to be noise-dominated and hence unusable.
| Quadrant | # 1 sec bins | Bins with >0 counts | Bins with >2000 counts | High rate bins dominated by noise | Noise dominated (total time) | Noise dominated (detector-on time) | Marked lightcurve |
|---|---|---|---|---|---|---|---|
| A | 13157 | 9394 | 46 | 46 | 0.35% | 0.49% | 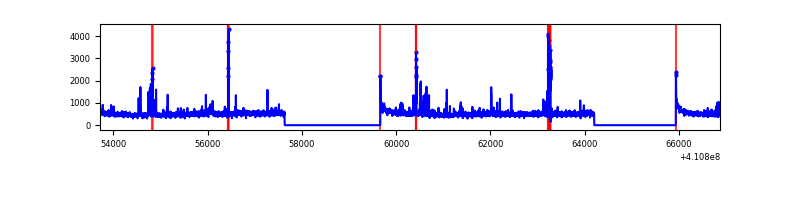 |
| B | 13157 | 9394 | 13 | 13 | 0.10% | 0.14% | 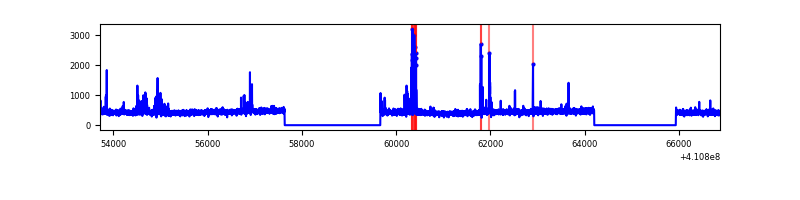 |
| C | 13157 | 9394 | 11 | 11 | 0.08% | 0.12% | 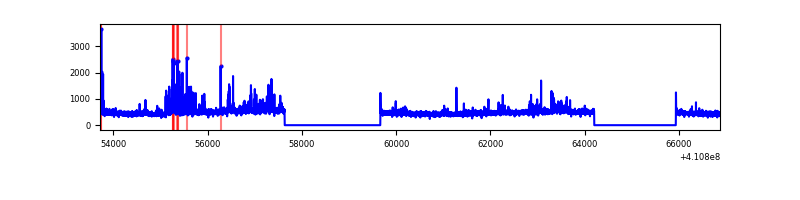 |
| D | 13157 | 9394 | 2720 | 2720 | 20.67% | 28.95% | 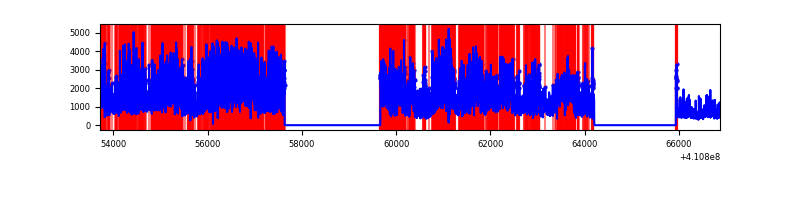 |
Top three noisy pixels from each quadrant. If the there are fewer than three noisy pixels in the level2.evt file, extra rows are filled as -1
| Pixel properties | Quadrant properties | ||||||
|---|---|---|---|---|---|---|---|
| Quadrant | DetID | PixID | Counts | Sigma | Mean | Median | Sigma |
| A | 10 | 83 | 650736 | 3152.4 | 1027 | 1007 | 206.1 |
| A | 15 | 223 | 234985 | 1135.23 | 1027 | 1007 | 206.1 |
| A | 2 | 79 | 124169 | 597.57 | 1027 | 1007 | 206.1 |
| B | 4 | 170 | 190053 | 963.28 | 1020 | 989 | 196.3 |
| B | 15 | 85 | 41418 | 205.99 | 1020 | 989 | 196.3 |
| B | 12 | 111 | 24295 | 118.74 | 1020 | 989 | 196.3 |
| C | 9 | 187 | 429587 | 1872.97 | 992 | 996 | 228.8 |
| C | 15 | 214 | 392163 | 1709.42 | 992 | 996 | 228.8 |
| C | 14 | 254 | 37275 | 158.54 | 992 | 996 | 228.8 |
| D | 12 | 235 | 10419565 | 49585.94 | 867 | 841 | 210.1 |
| D | 12 | 227 | 482226 | 2291.06 | 867 | 841 | 210.1 |
| D | 13 | 249 | 394646 | 1874.24 | 867 | 841 | 210.1 |
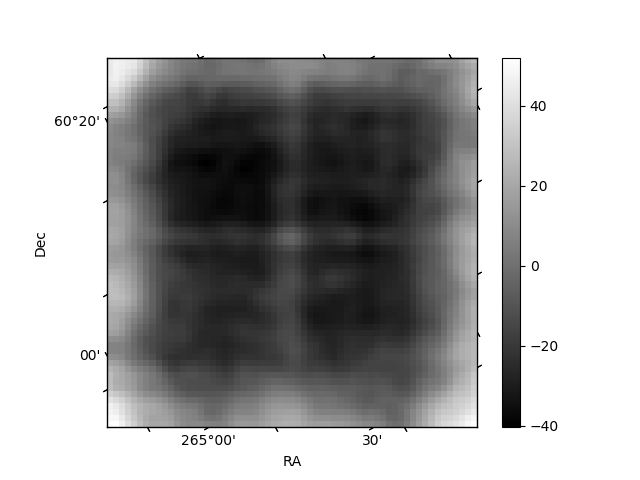
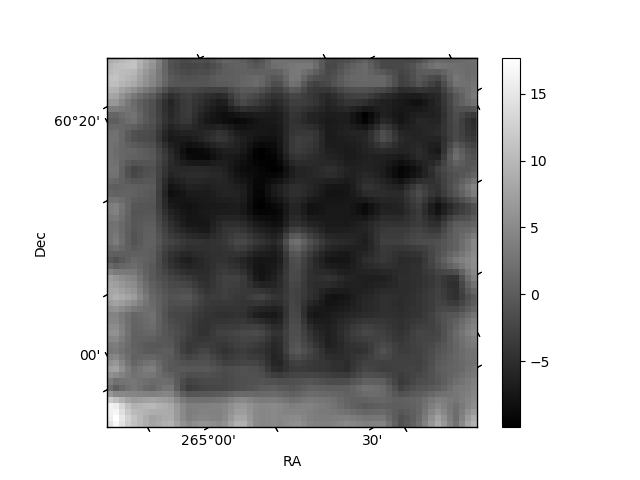
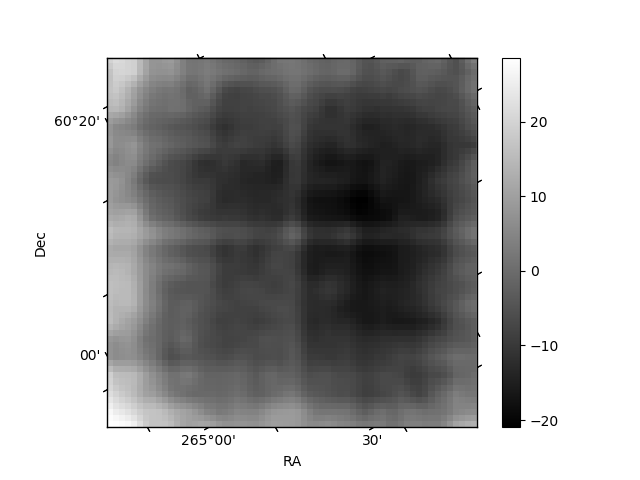
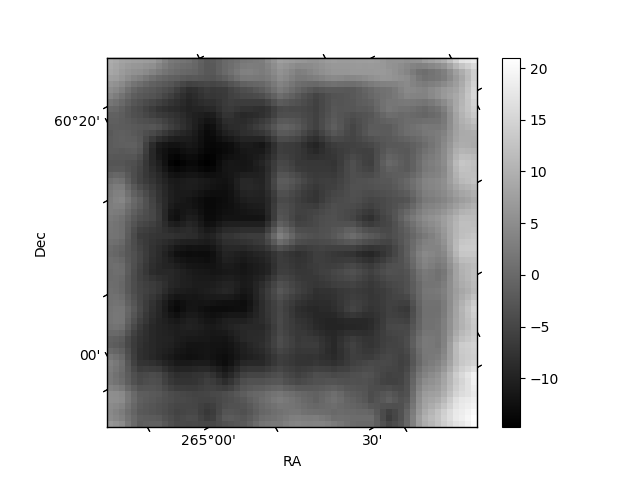
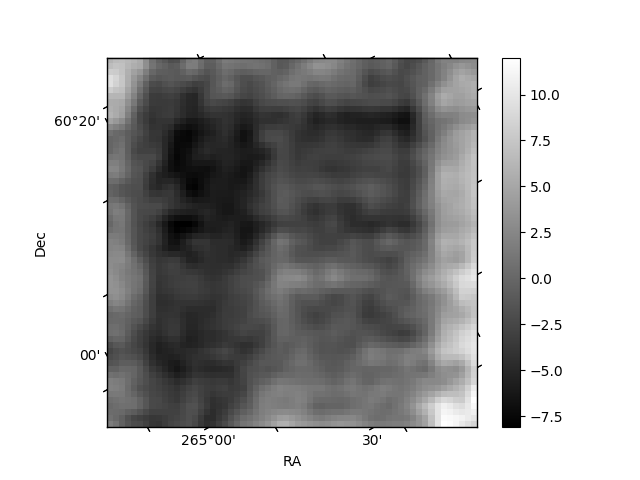
Histogram calculated using DETX and DETY for each event in the final _common_clean file
| Quadrant A | 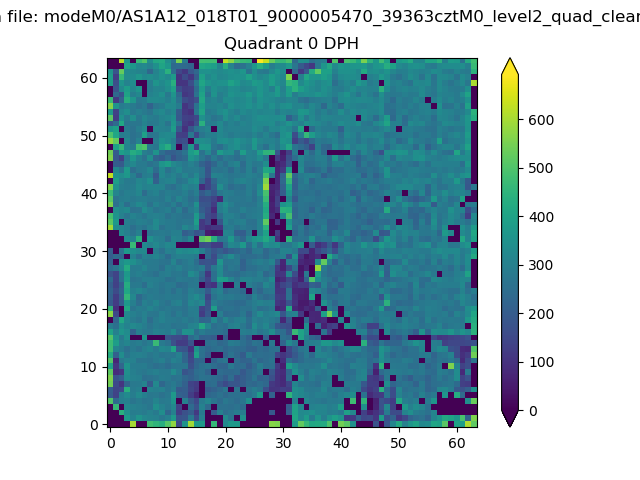 |
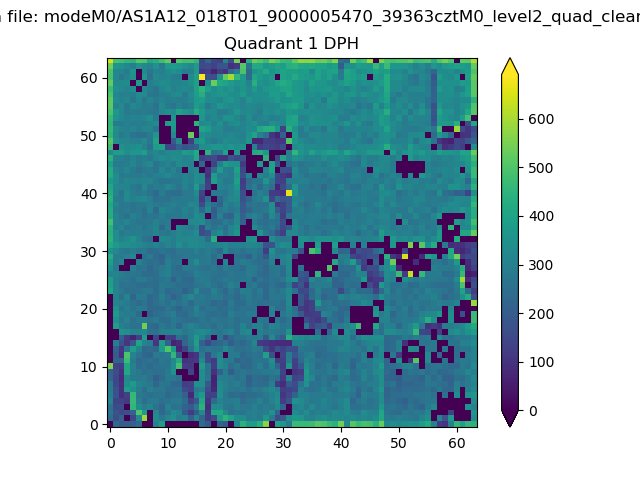 |
Quadrant B |
|---|---|---|---|
| Quadrant D | 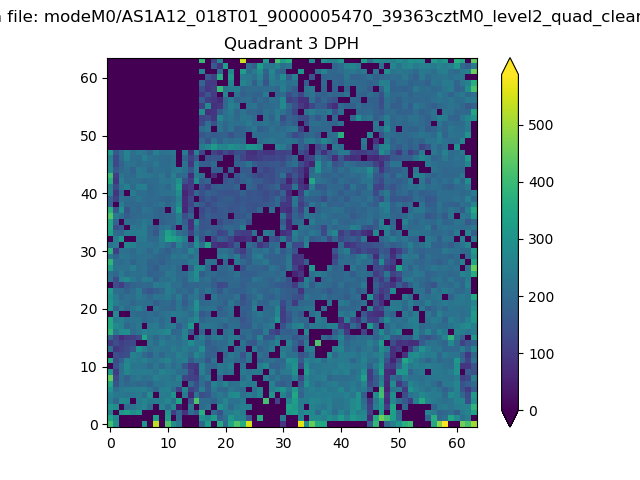 |
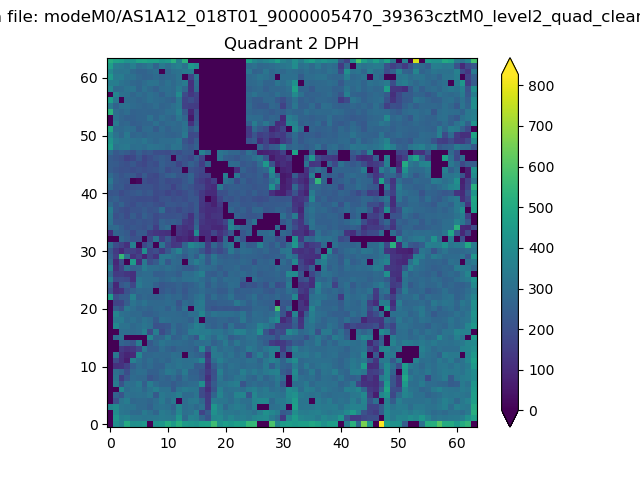 |
Quadrant C |
| Plot type | Count rate plots | Images |
|---|---|---|
| Comparison with Poisson distribution Blue bars denote a histogram of data divided into 1 sec bins. Red curve is a Poisson curve with rate = median count rate of data. |
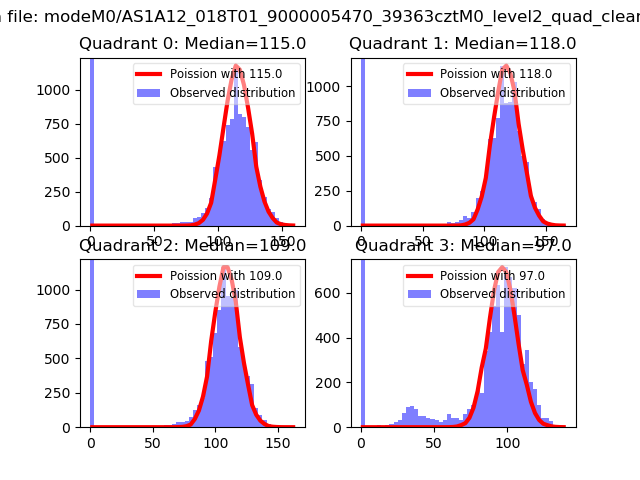 |
 |
| Quadrant-wise count rates Data is divided into 100 sec bins |
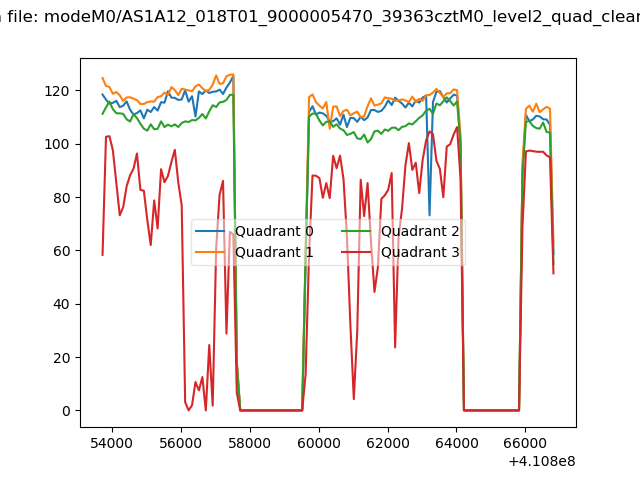 |
|
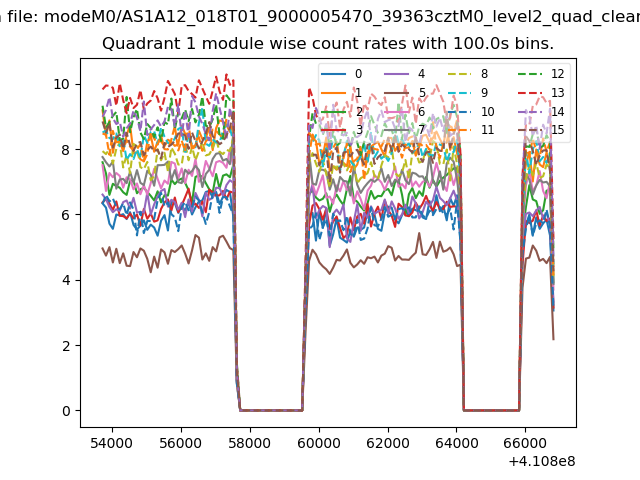
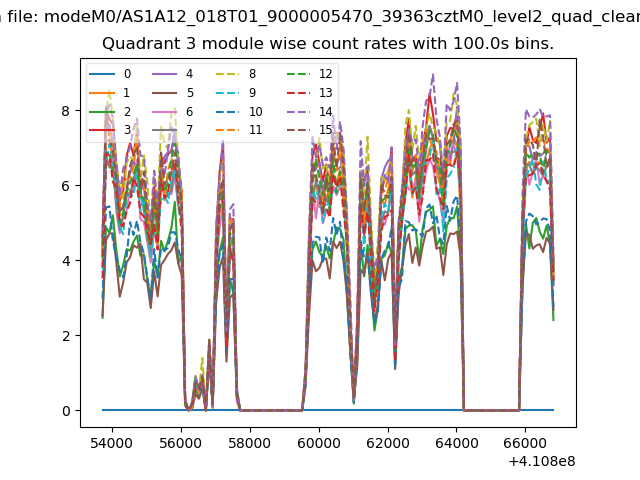
| Module-wise count rates for Quadrant A Data is divided into 100 sec bins |
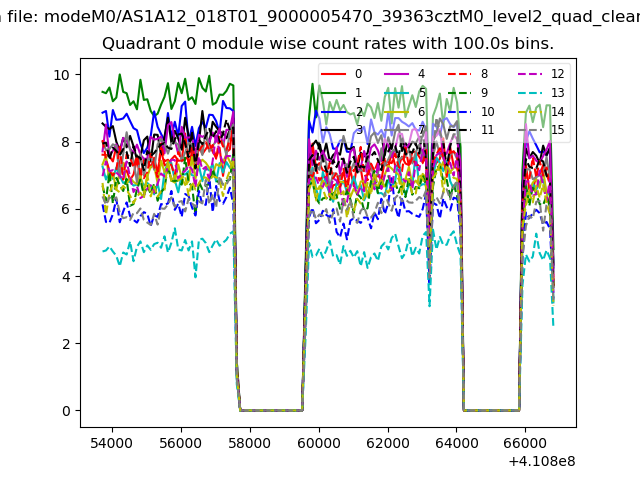 |
 |
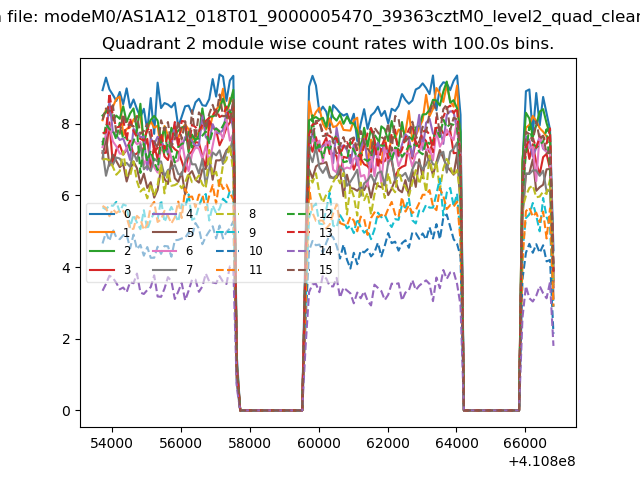
| Module-wise count rates for Quadrant B Data is divided into 100 sec bins |
 |
 |
| Module-wise count rates for Quadrant C Data is divided into 100 sec bins |
 |
 |
| Module-wise count rates for Quadrant D Data is divided into 100 sec bins |
 |
 |
| Parameter | Plot |
|---|---|
| CZT HV Monitor | 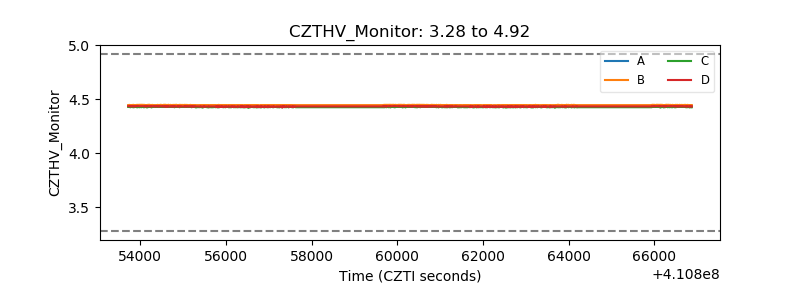 |
| D_VDD | 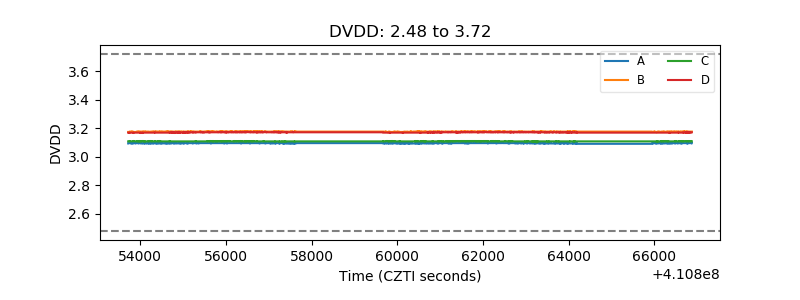 |
| Temperature 1 | 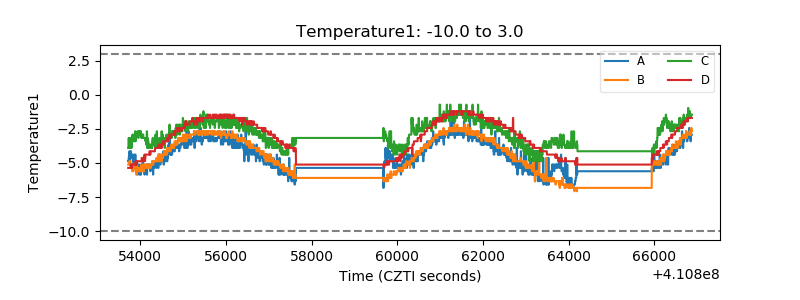 |
| Veto HV Monitor | 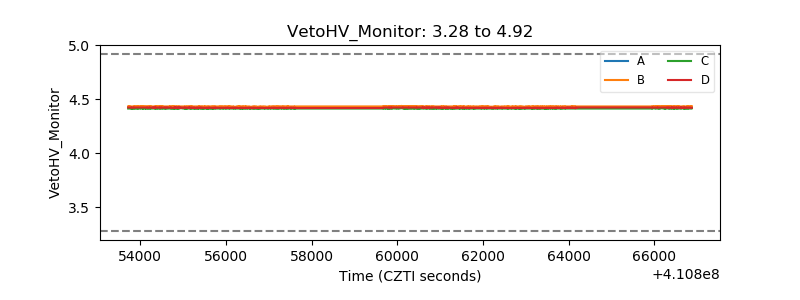 |
| Veto LLD | 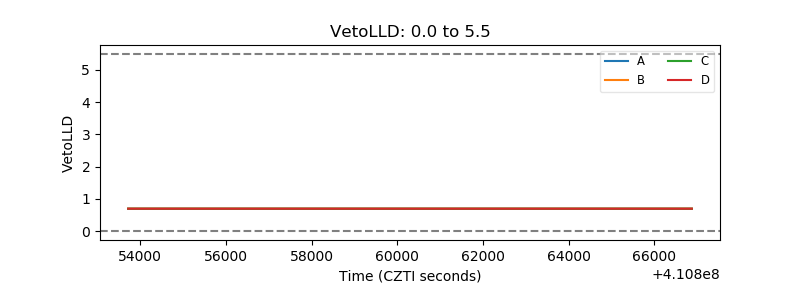 |
| Alpha Counter |  |
| _CPM_Rate | 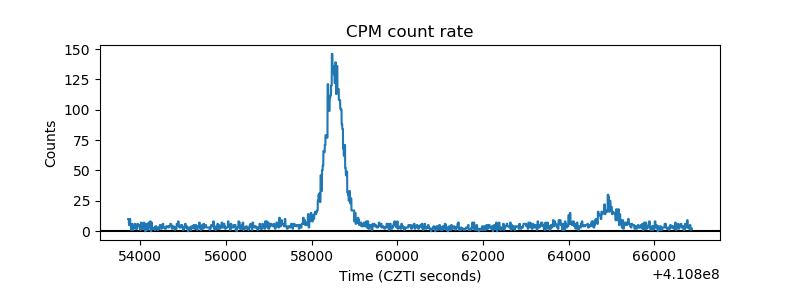 |
| CZT Counter | 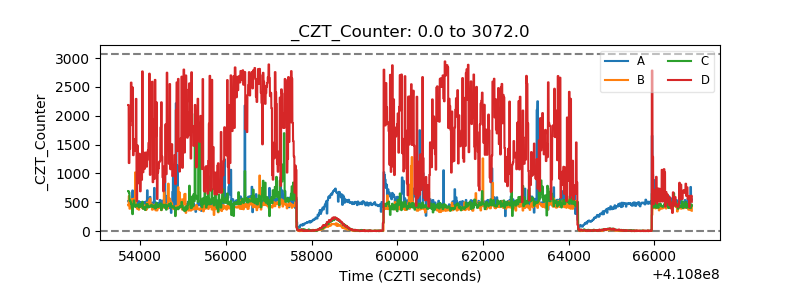 |
| +2.5 Volts monitor | 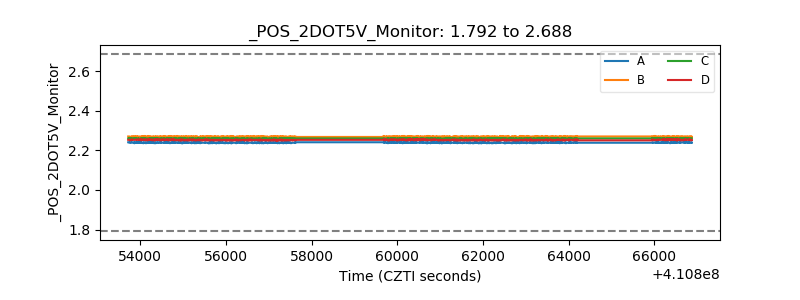 |
| +5 Volts monitor | 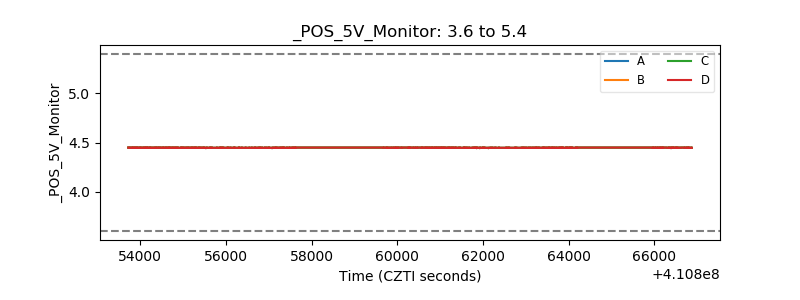 |
| _ROLL_ROT | 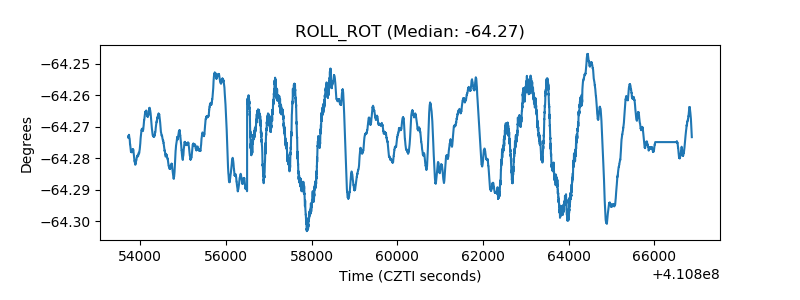 |
| _Roll_DEC | 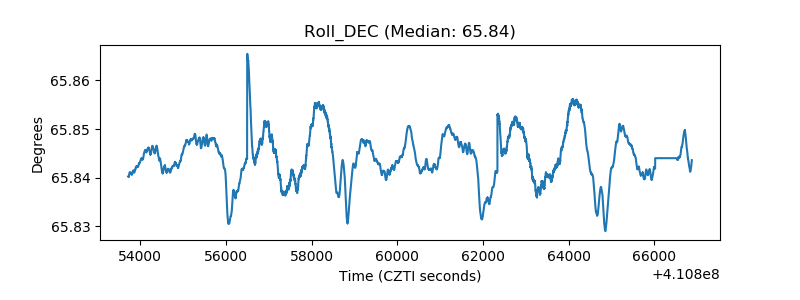 |
| _Roll_RA | 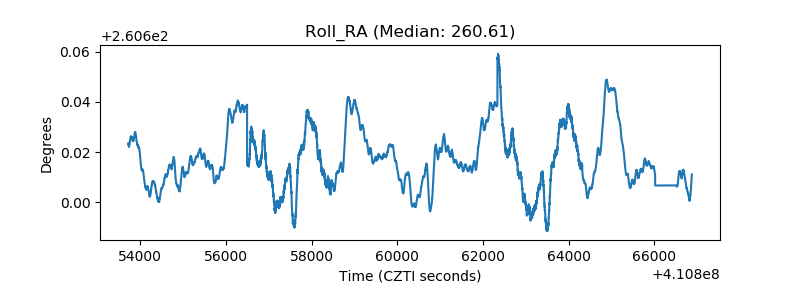 |
| Veto Counter | 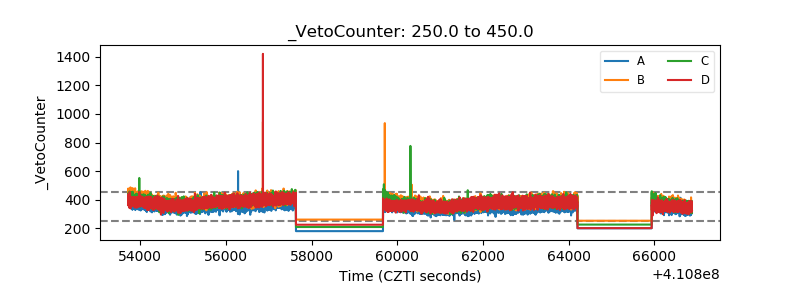 |