| Param | Original file | Final file |
|---|---|---|
| Filename | modeM0/AS1A12_018T01_9000005470_39364cztM0_level2.fits | modeM0/AS1A12_018T01_9000005470_39364cztM0_level2_quad_clean.evt |
| Size (bytes) | 436,487,040 | 91,356,480 |
| Size | 416.3 MB | 87.1 MB |
| Events in quadrant A | 2,946,986 | 633,000 |
| Events in quadrant B | 2,484,343 | 643,417 |
| Events in quadrant C | 2,744,387 | 603,035 |
| Events in quadrant D | 7,541,004 | 489,994 |
| Mode M9 | |||
|---|---|---|---|
| Quadrant | BADHDUFLAG | Total packets | Discarded packets |
| A | 0 | 16 | 0 |
| B | 0 | 16 | 0 |
| C | 0 | 16 | 0 |
| D | 0 | 17 | 0 |
| Mode SS | |||
|---|---|---|---|
| Quadrant | BADHDUFLAG | Total packets | Discarded packets |
| A | 0 | 116 | 0 |
| B | 0 | 116 | 0 |
| C | 0 | 116 | 0 |
| D | 0 | 116 | 0 |
| Mode M0 | |||
|---|---|---|---|
| Quadrant | BADHDUFLAG | Total packets | Discarded packets |
| A | 0 | 12076 | 3 |
| B | 0 | 11495 | 2 |
| C | 0 | 11770 | 2 |
| D | 0 | 26352 | 2 |
| Quadrant | Total seconds | Saturated seconds | Saturation percentage |
|---|---|---|---|
| A | 5670 | 10 | 0.176367% |
| B | 5670 | 20 | 0.352734% |
| C | 5670 | 8 | 0.141093% |
| D | 5670 | 1039 | 18.324515% |
Noise dominated data is calculated using 1-second bins in cleaned event files. If a bin has >2000 counts, and if more than 50% of those come from <1% of pixels, then it is considered to be noise-dominated and hence unusable.
| Quadrant | # 1 sec bins | Bins with >0 counts | Bins with >2000 counts | High rate bins dominated by noise | Noise dominated (total time) | Noise dominated (detector-on time) | Marked lightcurve |
|---|---|---|---|---|---|---|---|
| A | 7104 | 5671 | 5 | 5 | 0.07% | 0.09% | 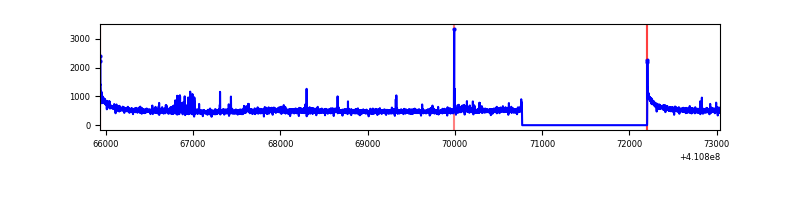 |
| B | 7104 | 5671 | 7 | 7 | 0.10% | 0.12% | 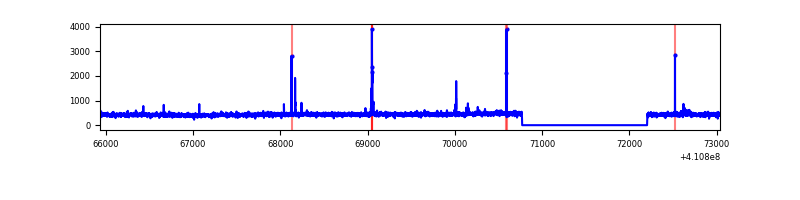 |
| C | 7104 | 5671 | 4 | 4 | 0.06% | 0.07% |  |
| D | 7104 | 5671 | 955 | 955 | 13.44% | 16.84% | 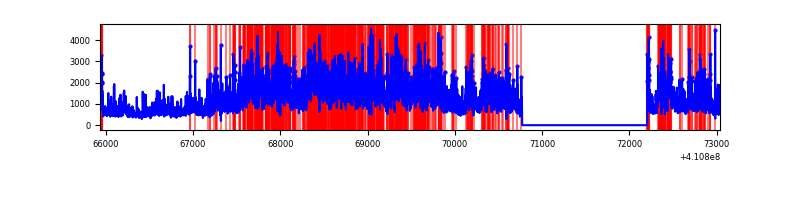 |
Top three noisy pixels from each quadrant. If the there are fewer than three noisy pixels in the level2.evt file, extra rows are filled as -1
| Pixel properties | Quadrant properties | ||||||
|---|---|---|---|---|---|---|---|
| Quadrant | DetID | PixID | Counts | Sigma | Mean | Median | Sigma |
| A | 10 | 83 | 457397 | 3611.26 | 620 | 605 | 126.5 |
| A | 2 | 79 | 58204 | 455.36 | 620 | 605 | 126.5 |
| A | 13 | 248 | 16561 | 126.14 | 620 | 605 | 126.5 |
| B | 5 | 172 | 27019 | 222.57 | 613 | 596 | 118.7 |
| B | 4 | 170 | 18797 | 153.31 | 613 | 596 | 118.7 |
| B | 12 | 111 | 14962 | 121.01 | 613 | 596 | 118.7 |
| C | 15 | 214 | 240640 | 1711.63 | 599 | 603 | 140.2 |
| C | 9 | 187 | 79376 | 561.71 | 599 | 603 | 140.2 |
| C | 14 | 254 | 36329 | 254.75 | 599 | 603 | 140.2 |
| D | 12 | 235 | 4061184 | 29251.85 | 567 | 550 | 138.8 |
| D | 12 | 227 | 366162 | 2633.78 | 567 | 550 | 138.8 |
| D | 6 | 239 | 319455 | 2297.32 | 567 | 550 | 138.8 |
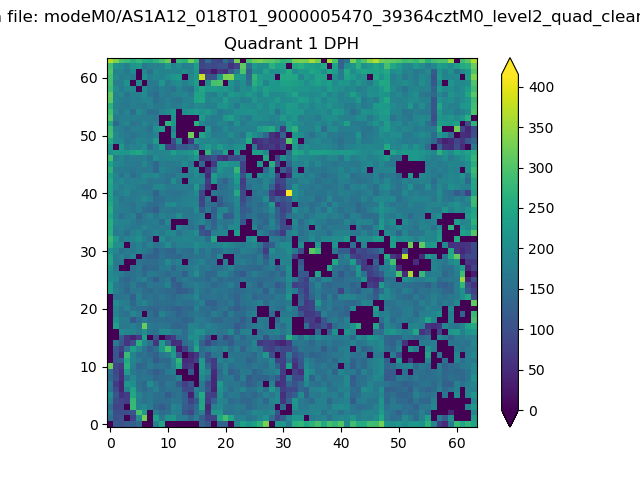
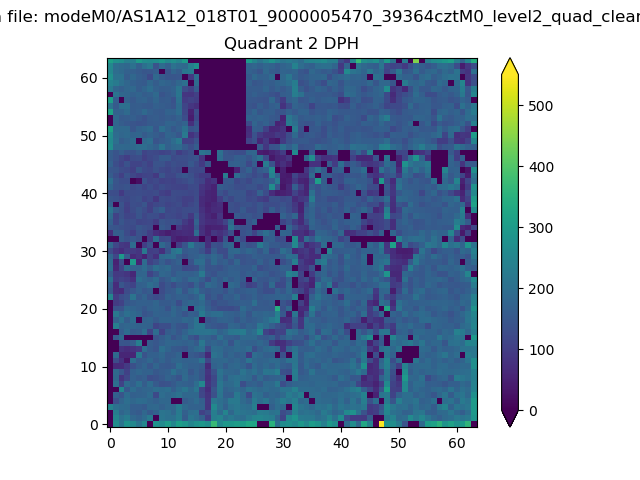
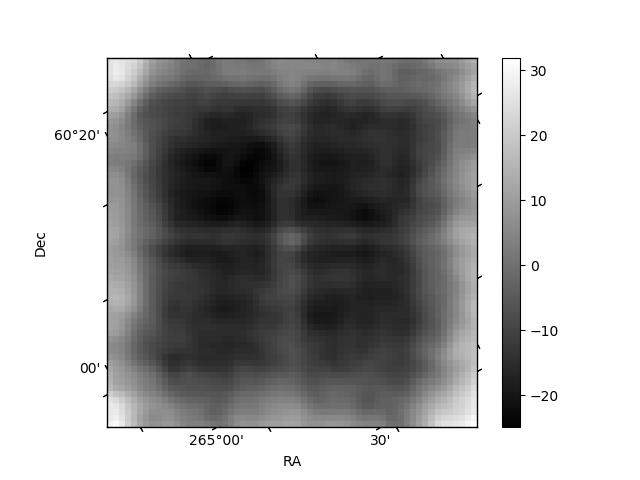
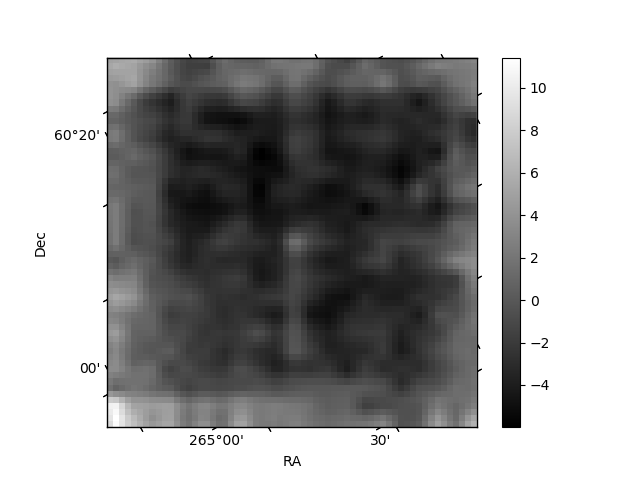
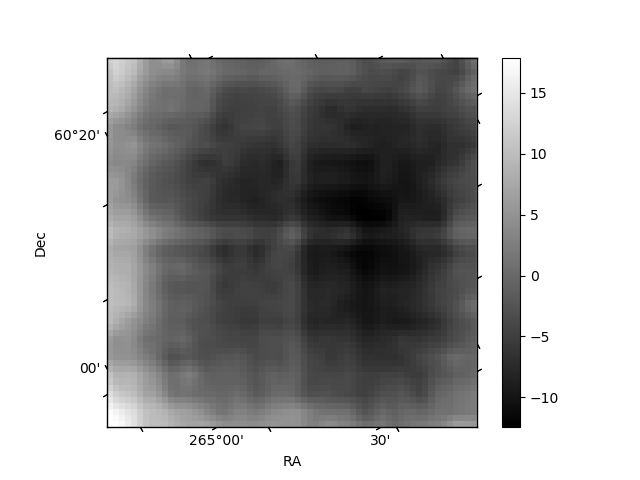
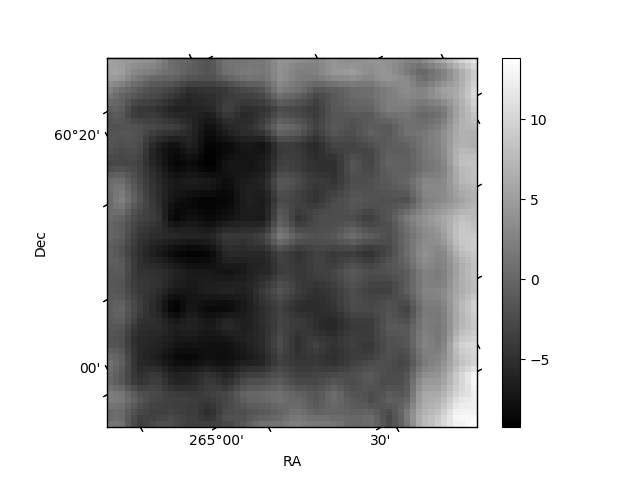
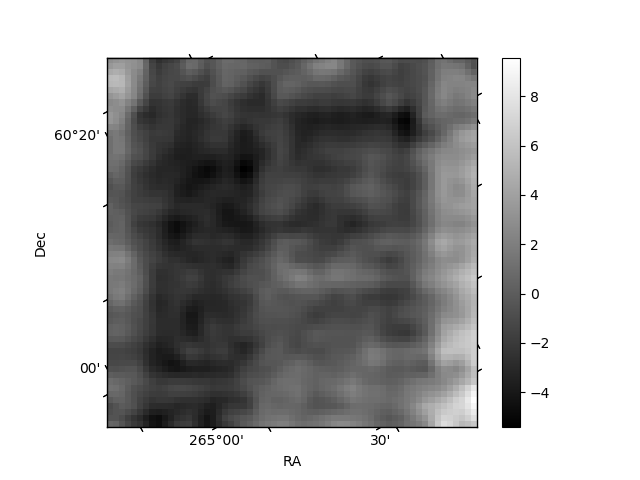
Histogram calculated using DETX and DETY for each event in the final _common_clean file
| Quadrant A | 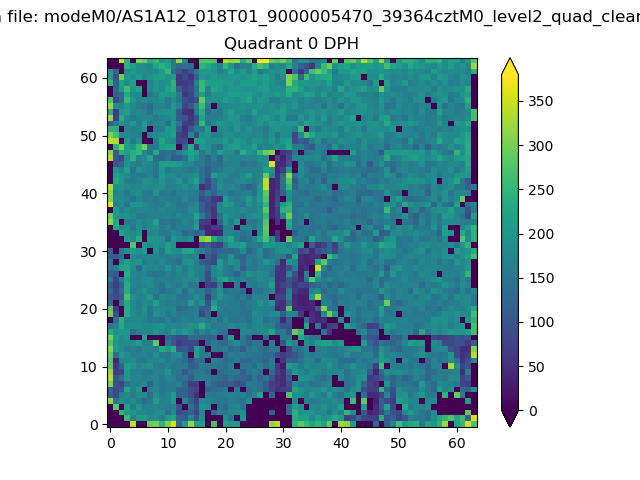 |
 |
Quadrant B |
|---|---|---|---|
| Quadrant D | 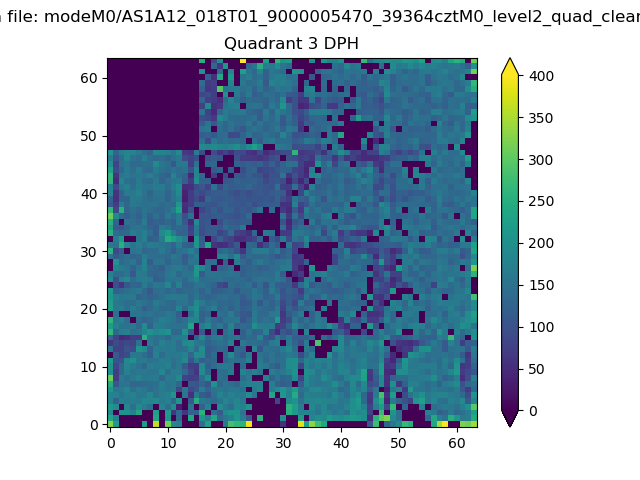 |
 |
Quadrant C |
| Plot type | Count rate plots | Images |
|---|---|---|
| Comparison with Poisson distribution Blue bars denote a histogram of data divided into 1 sec bins. Red curve is a Poisson curve with rate = median count rate of data. |
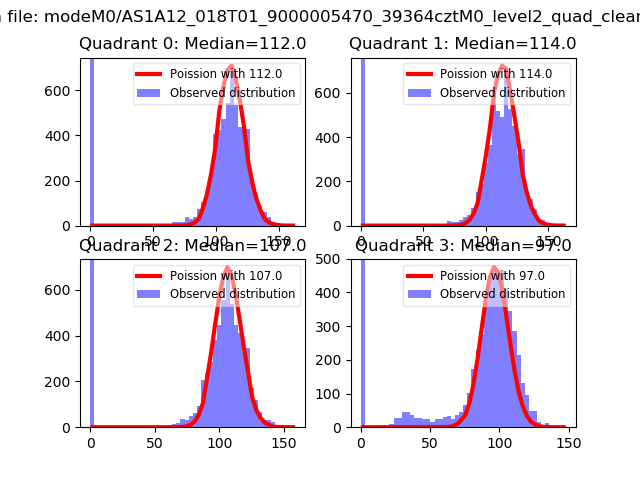 |
 |
| Quadrant-wise count rates Data is divided into 100 sec bins |
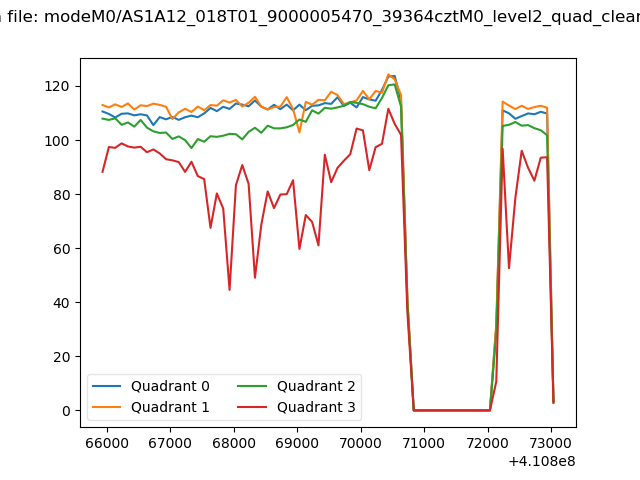 |
|
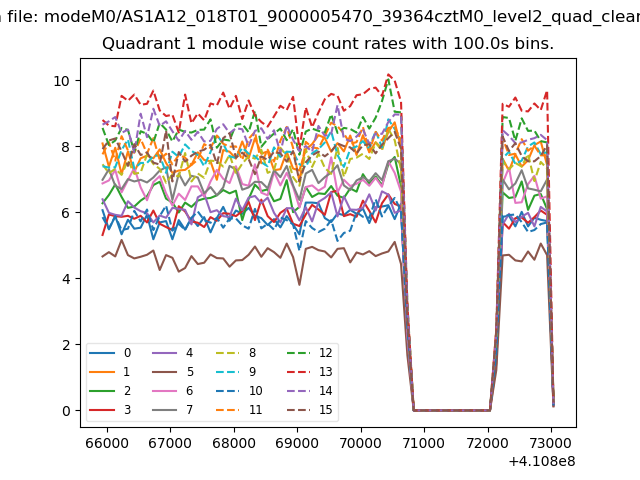
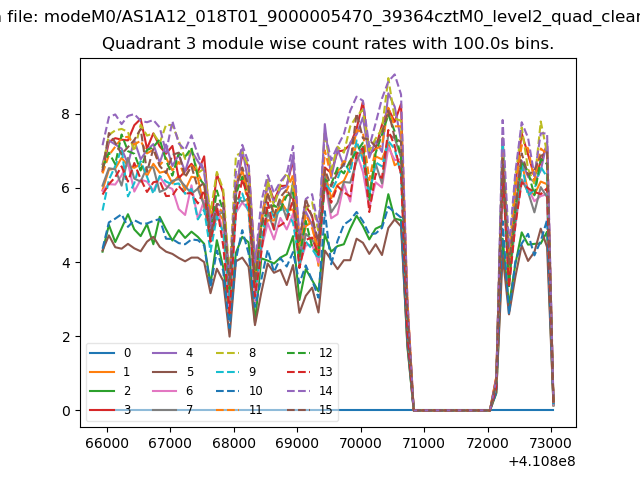
| Module-wise count rates for Quadrant A Data is divided into 100 sec bins |
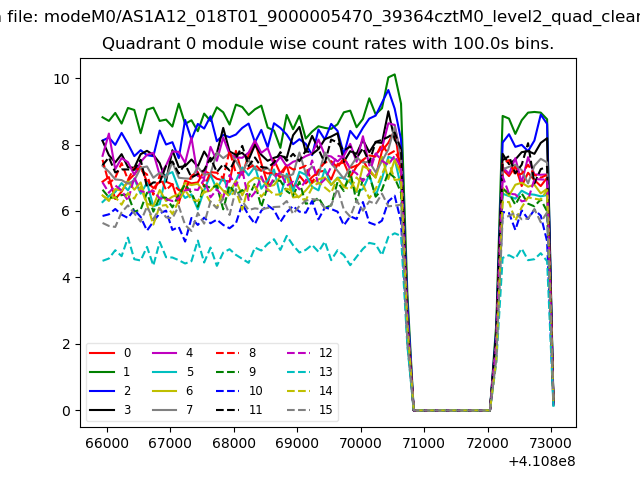 |
 |
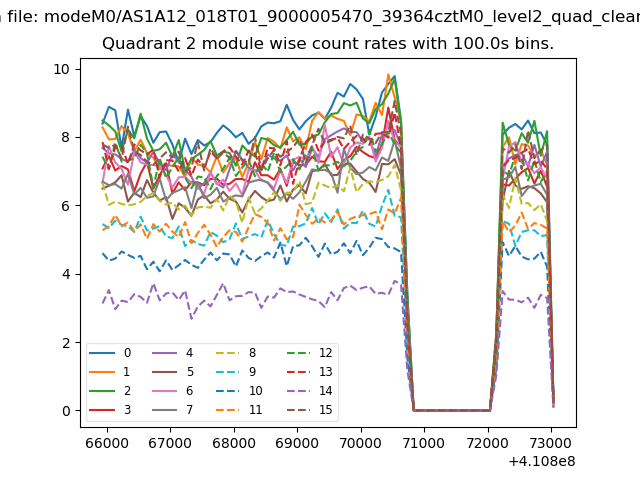
| Module-wise count rates for Quadrant B Data is divided into 100 sec bins |
 |
 |
| Module-wise count rates for Quadrant C Data is divided into 100 sec bins |
 |
 |
| Module-wise count rates for Quadrant D Data is divided into 100 sec bins |
 |
 |
| Parameter | Plot |
|---|---|
| CZT HV Monitor | 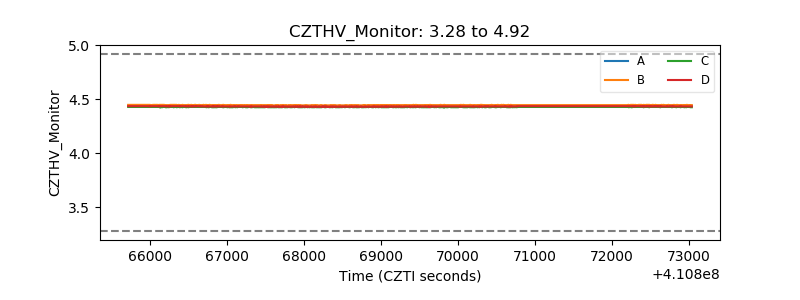 |
| D_VDD | 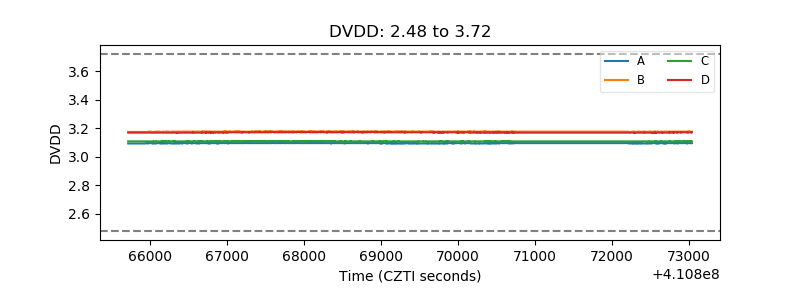 |
| Temperature 1 | 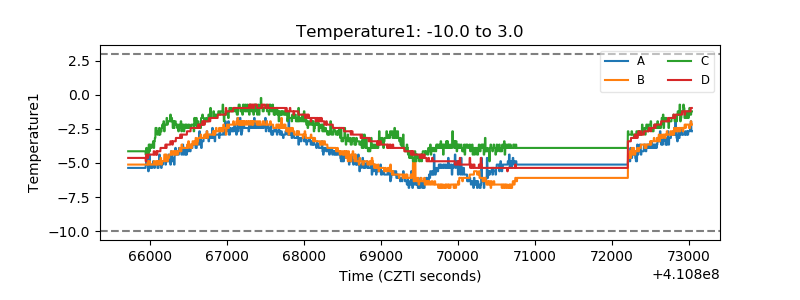 |
| Veto HV Monitor |  |
| Veto LLD | 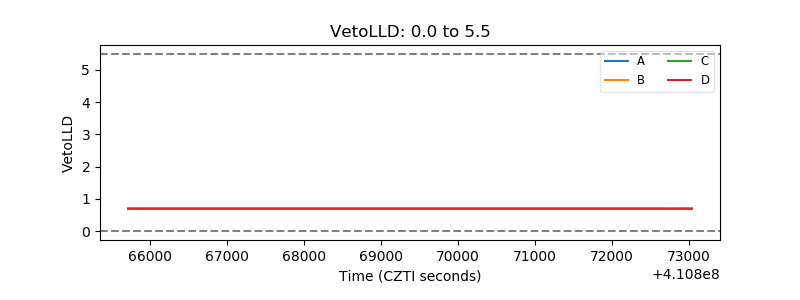 |
| Alpha Counter |  |
| _CPM_Rate | 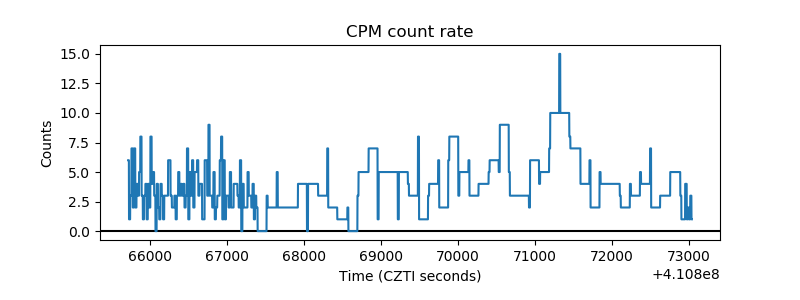 |
| CZT Counter | 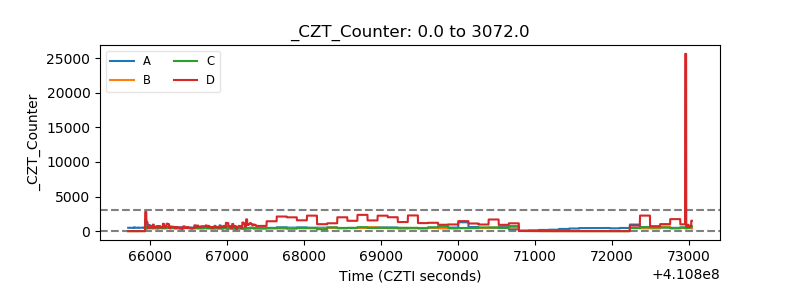 |
| +2.5 Volts monitor | 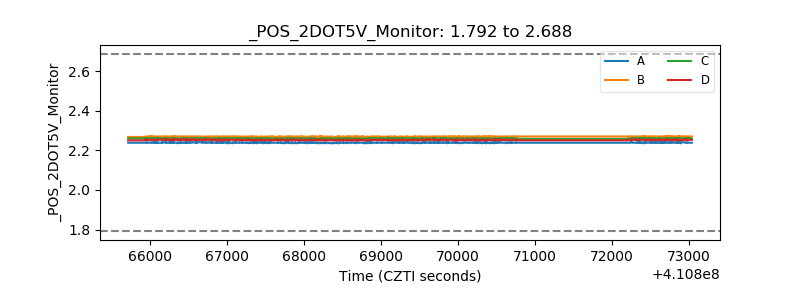 |
| +5 Volts monitor | 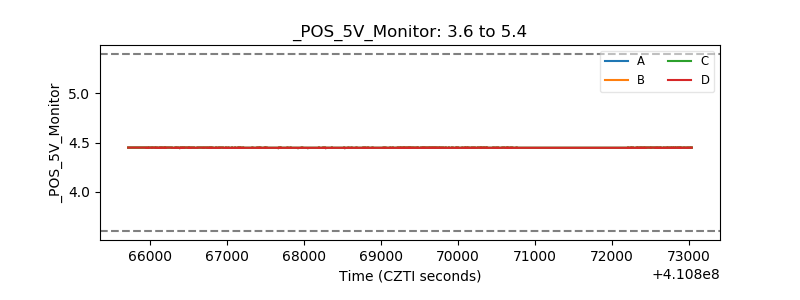 |
| _ROLL_ROT | 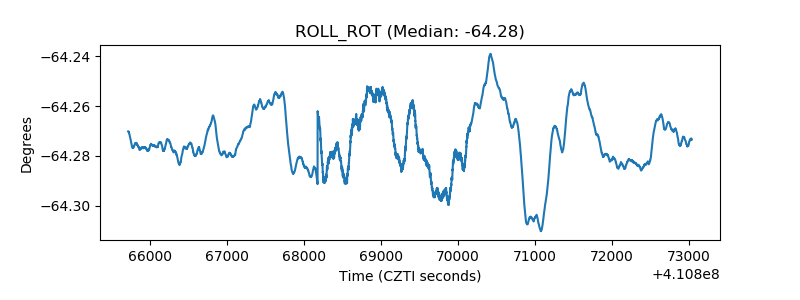 |
| _Roll_DEC | 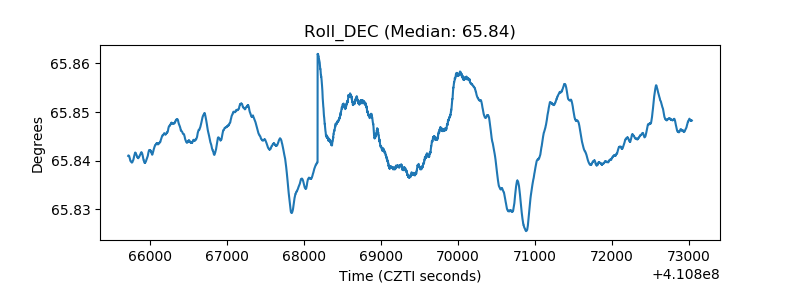 |
| _Roll_RA | 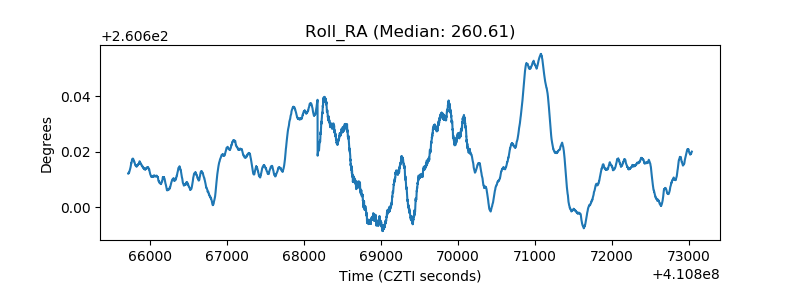 |
| Veto Counter | 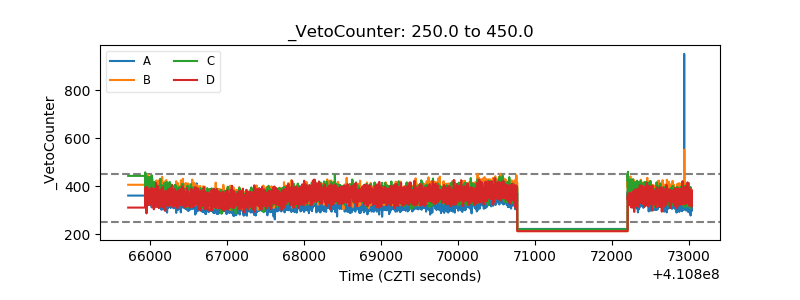 |