| Param | Original file | Final file |
|---|---|---|
| Filename | modeM0/AS1A12_018T01_9000005470_39365cztM0_level2.fits | modeM0/AS1A12_018T01_9000005470_39365cztM0_level2_quad_clean.evt |
| Size (bytes) | 1,864,082,880 | 341,953,920 |
| Size | 1.7 GB | 326.1 MB |
| Events in quadrant A | 11,339,952 | 2,452,229 |
| Events in quadrant B | 10,069,610 | 2,519,373 |
| Events in quadrant C | 12,192,070 | 2,316,749 |
| Events in quadrant D | 33,742,666 | 1,585,931 |
| Mode M9 | |||
|---|---|---|---|
| Quadrant | BADHDUFLAG | Total packets | Discarded packets |
| A | 0 | 78 | 0 |
| B | 0 | 78 | 0 |
| C | 0 | 78 | 0 |
| D | 0 | 78 | 0 |
| Mode SS | |||
|---|---|---|---|
| Quadrant | BADHDUFLAG | Total packets | Discarded packets |
| A | 0 | 438 | 0 |
| B | 0 | 438 | 0 |
| C | 0 | 438 | 0 |
| D | 0 | 438 | 0 |
| Mode M0 | |||
|---|---|---|---|
| Quadrant | BADHDUFLAG | Total packets | Discarded packets |
| A | 0 | 46438 | 7 |
| B | 0 | 45270 | 8 |
| C | 0 | 50132 | 6 |
| D | 0 | 115210 | 6 |
| Quadrant | Total seconds | Saturated seconds | Saturation percentage |
|---|---|---|---|
| A | 21479 | 96 | 0.446948% |
| B | 21478 | 137 | 0.637862% |
| C | 21478 | 341 | 1.587671% |
| D | 21478 | 6456 | 30.058665% |
Noise dominated data is calculated using 1-second bins in cleaned event files. If a bin has >2000 counts, and if more than 50% of those come from <1% of pixels, then it is considered to be noise-dominated and hence unusable.
| Quadrant | # 1 sec bins | Bins with >0 counts | Bins with >2000 counts | High rate bins dominated by noise | Noise dominated (total time) | Noise dominated (detector-on time) | Marked lightcurve |
|---|---|---|---|---|---|---|---|
| A | 32276 | 21484 | 62 | 62 | 0.19% | 0.29% | 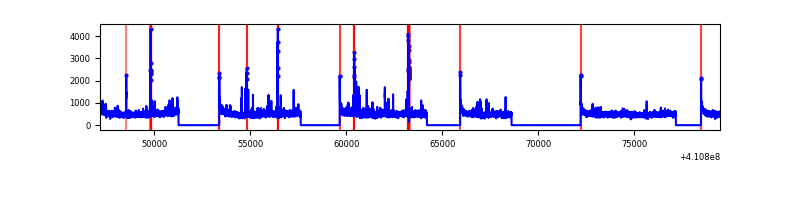 |
| B | 32276 | 21483 | 85 | 85 | 0.26% | 0.40% | 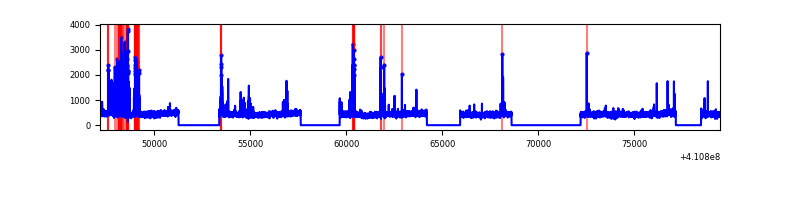 |
| C | 32276 | 21483 | 289 | 289 | 0.90% | 1.35% | 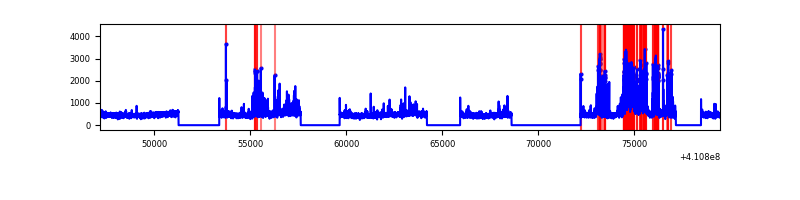 |
| D | 32276 | 21483 | 6049 | 6049 | 18.74% | 28.16% | 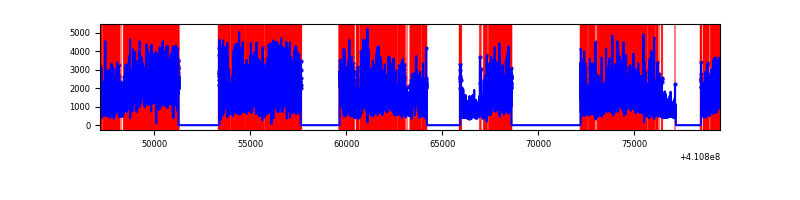 |
Top three noisy pixels from each quadrant. If the there are fewer than three noisy pixels in the level2.evt file, extra rows are filled as -1
| Pixel properties | Quadrant properties | ||||||
|---|---|---|---|---|---|---|---|
| Quadrant | DetID | PixID | Counts | Sigma | Mean | Median | Sigma |
| A | 10 | 83 | 1555535 | 3299.97 | 2365 | 2319 | 470.7 |
| A | 15 | 223 | 285210 | 601.03 | 2365 | 2319 | 470.7 |
| A | 2 | 79 | 186742 | 391.83 | 2365 | 2319 | 470.7 |
| B | 4 | 170 | 546234 | 1224.11 | 2342 | 2272 | 444.4 |
| B | 5 | 255 | 261969 | 584.41 | 2342 | 2272 | 444.4 |
| B | 12 | 111 | 55965 | 120.83 | 2342 | 2272 | 444.4 |
| C | 14 | 254 | 1744588 | 3360.5 | 2271 | 2284 | 518.5 |
| C | 15 | 214 | 898311 | 1728.23 | 2271 | 2284 | 518.5 |
| C | 9 | 187 | 591871 | 1137.18 | 2271 | 2284 | 518.5 |
| D | 12 | 235 | 22857682 | 46522.75 | 2021 | 1963 | 491.3 |
| D | 12 | 227 | 1258520 | 2557.72 | 2021 | 1963 | 491.3 |
| D | 13 | 249 | 733827 | 1489.71 | 2021 | 1963 | 491.3 |
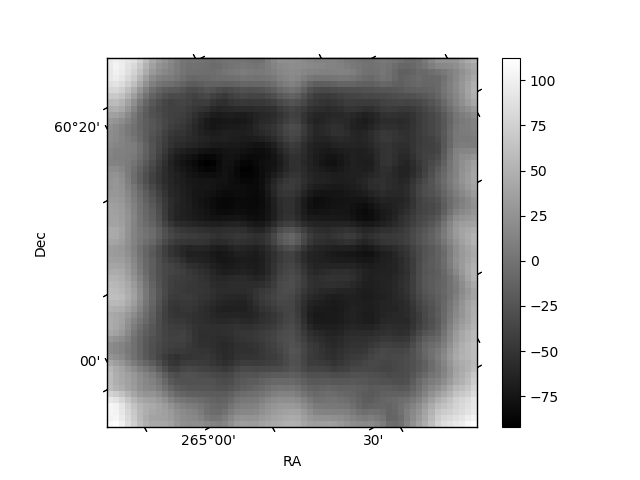
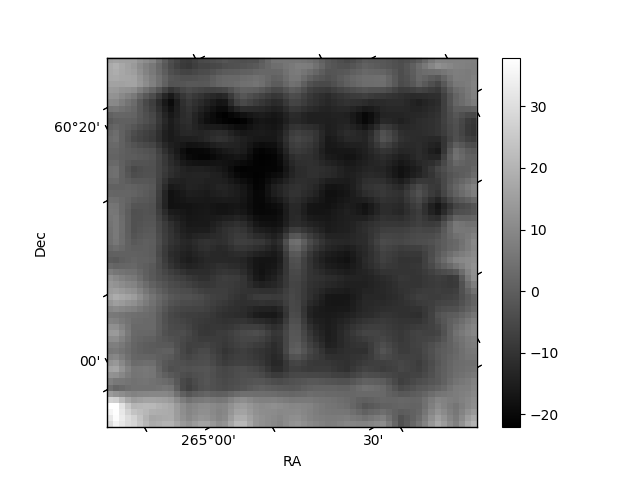
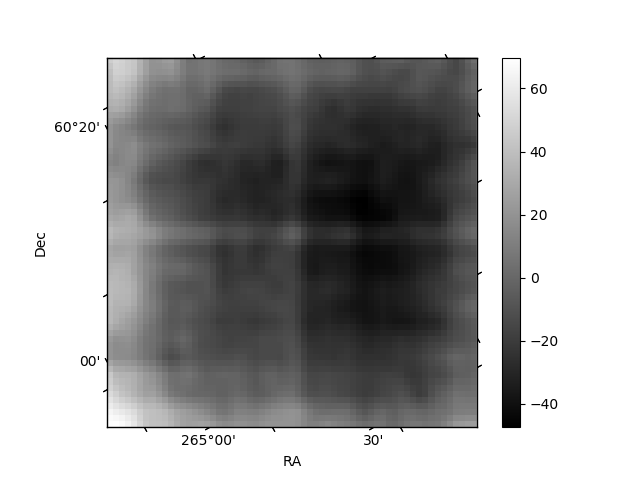
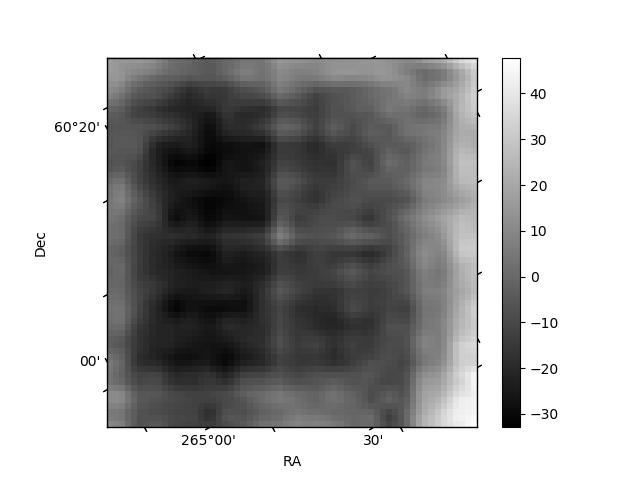
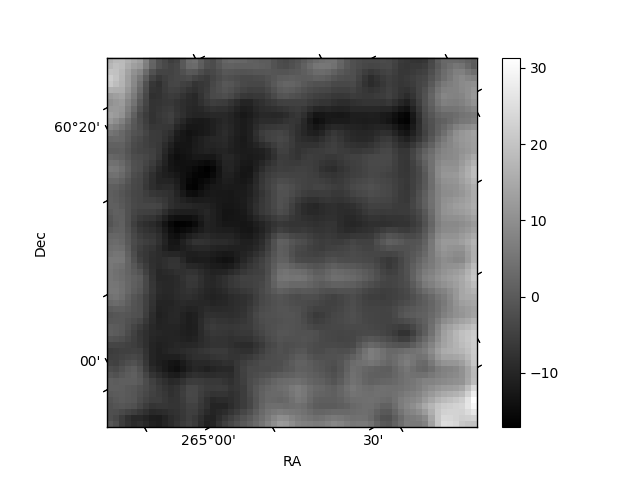
Histogram calculated using DETX and DETY for each event in the final _common_clean file
| Quadrant A | 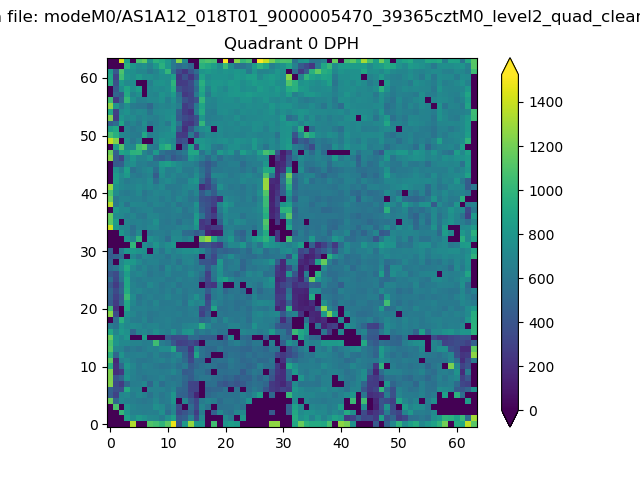 |
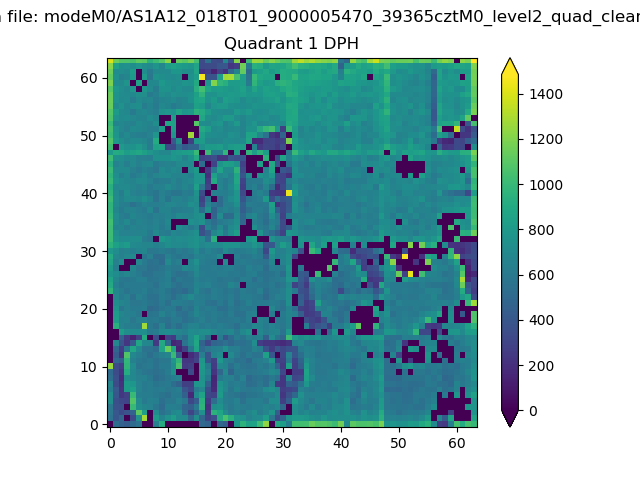 |
Quadrant B |
|---|---|---|---|
| Quadrant D | 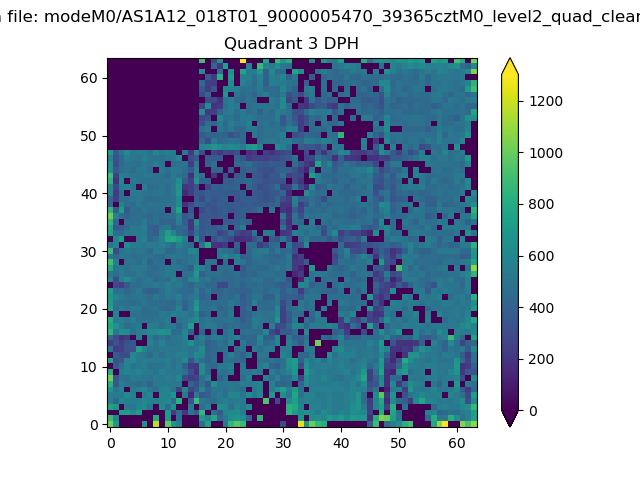 |
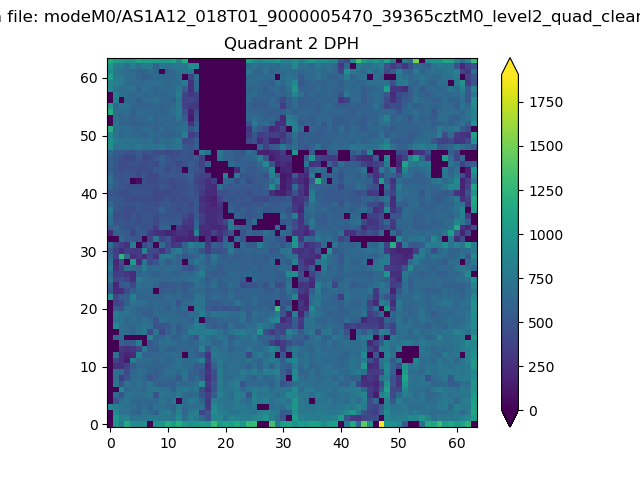 |
Quadrant C |
| Plot type | Count rate plots | Images |
|---|---|---|
| Comparison with Poisson distribution Blue bars denote a histogram of data divided into 1 sec bins. Red curve is a Poisson curve with rate = median count rate of data. |
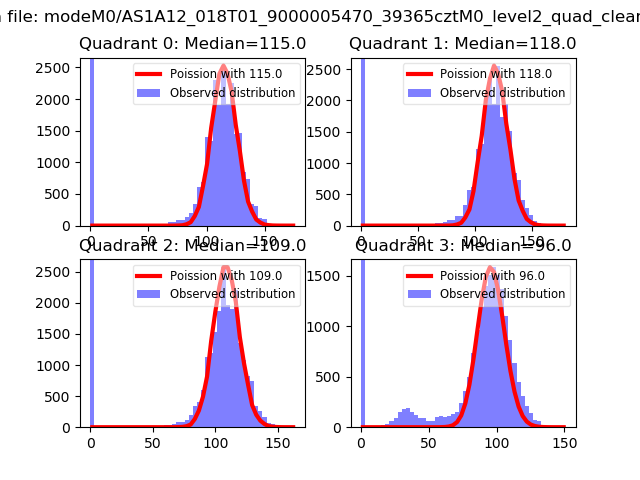 |
 |
| Quadrant-wise count rates Data is divided into 100 sec bins |
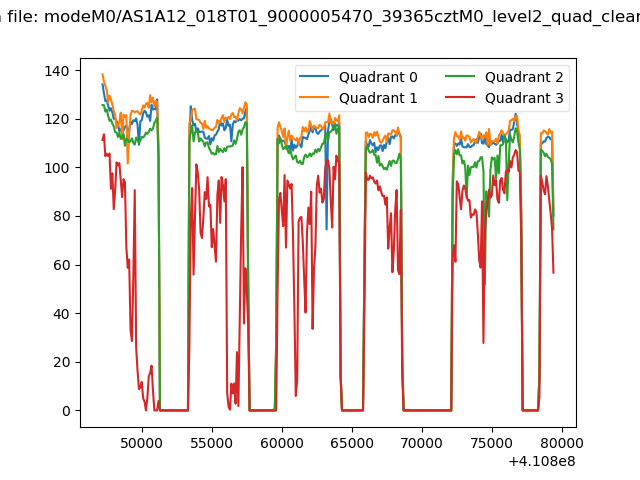 |
|
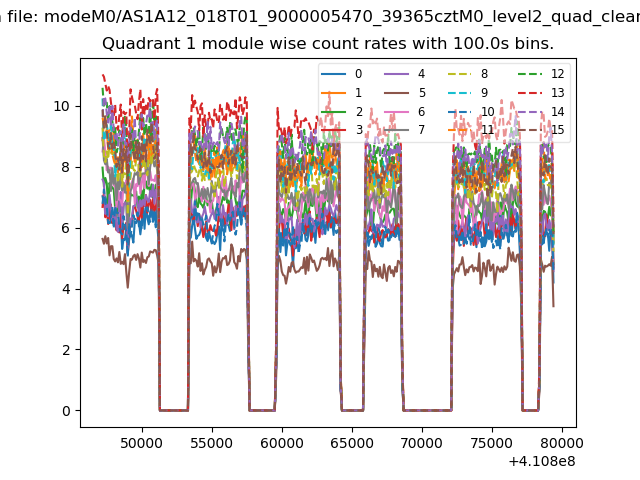
| Module-wise count rates for Quadrant A Data is divided into 100 sec bins |
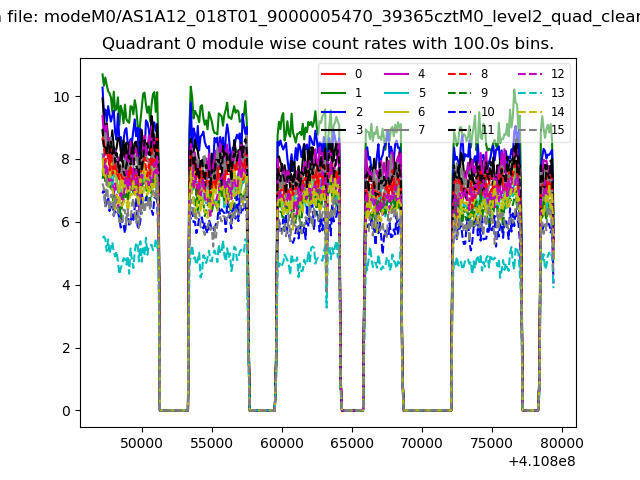 |
 |
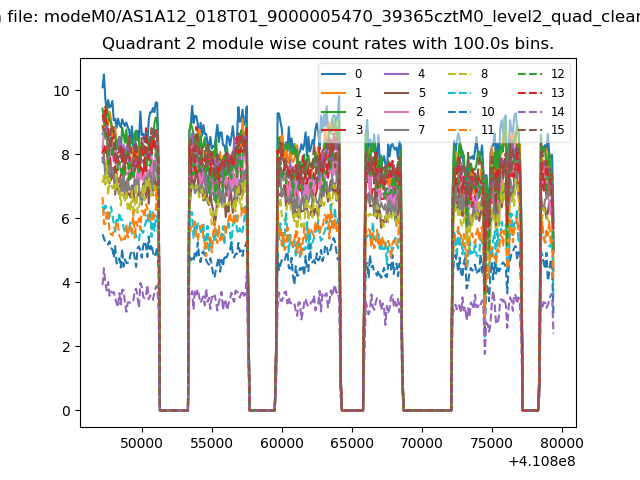
| Module-wise count rates for Quadrant B Data is divided into 100 sec bins |
 |
 |
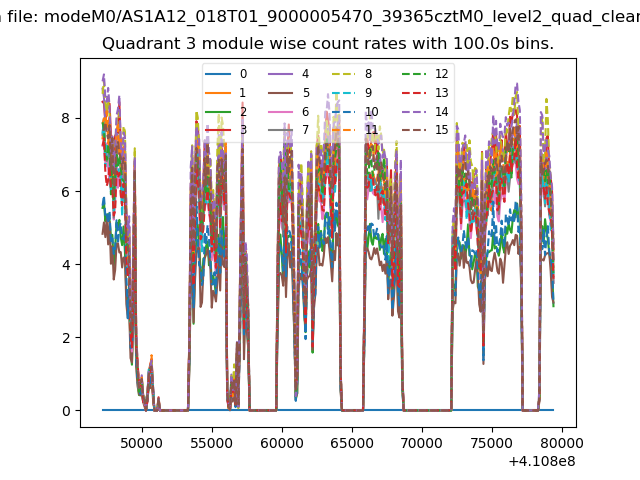
| Module-wise count rates for Quadrant C Data is divided into 100 sec bins |
 |
 |
| Module-wise count rates for Quadrant D Data is divided into 100 sec bins |
 |
 |
| Parameter | Plot |
|---|---|
| CZT HV Monitor | 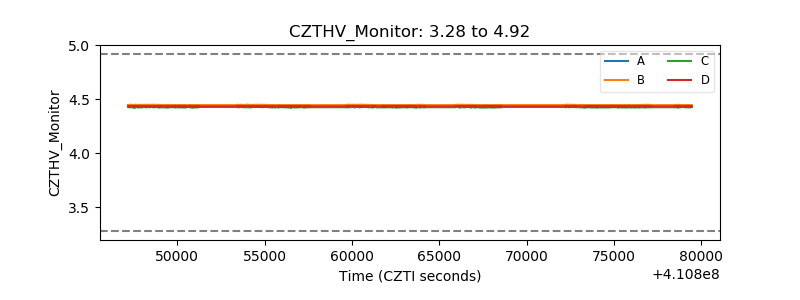 |
| D_VDD | 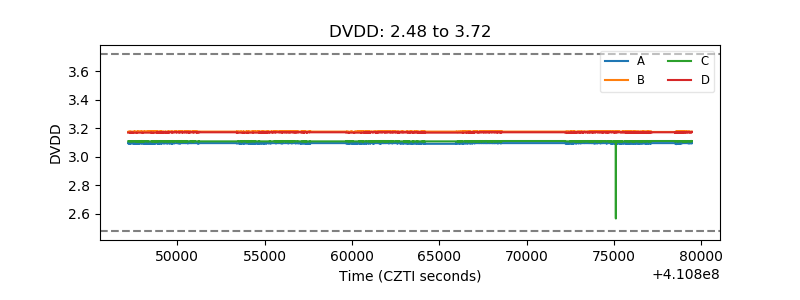 |
| Temperature 1 | 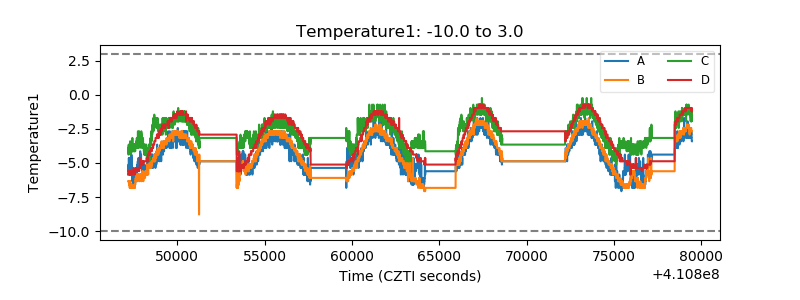 |
| Veto HV Monitor | 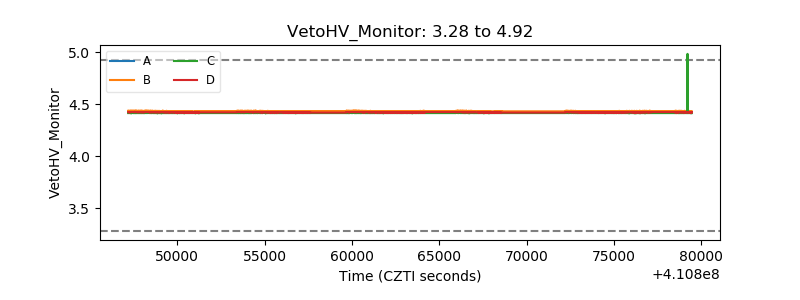 |
| Veto LLD | 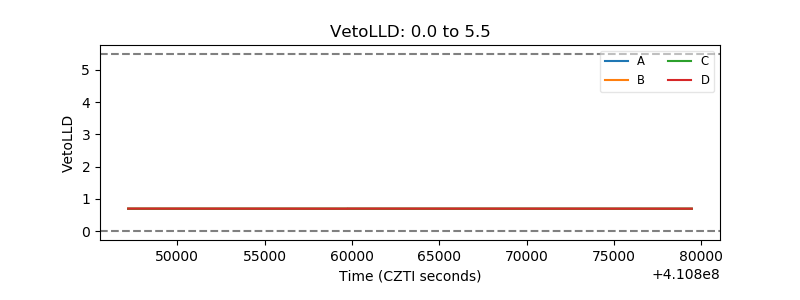 |
| Alpha Counter | 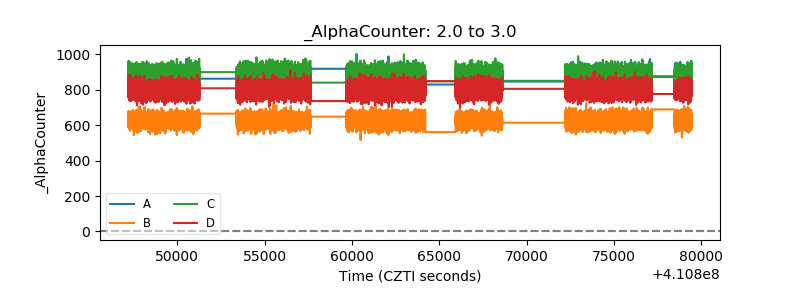 |
| _CPM_Rate | 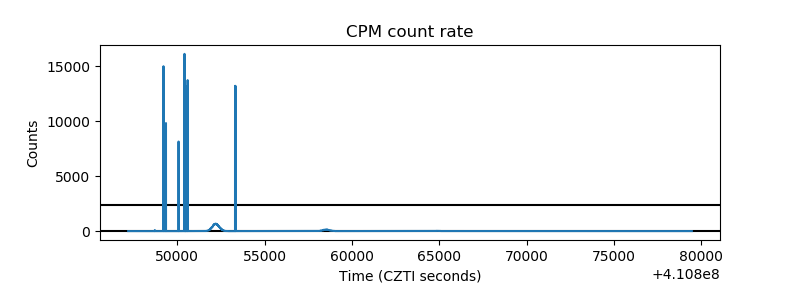 |
| CZT Counter | 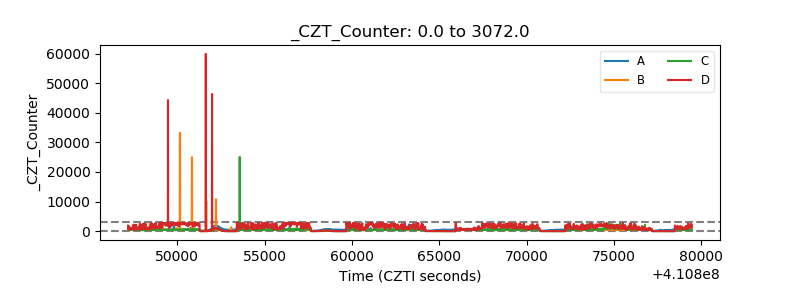 |
| +2.5 Volts monitor | 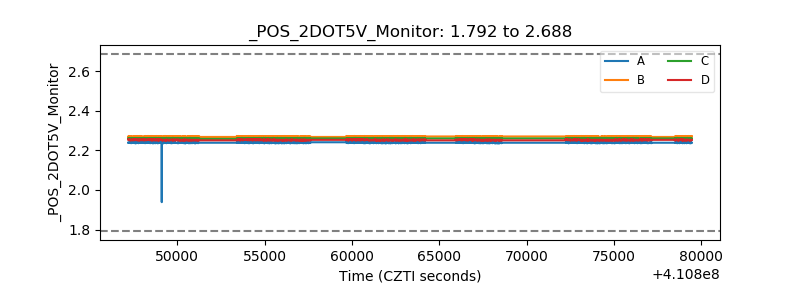 |
| +5 Volts monitor | 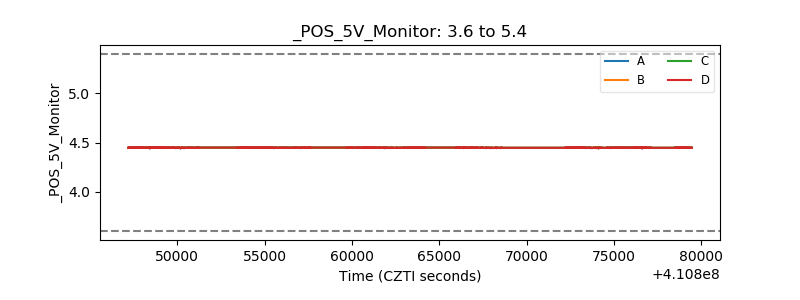 |
| _ROLL_ROT | 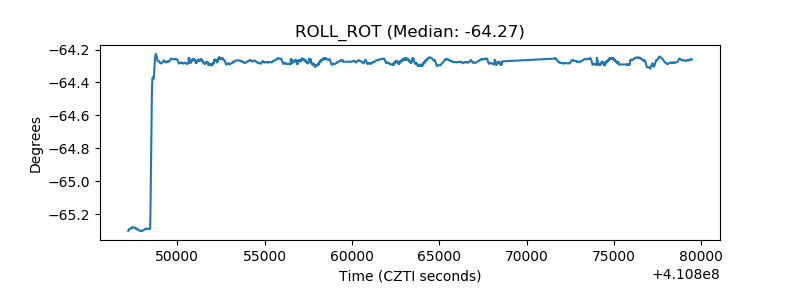 |
| _Roll_DEC | 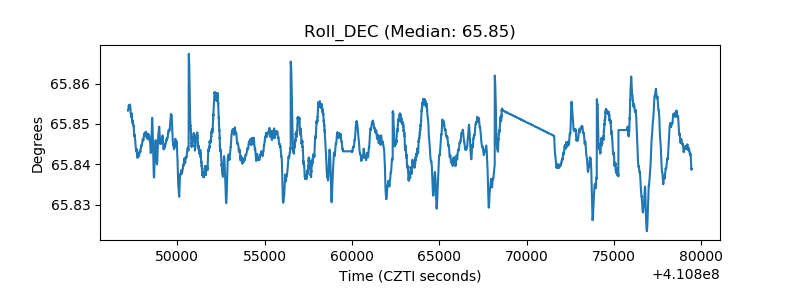 |
| _Roll_RA | 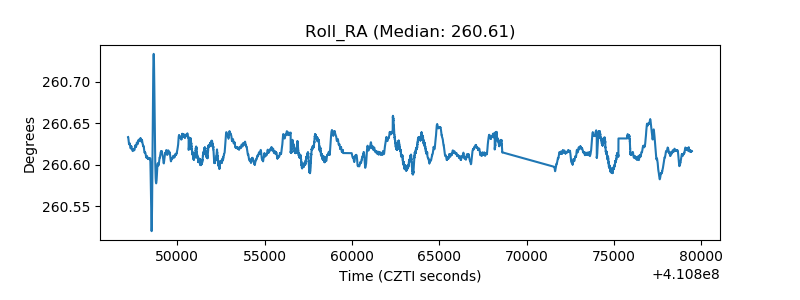 |
| Veto Counter | 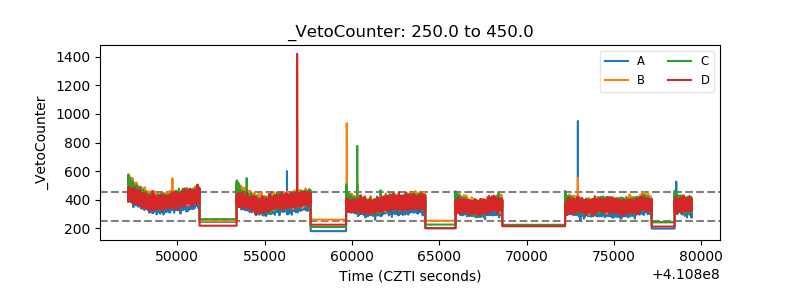 |