| Param | Original file | Final file |
|---|---|---|
| Filename | modeM0/AS1A12_018T01_9000005470_39368cztM0_level2.fits | modeM0/AS1A12_018T01_9000005470_39368cztM0_level2_quad_clean.evt |
| Size (bytes) | 1,000,016,640 | 199,704,960 |
| Size | 953.7 MB | 190.5 MB |
| Events in quadrant A | 6,261,442 | 1,377,784 |
| Events in quadrant B | 5,758,831 | 1,404,913 |
| Events in quadrant C | 6,648,400 | 1,311,799 |
| Events in quadrant D | 17,373,588 | 1,080,397 |
| Mode M9 | |||
|---|---|---|---|
| Quadrant | BADHDUFLAG | Total packets | Discarded packets |
| A | 0 | 28 | 0 |
| B | 0 | 28 | 0 |
| C | 0 | 28 | 0 |
| D | 0 | 29 | 0 |
| Mode SS | |||
|---|---|---|---|
| Quadrant | BADHDUFLAG | Total packets | Discarded packets |
| A | 0 | 254 | 0 |
| B | 0 | 254 | 0 |
| C | 0 | 254 | 0 |
| D | 0 | 254 | 0 |
| Mode M0 | |||
|---|---|---|---|
| Quadrant | BADHDUFLAG | Total packets | Discarded packets |
| A | 0 | 26419 | 3 |
| B | 0 | 26164 | 2 |
| C | 0 | 27627 | 2 |
| D | 0 | 60507 | 2 |
| Quadrant | Total seconds | Saturated seconds | Saturation percentage |
|---|---|---|---|
| A | 12613 | 25 | 0.198208% |
| B | 12613 | 44 | 0.348846% |
| C | 12613 | 104 | 0.824546% |
| D | 12613 | 2195 | 17.402680% |
Noise dominated data is calculated using 1-second bins in cleaned event files. If a bin has >2000 counts, and if more than 50% of those come from <1% of pixels, then it is considered to be noise-dominated and hence unusable.
| Quadrant | # 1 sec bins | Bins with >0 counts | Bins with >2000 counts | High rate bins dominated by noise | Noise dominated (total time) | Noise dominated (detector-on time) | Marked lightcurve |
|---|---|---|---|---|---|---|---|
| A | 15330 | 12615 | 7 | 7 | 0.05% | 0.06% | 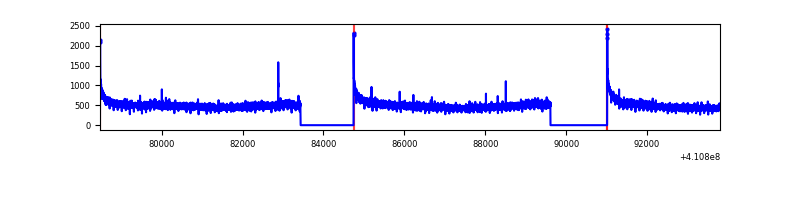 |
| B | 15330 | 12615 | 17 | 17 | 0.11% | 0.13% | 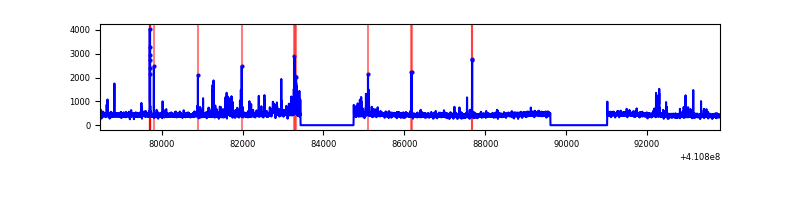 |
| C | 15330 | 12615 | 83 | 83 | 0.54% | 0.66% | 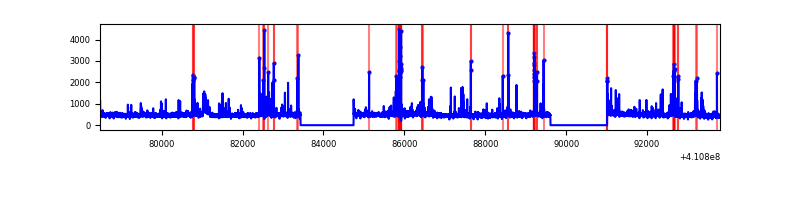 |
| D | 15330 | 12615 | 2225 | 2225 | 14.51% | 17.64% | 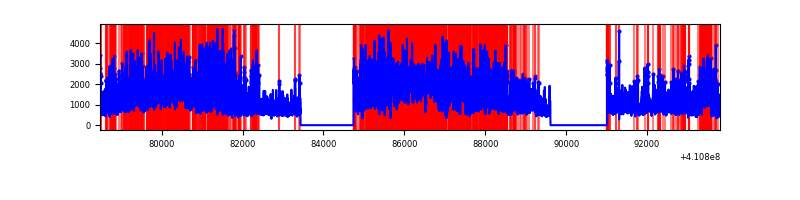 |
Top three noisy pixels from each quadrant. If the there are fewer than three noisy pixels in the level2.evt file, extra rows are filled as -1
| Pixel properties | Quadrant properties | ||||||
|---|---|---|---|---|---|---|---|
| Quadrant | DetID | PixID | Counts | Sigma | Mean | Median | Sigma |
| A | 10 | 83 | 875542 | 3127.61 | 1379 | 1350 | 279.5 |
| A | 3 | 1 | 20189 | 67.4 | 1379 | 1350 | 279.5 |
| A | 13 | 254 | 19600 | 65.29 | 1379 | 1350 | 279.5 |
| B | 5 | 200 | 186296 | 704.75 | 1369 | 1328 | 262.5 |
| B | 4 | 170 | 55274 | 205.54 | 1369 | 1328 | 262.5 |
| B | 15 | 35 | 43980 | 162.51 | 1369 | 1328 | 262.5 |
| C | 15 | 214 | 518123 | 1658.29 | 1341 | 1350 | 311.6 |
| C | 14 | 254 | 429783 | 1374.81 | 1341 | 1350 | 311.6 |
| C | 9 | 187 | 247187 | 788.87 | 1341 | 1350 | 311.6 |
| D | 12 | 235 | 11287996 | 36128.58 | 1280 | 1244 | 312.4 |
| D | 13 | 249 | 522993 | 1670.1 | 1280 | 1244 | 312.4 |
| D | 2 | 249 | 208185 | 662.41 | 1280 | 1244 | 312.4 |
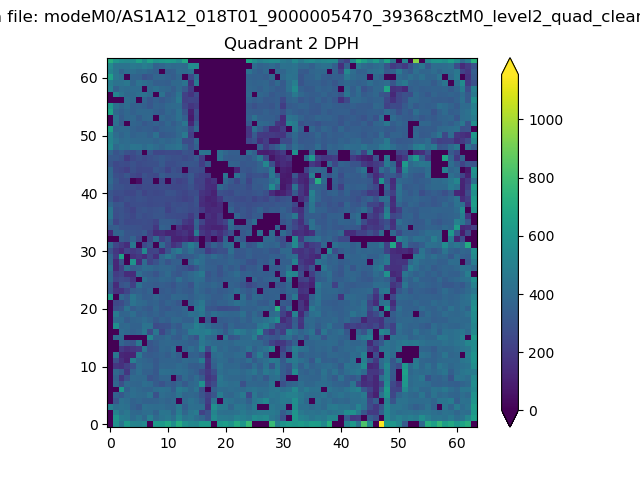
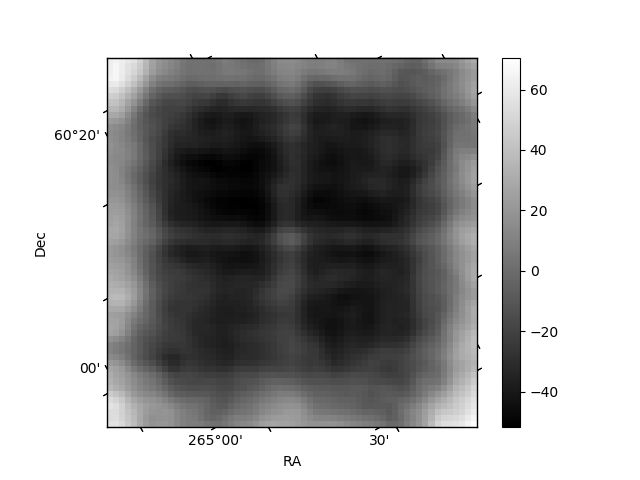
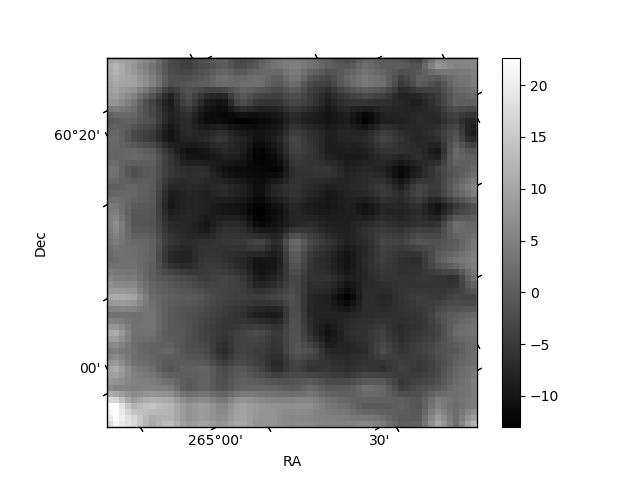
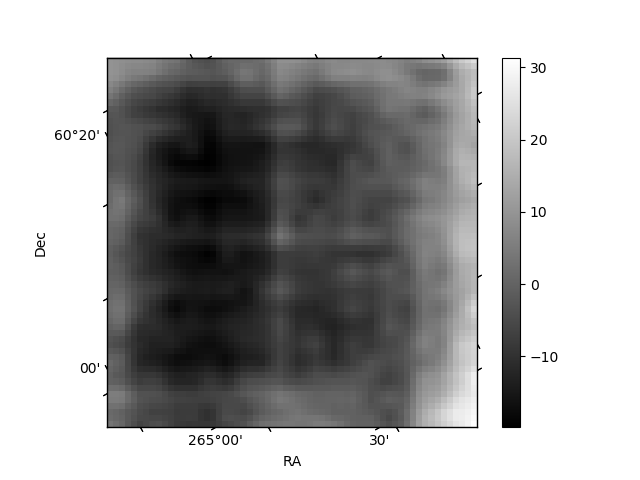
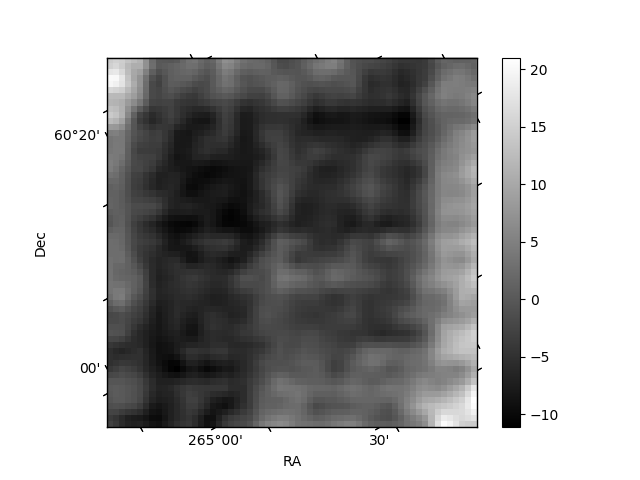
Histogram calculated using DETX and DETY for each event in the final _common_clean file
| Quadrant A | 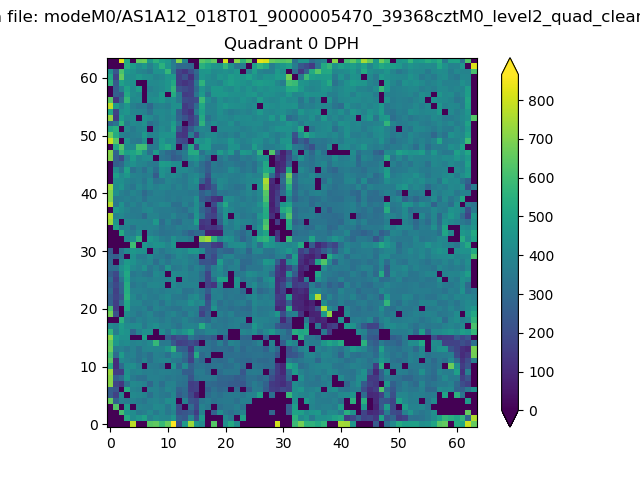 |
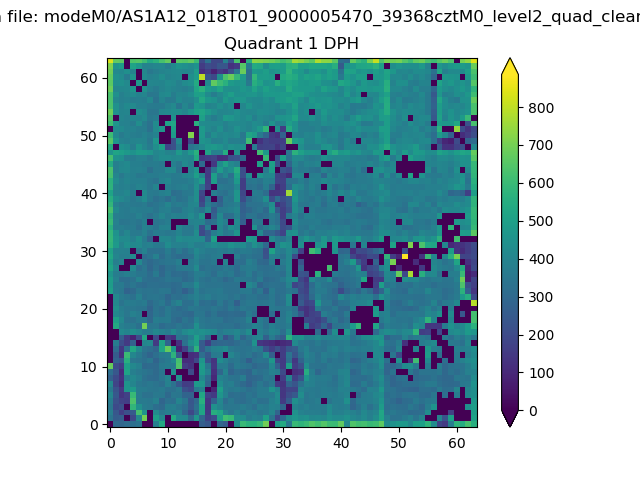 |
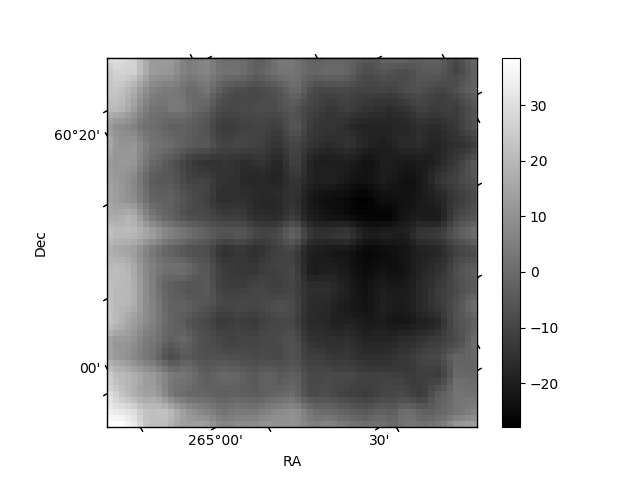
Quadrant B |
|---|---|---|---|
| Quadrant D | 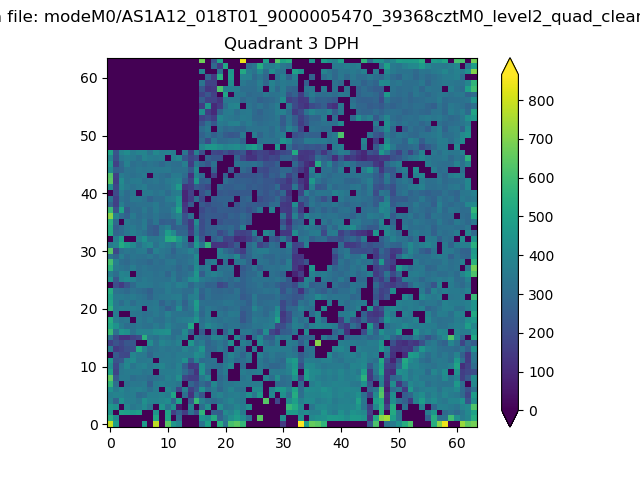 |
 |
Quadrant C |
| Plot type | Count rate plots | Images |
|---|---|---|
| Comparison with Poisson distribution Blue bars denote a histogram of data divided into 1 sec bins. Red curve is a Poisson curve with rate = median count rate of data. |
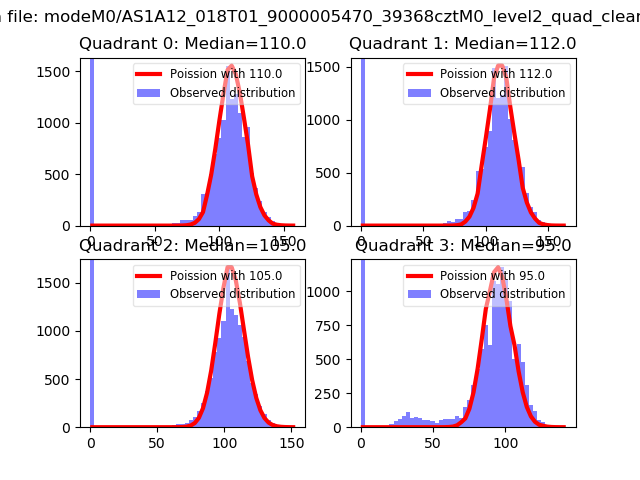 |
 |
| Quadrant-wise count rates Data is divided into 100 sec bins |
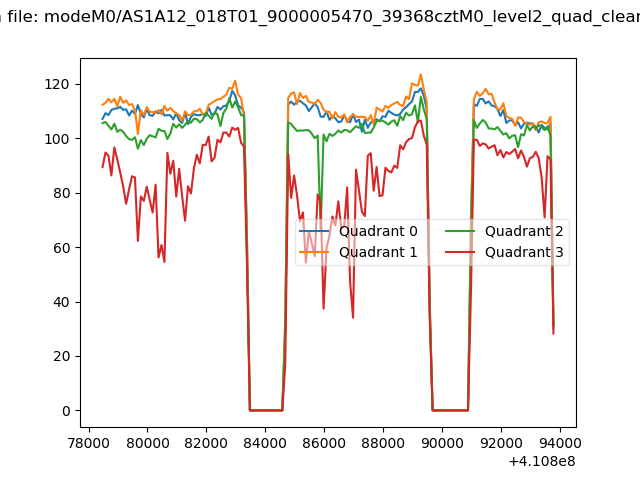 |
|
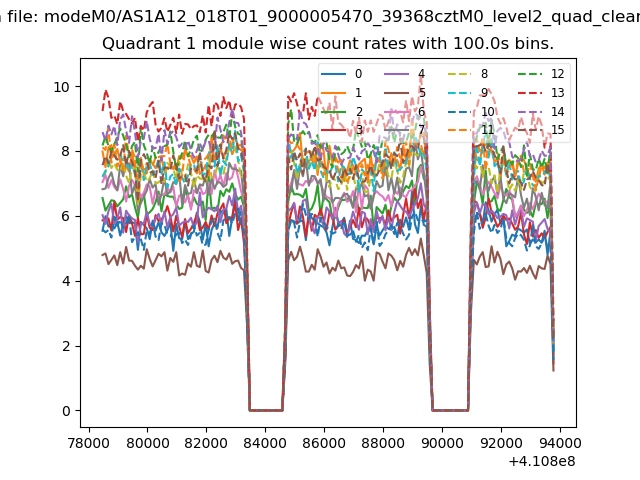
| Module-wise count rates for Quadrant A Data is divided into 100 sec bins |
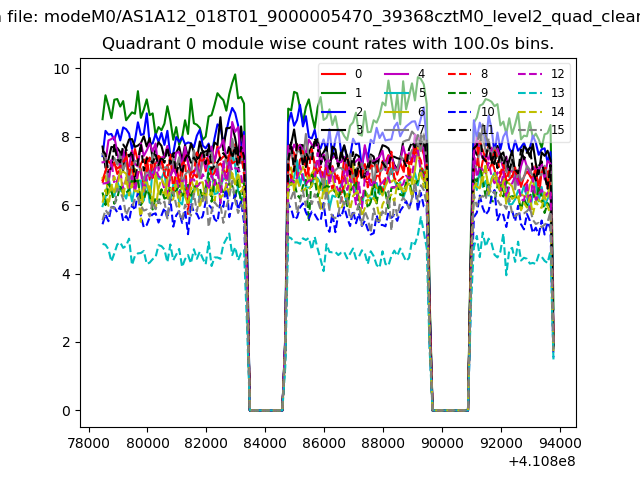 |
 |
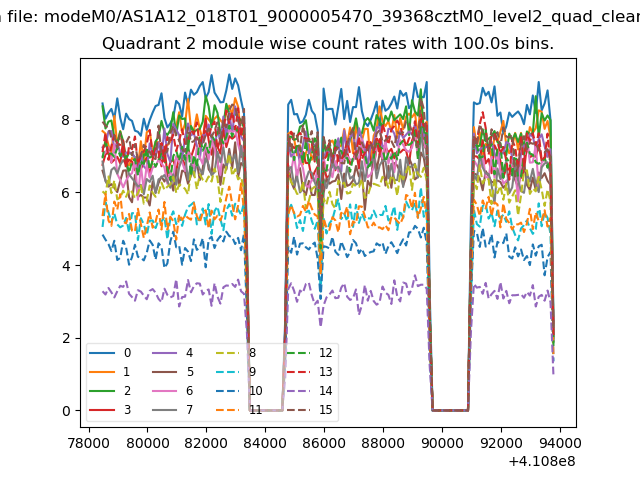
| Module-wise count rates for Quadrant B Data is divided into 100 sec bins |
 |
 |
| Module-wise count rates for Quadrant C Data is divided into 100 sec bins |
 |
 |
| Module-wise count rates for Quadrant D Data is divided into 100 sec bins |
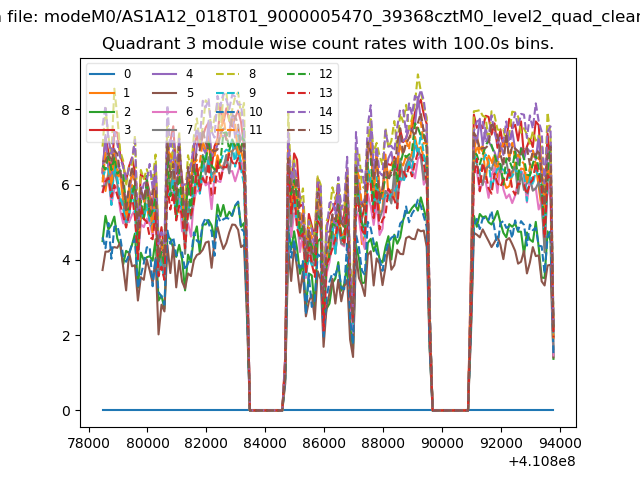 |
 |
| Parameter | Plot |
|---|---|
| CZT HV Monitor | 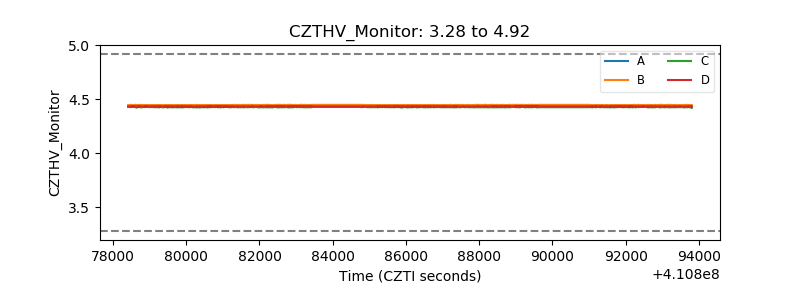 |
| D_VDD | 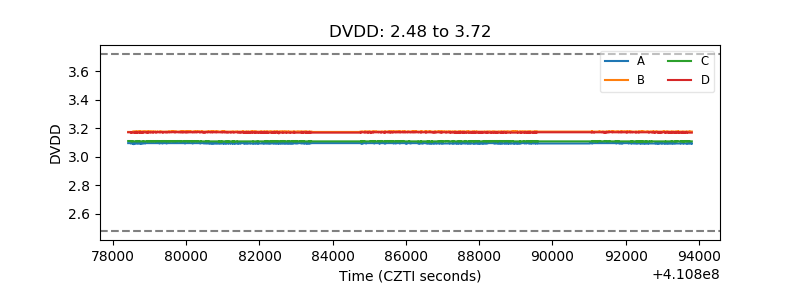 |
| Temperature 1 | 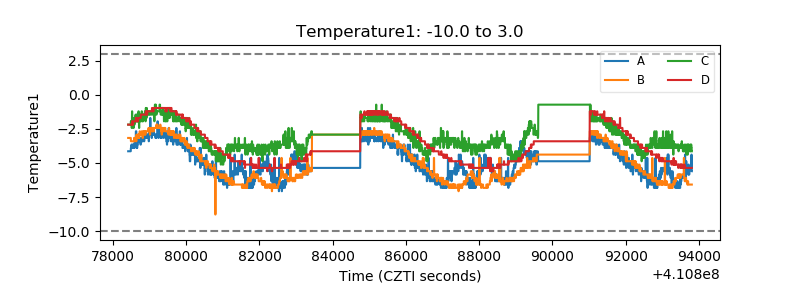 |
| Veto HV Monitor | 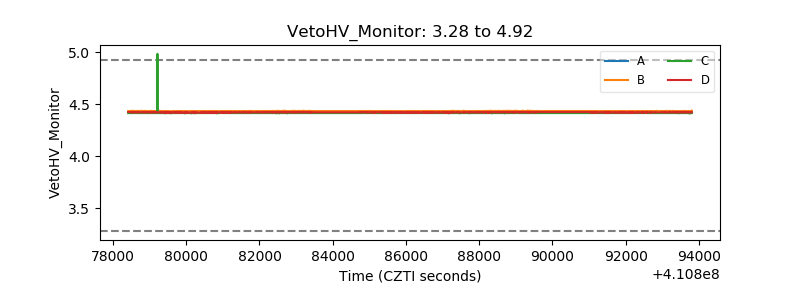 |
| Veto LLD | 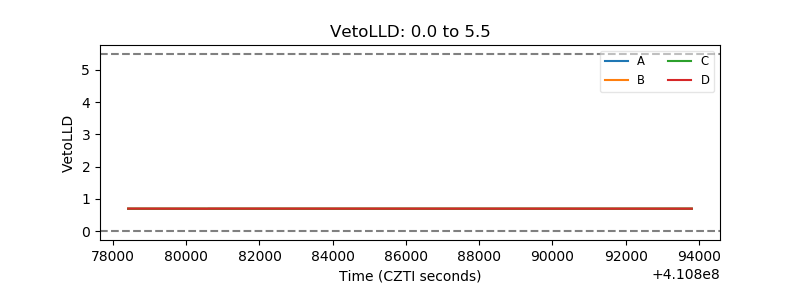 |
| Alpha Counter | 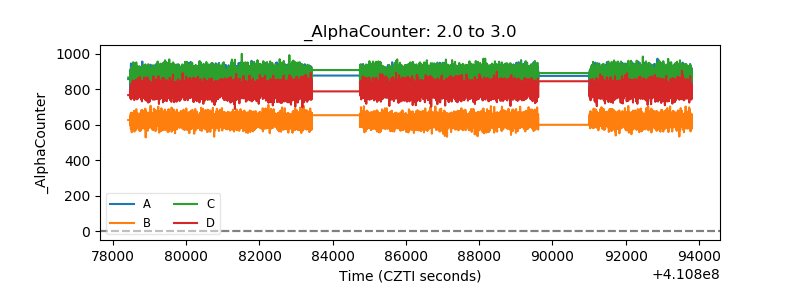 |
| _CPM_Rate | 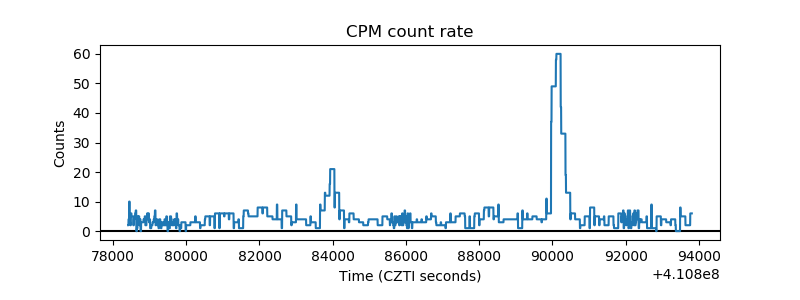 |
| CZT Counter | 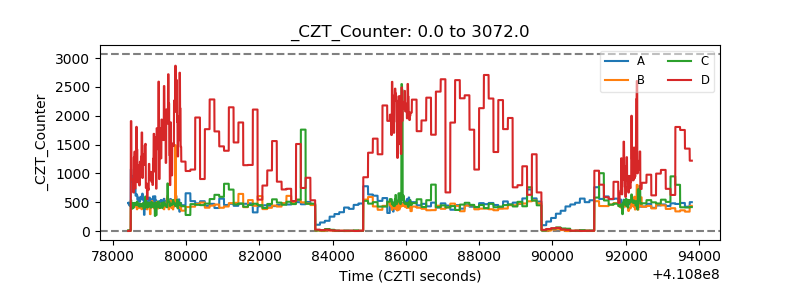 |
| +2.5 Volts monitor | 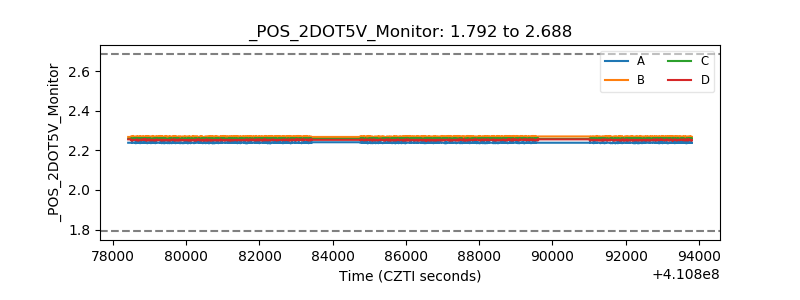 |
| +5 Volts monitor | 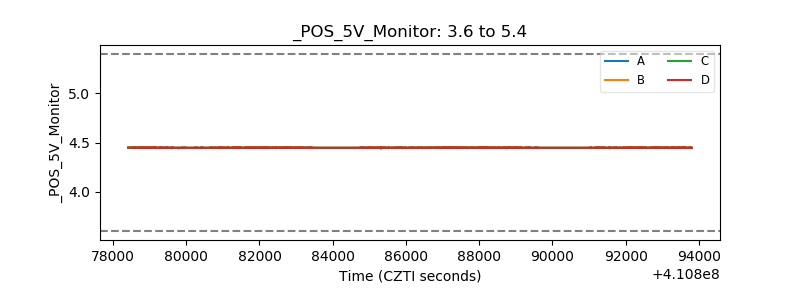 |
| _ROLL_ROT | 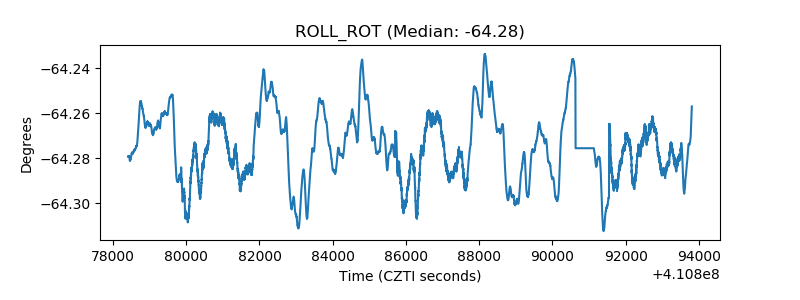 |
| _Roll_DEC | 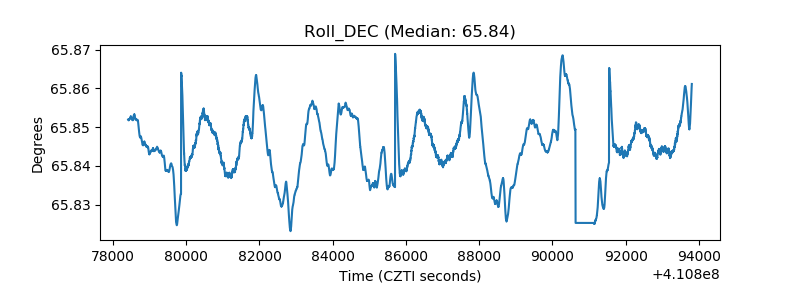 |
| _Roll_RA | 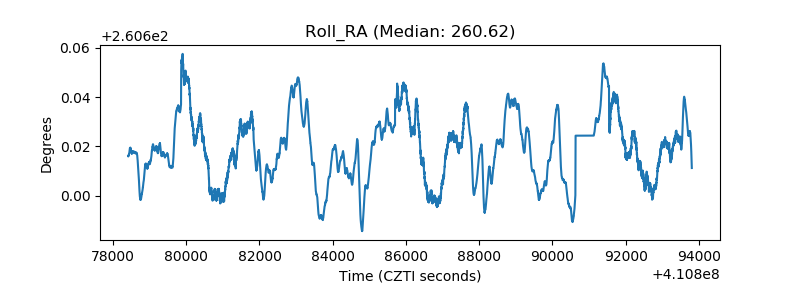 |
| Veto Counter | 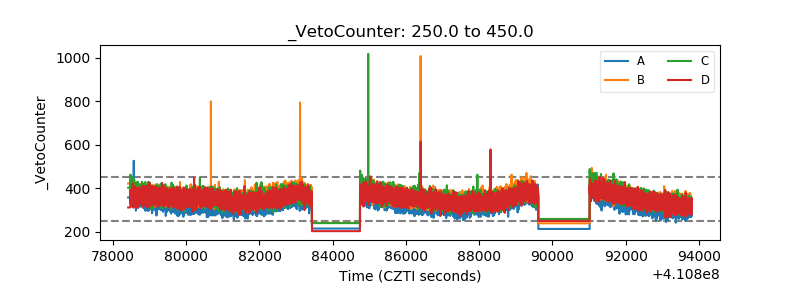 |