| Param | Original file | Final file |
|---|---|---|
| Filename | modeM0/AS1A12_018T01_9000005470_39369cztM0_level2.fits | modeM0/AS1A12_018T01_9000005470_39369cztM0_level2_quad_clean.evt |
| Size (bytes) | 499,596,480 | 124,948,800 |
| Size | 476.5 MB | 119.2 MB |
| Events in quadrant A | 3,805,744 | 843,033 |
| Events in quadrant B | 4,142,134 | 856,119 |
| Events in quadrant C | 3,819,035 | 818,109 |
| Events in quadrant D | 6,136,867 | 738,002 |
| Mode M9 | |||
|---|---|---|---|
| Quadrant | BADHDUFLAG | Total packets | Discarded packets |
| A | 0 | 32 | 0 |
| B | 0 | 32 | 0 |
| C | 0 | 32 | 0 |
| D | 0 | 32 | 0 |
| Mode SS | |||
|---|---|---|---|
| Quadrant | BADHDUFLAG | Total packets | Discarded packets |
| A | 0 | 154 | 0 |
| B | 0 | 154 | 0 |
| C | 0 | 154 | 0 |
| D | 0 | 154 | 0 |
| Mode M0 | |||
|---|---|---|---|
| Quadrant | BADHDUFLAG | Total packets | Discarded packets |
| A | 0 | 16122 | 3 |
| B | 0 | 17551 | 2 |
| C | 0 | 16083 | 2 |
| D | 0 | 23407 | 2 |
| Quadrant | Total seconds | Saturated seconds | Saturation percentage |
|---|---|---|---|
| A | 7594 | 12 | 0.158019% |
| B | 7594 | 107 | 1.409007% |
| C | 7594 | 23 | 0.302871% |
| D | 7594 | 395 | 5.201475% |
Noise dominated data is calculated using 1-second bins in cleaned event files. If a bin has >2000 counts, and if more than 50% of those come from <1% of pixels, then it is considered to be noise-dominated and hence unusable.
| Quadrant | # 1 sec bins | Bins with >0 counts | Bins with >2000 counts | High rate bins dominated by noise | Noise dominated (total time) | Noise dominated (detector-on time) | Marked lightcurve |
|---|---|---|---|---|---|---|---|
| A | 10700 | 7596 | 4 | 4 | 0.04% | 0.05% | 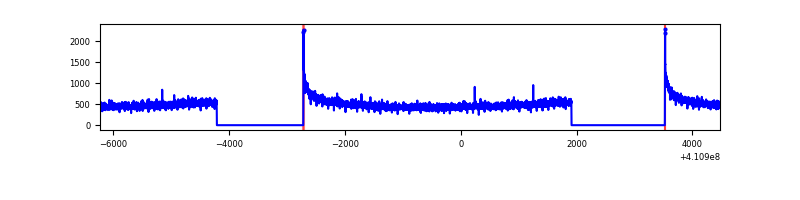 |
| B | 10700 | 7596 | 46 | 46 | 0.43% | 0.61% | 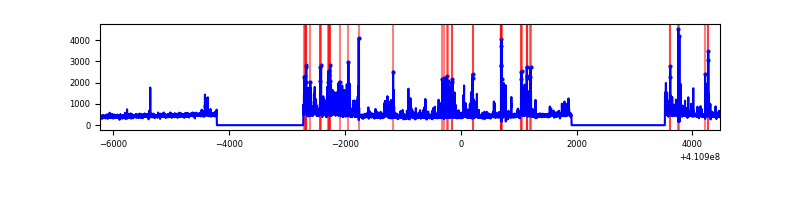 |
| C | 10700 | 7596 | 15 | 15 | 0.14% | 0.20% | 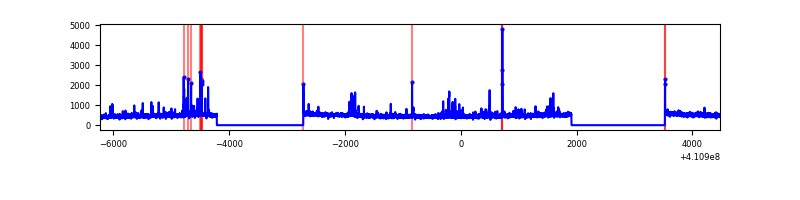 |
| D | 10700 | 7596 | 310 | 310 | 2.90% | 4.08% | 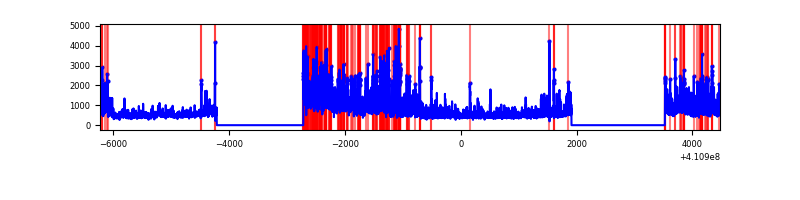 |
Top three noisy pixels from each quadrant. If the there are fewer than three noisy pixels in the level2.evt file, extra rows are filled as -1
| Pixel properties | Quadrant properties | ||||||
|---|---|---|---|---|---|---|---|
| Quadrant | DetID | PixID | Counts | Sigma | Mean | Median | Sigma |
| A | 10 | 83 | 533558 | 3115.71 | 839 | 821 | 171.0 |
| A | 3 | 1 | 15233 | 84.29 | 839 | 821 | 171.0 |
| A | 13 | 254 | 13247 | 72.67 | 839 | 821 | 171.0 |
| B | 5 | 172 | 759830 | 4707.07 | 831 | 806 | 161.3 |
| B | 4 | 170 | 67252 | 412.06 | 831 | 806 | 161.3 |
| B | 5 | 255 | 24486 | 146.85 | 831 | 806 | 161.3 |
| C | 15 | 214 | 318023 | 1660.62 | 816 | 820 | 191.0 |
| C | 3 | 110 | 130012 | 676.35 | 816 | 820 | 191.0 |
| C | 14 | 254 | 107066 | 556.22 | 816 | 820 | 191.0 |
| D | 12 | 235 | 2245684 | 11479.88 | 799 | 776 | 195.6 |
| D | 13 | 249 | 463882 | 2368.2 | 799 | 776 | 195.6 |
| D | 2 | 250 | 102435 | 519.86 | 799 | 776 | 195.6 |
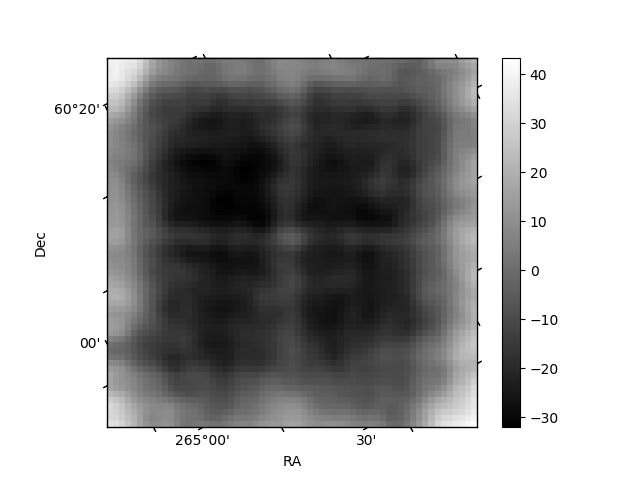
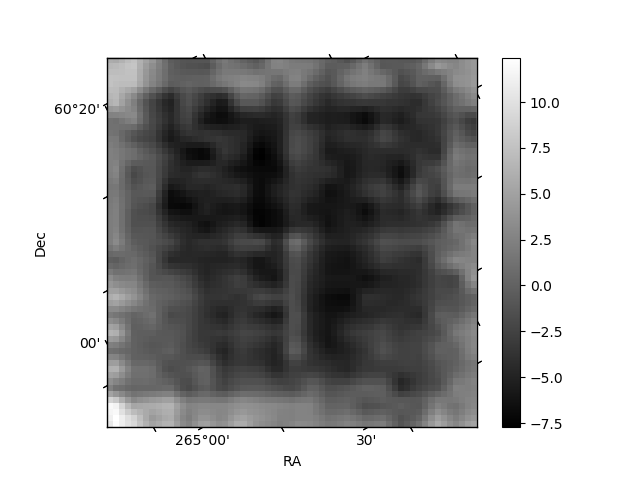
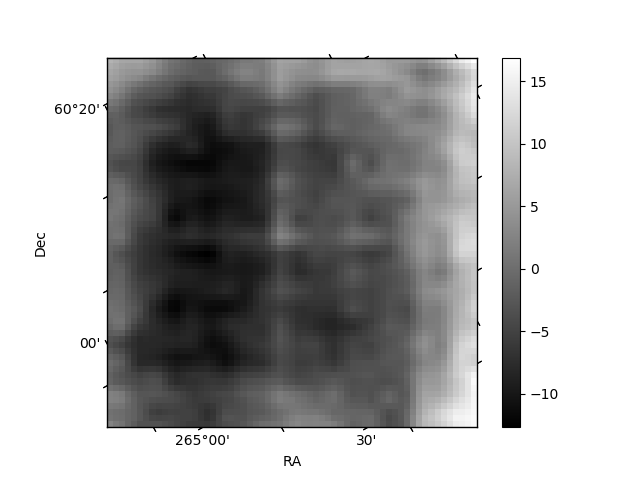
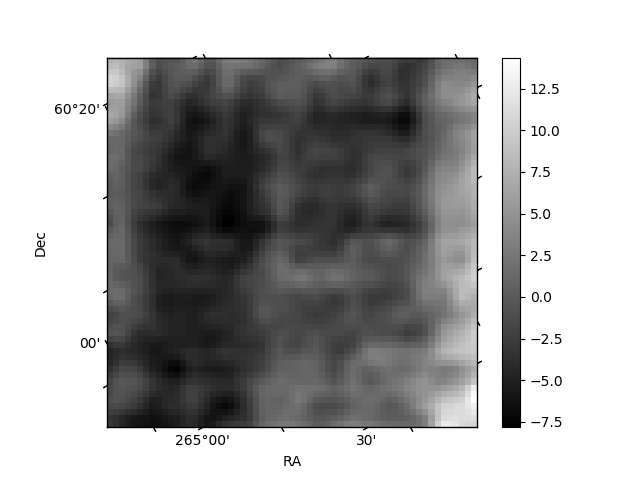
Histogram calculated using DETX and DETY for each event in the final _common_clean file
| Quadrant A | 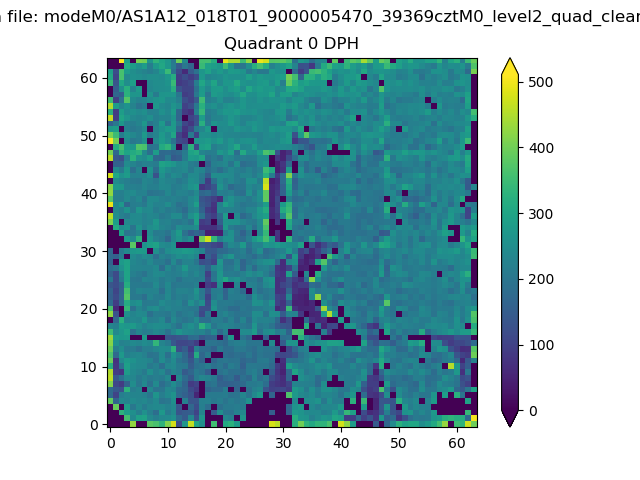 |
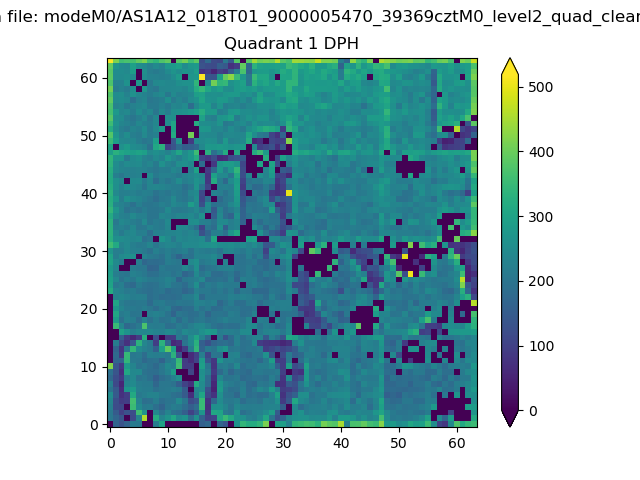 |
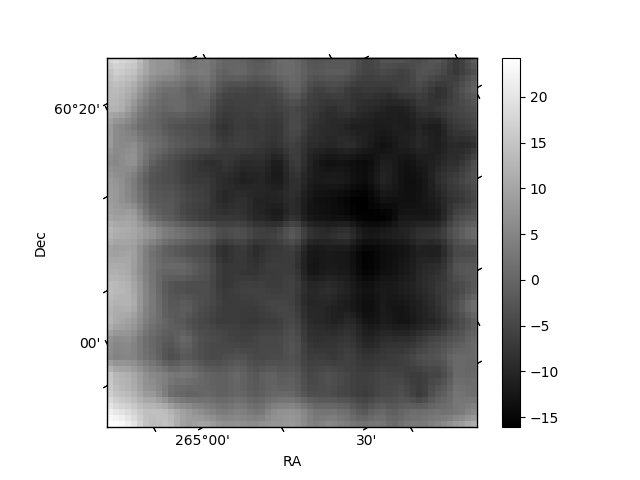
Quadrant B |
|---|---|---|---|
| Quadrant D | 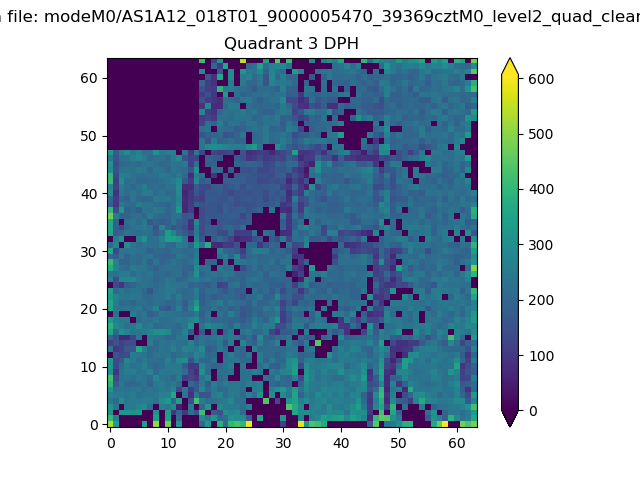 |
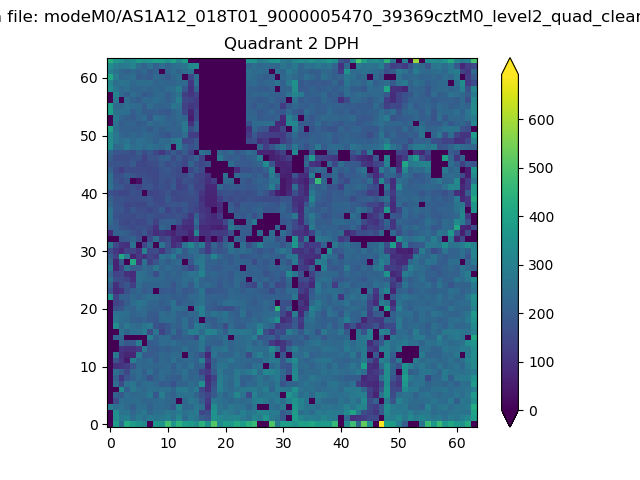 |
Quadrant C |
| Plot type | Count rate plots | Images |
|---|---|---|
| Comparison with Poisson distribution Blue bars denote a histogram of data divided into 1 sec bins. Red curve is a Poisson curve with rate = median count rate of data. |
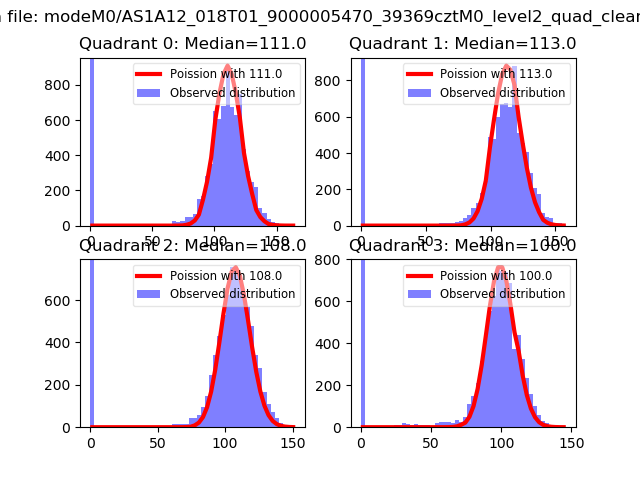 |
 |
| Quadrant-wise count rates Data is divided into 100 sec bins |
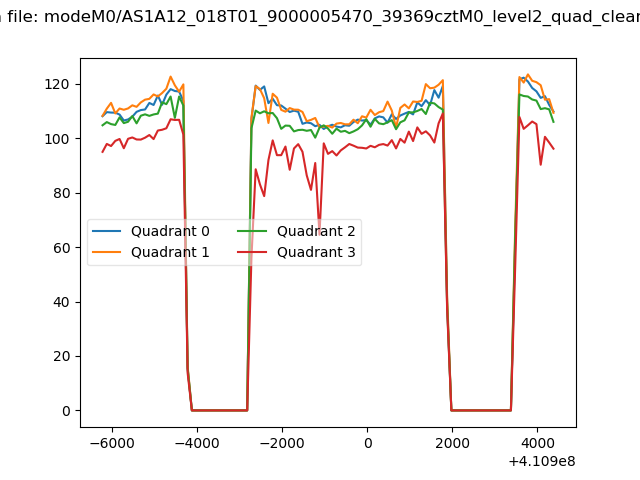 |
|
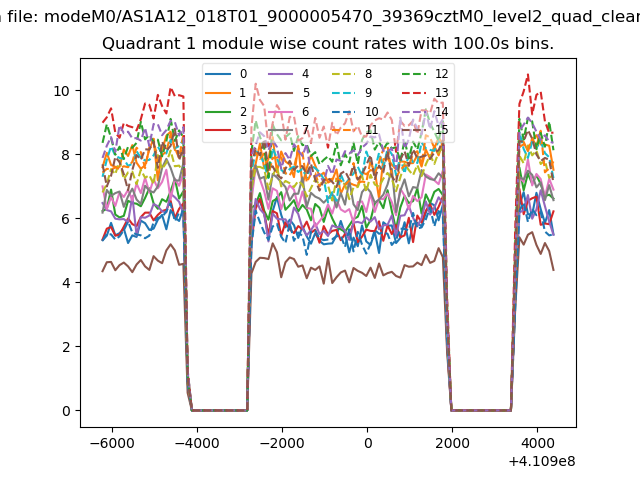
| Module-wise count rates for Quadrant A Data is divided into 100 sec bins |
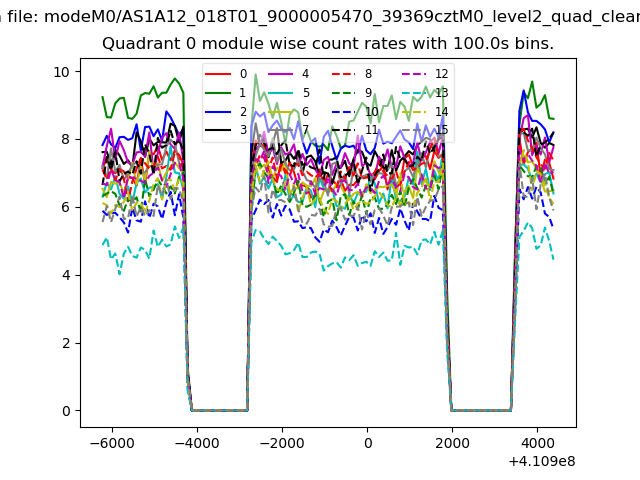 |
 |
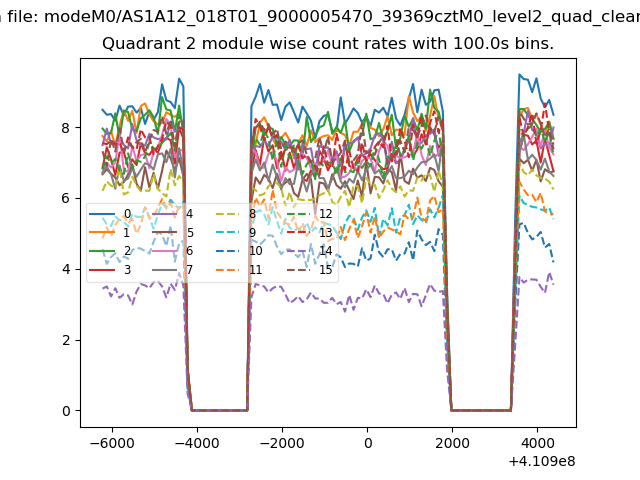
| Module-wise count rates for Quadrant B Data is divided into 100 sec bins |
 |
 |
| Module-wise count rates for Quadrant C Data is divided into 100 sec bins |
 |
 |
| Module-wise count rates for Quadrant D Data is divided into 100 sec bins |
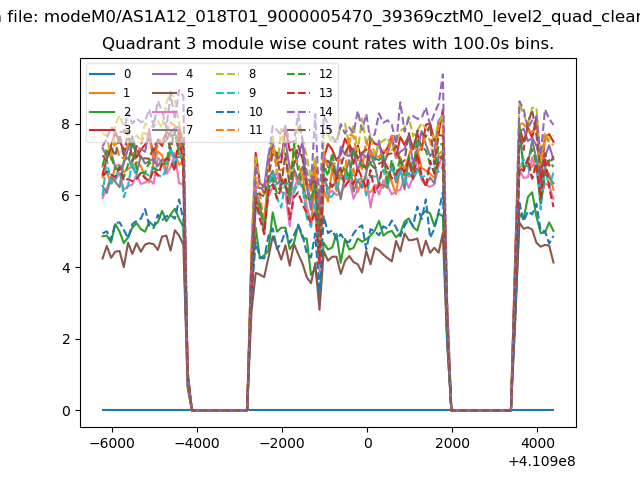 |
 |
| Parameter | Plot |
|---|---|
| CZT HV Monitor | 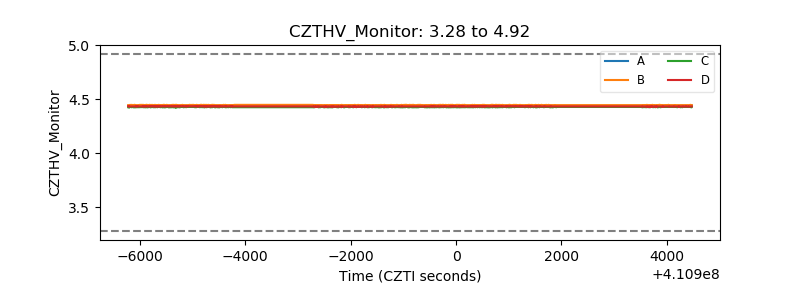 |
| D_VDD | 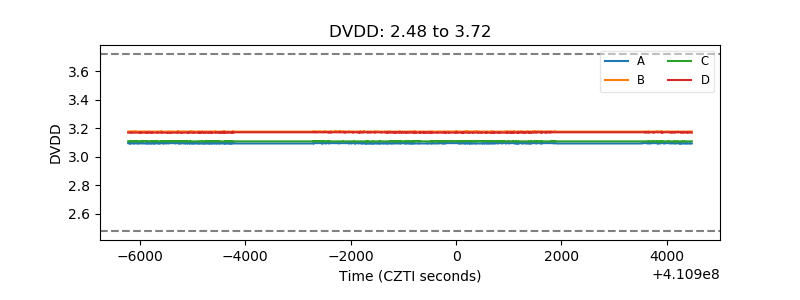 |
| Temperature 1 | 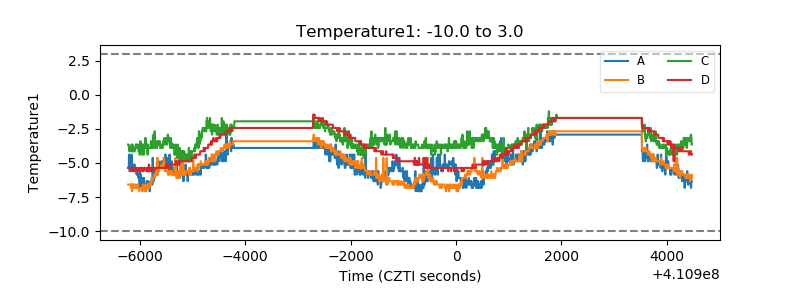 |
| Veto HV Monitor | 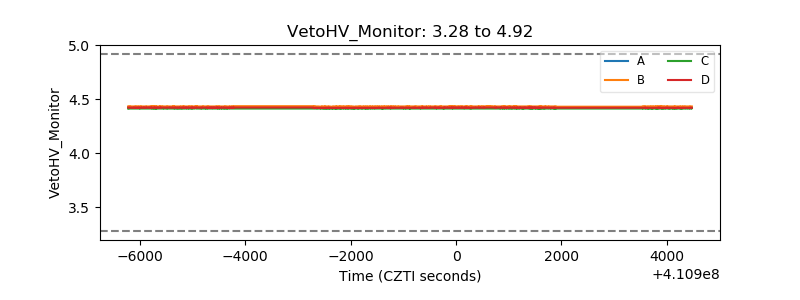 |
| Veto LLD | 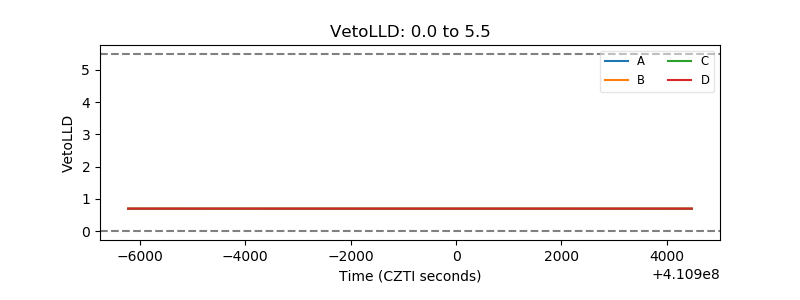 |
| Alpha Counter | 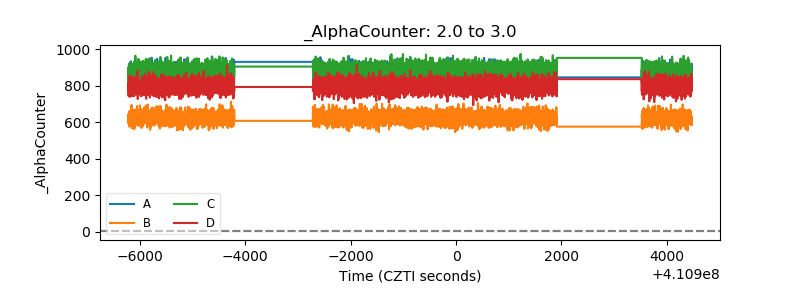 |
| _CPM_Rate | 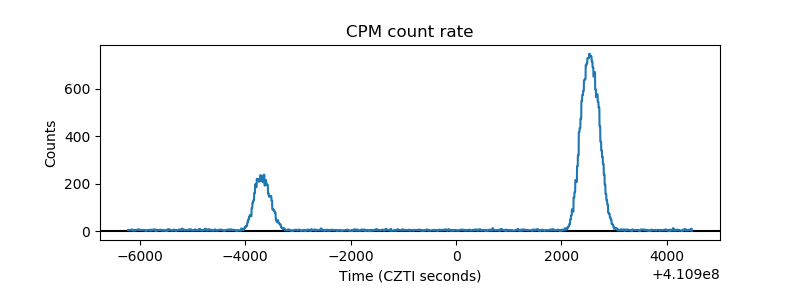 |
| CZT Counter | 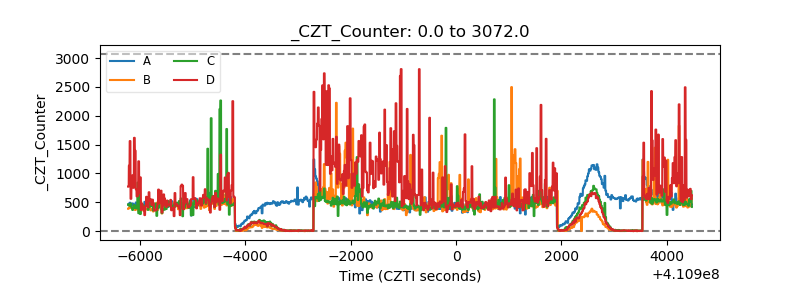 |
| +2.5 Volts monitor | 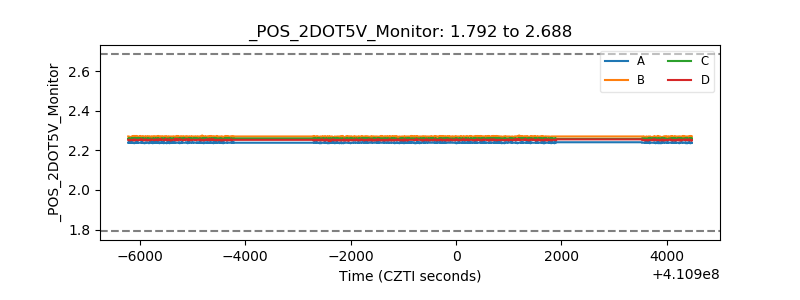 |
| +5 Volts monitor | 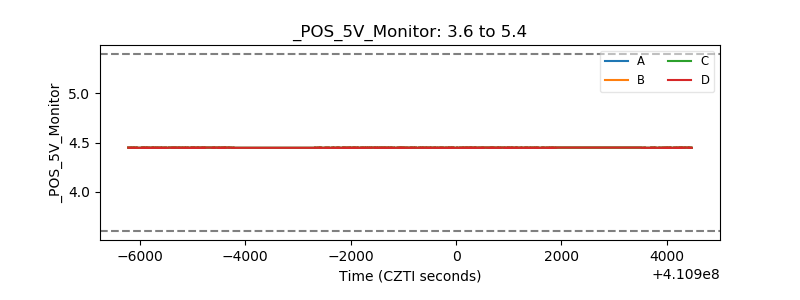 |
| _ROLL_ROT | 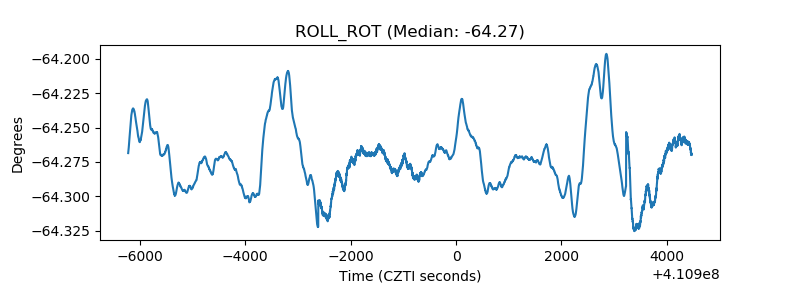 |
| _Roll_DEC | 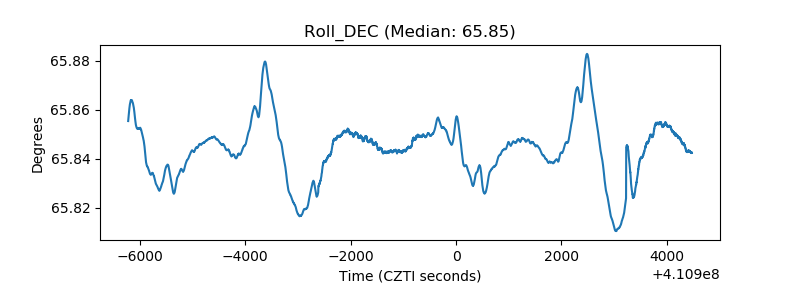 |
| _Roll_RA | 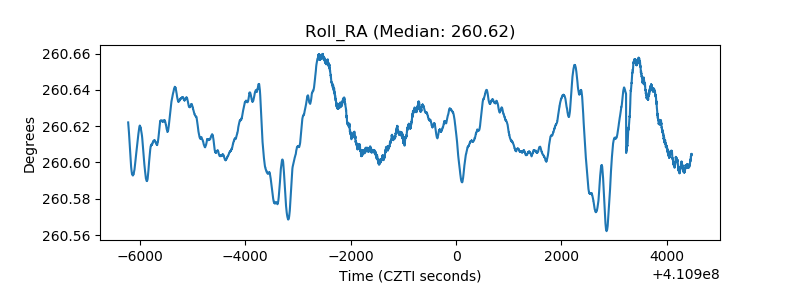 |
| Veto Counter | 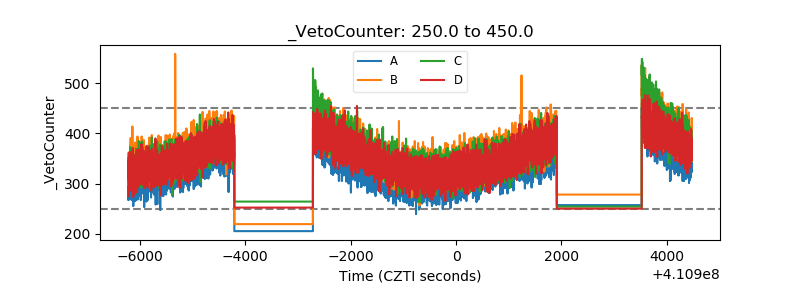 |